incorporates antecedents of CSB in the marketing literature and PPM theory of CSB, ... (0.19), low perceived reputation of current service provider (0.17), positive attitude towards switching (0.13), ... Kelleher, & Pihlstro, 2012; Kotler & Keller, 2012; Seo, ..... Which one of these words best describes how you see XYZ? Attitude.
ISSN: 2458 – 7419 International Journal of Business Innovation and Technology (IJBIT), Volume 1, Number. 1, March 2015, pp10-22
Developing a switching index for mobile telecommunication industry Simon Gyasi Nimako aand Benjamin Aggrey Ntimb a
University of Education, Winneba, Kumasi Campus, Ghana Accra Institute of Technology Business School, Accra - Ghana
b
Abstract The main purpose of this paper is to develop a theoretically grounded and handy switching index to enable managers measure mobile subscribers‟ propensity to switch from one mobile operator to another, and apply it to Ghana mobile telecom industry (GMTI). Drawing from the Synthesized Consumer Switching Model (SCSM), which incorporates antecedents of CSB in the marketing literature and PPM theory of CSB, a conceptual model of 21 antecedents of CSB was proposed for the purpose of developing an index that contains only a small number of significant switching factors. Through a cross-sectional survey design involving 736 mobile subscribers from six telecoms in GMTI, a regression analysis using partial least squares modelling was used to estimate the relative weights for the derived switching factors. The results indicate a six-factor index, in which low commitment and perceived network quality contribute a weight of 0.20 to consumer switching propensity, followed by overall switching intentions (0.19), low perceived reputation of current service provider (0.17), positive attitude towards switching (0.13), attractiveness competitor reputation (0.09) and the least weighted factor was peer influence (0.02). The derived NimakoNtim switching index was applied to sub-sample groups in GMTI. The procedures for deriving, applying and describing the index are thoroughly explained for managerial purpose. This paper fills the dearth of empirical studies that develop theoretically grounded switching index in general and especially in the telecom industry context. It also provides a handy tool that can help practitioners to conveniently assess and predict switching propensity of their consumers periodically. Keywords: switching index, mobile telecommunication industry, Ghana, consumer switching, partial least squares
1. Introduction Modern business organizations are increasingly developing strategies to understand, attract, engage, retain and build intimate long term relationship with profitable customers (Gro¨nroos, 2001; Kotler & Keller, 2012; Bolton, 2011; Gummesson, Kuusela, & Närvänen, 2014; Jaakkola & Alexander, 2014). This should lead to customer satisfaction, value, retention and profitability, among other things (Helkkula, Kelleher, & Pihlstro, 2012; Kotler & Keller, 2012; Seo, Ranganathan, & Babad, 2008). When firms are not able to retain customer, they switch to competitors. This can be very expensive as losing customers can mean staying out of business. Sam Walton, the founder of famous Wall Mart, said, “there is only one boss: the customer… He can fire everyone in the company, from the chairman on down, simply by spending his money elsewhere.” It becomes important for marketers and scholars to be able to understand the switching propensity and behaviour of customers in order to develop strategies to manage it effectively.In the literature much of the effort that has been made by scholars and practitioners have focused on developing and measuring switching intentions of customers (Bansal & Taylor 1999; Bansal, Taylor, & James, 2005; Gerrard & Cunningham, 2004; Keaveney, 1995). However, using switching intentions only to understand consumer switching propensity might not be adequate. This is because consumerswitching intentions itself is determined by a number of switching factors and antecedents, which have been identified in the extant marketing literature (Bansal et al., 2005; Gerrard &
Cunningham, 2004; Keaveney, 1995; Sathish, Kumar, & Jeevanantham, 2011; Lam & Hsu, 2006; Lopez, Redondo & Olivan, 2006;Manrai & Manrai, 2006). It, therefore, becomes critically important for managers and scholars to understand that other relevant variables have to be taken into account in order to fully capture consumers‟ switching propensity. It follows that consumer propensity to switch should capture salient factors that can be used to determine the extent to which consumers of a service provider are willing and able to switch to a competitor. This measurement should result in a switching index (SWIN). A switching index is an index for measuring mobile subscribers‟ propensity to switch. The switching index should incorporate other relevant variables that might directly determine switching propensity apart from switching intention itself. As far as researchers know, there is no such index for mobile telecom industry (MTI) in developing countries, especially in Ghana.The switching index could, therefore, be a handy tool to assist management to reasonably assess periodically consumers‟ propensity to switch as basis for managerial strategy in MTI. Therefore, in this paper, our main purpose is to develop and apply a switching index for predicting consumers‟ propensity to switch to serve as basis for management strategy in the MTI, using GMTIas the research context. 2. Literature Review 2.1 Theoretical basis for the switching index As already mentioned, the switching index captures not only switching intention but also other critical
10
ISSN: 2458 – 7419 International Journal of Business Innovation and Technology (IJBIT), Volume 1, Number. 1, March 2015, pp10-22
switching factors that directly determine consumer propensity to switch. In the extant marketing literature, many switching models and theories have been developed to understand the switching antecedents and determinants. Some of them are service quality (Bansal & Taylor, 1999) and its related factors such as core service failure (Keaveney, 1995; Lin, 2010; Lin & Mattila, 2006), service encounter failure (Gerrard & Cunningham, 2004; Lin & Mattila, 2006), service recovery failure (Gerrard & Cunningham, 2004; Keaveney, 1995; Bansal & Taylor, 1999), and inconvenience (Gerrard & Cunningham, 2004; Keaveney, 1995). Others include customer satisfaction/dissatisfaction (Bansal & Taylor 1999; Edvardsson & Roos 2003; Oyeniyi & Abiodun, 2010), price (Clemes et al., 2007; Keaveney, 1995; Manrai & Manrai, 2006) switching cost (Balabnis et al., 2006; Chiu et al., 2005), corporate reputation (Gerrard & Cunningham, 2004; Clemes et al., 2007), ethical problem (Keaveney, 1995), attraction from competitors (Gerrard &Cunningham, 2004; Keaveney, 1995; Lin & Mattila, 2006; Clemes et al., 2007), attitude towards switching, subjective norms
(and/or social influence), prior switching behavior (Bansal et al., 2004; 2005; Lam & Hsu, 2006; Sathish et al., 2011), relationship investment and characteristics (Chiu et al., 2005; Lopez et al., 2006) and attraction by competitors (Bansal et al., 2005; Keaveney, 1995) . One of the models that comprehensively captures switching determinants is the Push-Pull-Mooring (PPM) Migration Model of Service Switching (Bansal et al. 2005).The authors borrowed ideas from PPM theory of migration in human geography to explain marketing phenomenon. To them the movement of people from one place to another in human geography provided a correspondence between consumers‟ switching from one service provider to the other. Bansal et al. (2005) modelled consumer switching intention utilizing the adapted human migration models for examining consumer switching. The PPM theory of migration (see Figure 1) was first developed by Lee (1966) as Push-Pull model, and later extended by Bogue (1977) and Moon (1995) to include mooring dimension.
Figure 1: Push-Pull-Mooring (PPM) Migration Model of Service Switching (Bansal, Taylor, & James, 2005)
The PPM Theory, which originates from human migration literature, explains why people move from one place of origin to another for a time period (Bansal et al. 2005). According to the theory, push effects are negative factors that force people to move away from an original residence to another, such as unemployment, wars, loss of jobs, natural disasters, poverty (Lee, 1966; Moon, 1995). On the other hand, pull effects are positive factors that attract potential migrants to a new destination, such as better employment opportunities, peaceful environment, higher incomes and better economic conditions (Lee, 1966; Moon, 1995). The basic assumption of this theory is that negative factors at the origin push people away, while positive factors at the destination pull people toward them. These push and pull factors do not work in isolation but interdependently with the mooring factors. The mooring factors are equivalent to the moderating
variables, and act to either encourage migration or to deter the potential migrants from leaving their home or origin. Though mooring factors in migration literature were identified as personal and social factors that impact migration intentions and decisions (Moon, 1995), it could be extended to include any variable that has the potential of encouraging or deterring an individual‟s migration decisions. In their framework, Bansal et al. (2005) identified from the literature push factors like low service quality, low satisfaction, low value, low trust, low commitment, and high price perception. The only pull factor identified was alternative attractiveness. The mooring effects included factors such as unfavourable attitude towards switching, unfavourable subjective norms, high switching cost, infrequent prior switching behaviour and low variety seeking. Again the authors defined and presented a typology of switchers and their switching
11
ISSN: 2458 – 7419 International Journal of Business Innovation and Technology (IJBIT), Volume 1, Number. 1, March 2015, pp10-22
behaviour in comparison to the terminologies in the
PPM migration theory.
Push effects
Loyalty
Personal and social effects
MNP effects
Relationship strength effect
Switching intentions
Switching behaviour
Recommendation behaviour
Pull effects
Figure 2: SCSM (Nimako & Ntim, 2014) service quality (PSQ), perceived inconvenience Following Bansal et al.‟s (2005) pioneering study (PINC), perceived value (PV),perceived reputation that applied PPM model to CSB, the PPM theory quality of current service provider (PREPQ), consumer promises to be very useful theoretical framework in commitment (CMT), involvement in use of service predicting consumer switching intention and behaviour (UOS), attractiveness of corporate reputation (CREP), and other related social phenomena in business related attractiveness of competitor offerings (COFF), attitude disciplines (Cheng et al., 2009; Hou et al., 2011; Ye & towards switching (ATTSW), peer influence to switch Potter, 2011; Fu, 2011; Hsieh et al., 2012; Zhang et al. (PEER), general (consumer) curiosity (GC), 2012).More recently, due to its strength in terms of Knowledge of mobile number portability (KNMNP), empirical validity, comprehensiveness and contextual perceived porting cost (PPC), perceived usefulness of applicability of the PPM theory of consumer service MNP (PUSMNP), perceived switching cost (PSC), switching to the MTI, Nimako and Ntim (2014) have attitude towards MNP (ATTMNP), and MNP-induced advanced the Synthesized Consumer Switching Model switching efficacy (MNPSEF). (SCSM), which is depicted in Figure 2. The SCSM In the SCSM, there are three types of mooring introduces PP3M model for explaining consumer effects, namely, the personal and social mooring switching in telecommunication service context. (PSM) effects, relationship strength (RLS) effects and mobile number portability (MNP) effects. The SCSM forms the basis for the development of the switching The SCSM adequately captures 21 context-specific index due to its comprehensiveness, empirical validity variables in MTI that are grouped under push, pull, and the context-specific nature of the model. mooring determinants of mobile subscribers‟ switching intention and behaviour. The 21 variables are 2.2 Conceptual framework for the switching index satisfaction(SAT),perceived network quality (technical The conceptual framework for developing the quality) of current service provider (PNQ), price (PX), switching index is presented in Figure 3. It shows a perceived customer service (PCS), overall perceived six-step approach to the development of a simply and
12
ISSN: 2458 – 7419 International Journal of Business Innovation and Technology (IJBIT), Volume 1, Number. 1, March 2015, pp10-22
handy switching index. The first step is the identification of predictors of consumer switching. We identified 21 switching determinants based on the SCSM (Nimako & Ntim, 2014). In the second step, we fit a direct structural model of these switching factors to determine which of the individual antecedents has a significantly direct effect on switching intentions to be included in the index. In the third step, we retain all significant predictors as derived predictors of switching intentions. In the fourth step, we use the regression
weights of the derived predictors to create a switching index and use their measurement items to create measurement instrument for the switching index. Fifth, we develop the formula or procedure for the application of the index, which shows the details of the steps to be used in using the final switching index for estimating switching index for a sample of consumers of a service provider. Sixth and finally, we develop descriptors for describing various switching index levels.
Identify of predictors of switching
Application of index: measurement items and empirical illustration Fit a regression model of switching determinants
Develop descriptors for describing various switching index levels
Retain significant predictors/ derived predictors
Create switching index based on regression weights of derived predictors
Develop the formula or procedure for the application of the index
Figure 3: Conceptual framework for the study
3. Methodology 3.1 Population and sampling The dataset for the SCSM for estimating the switching index was based on a sample size of 736 respondents, statistically determined using Yamane‟s (1967, p. 886) formulaand drawn from a population of 27,244,579 individual subscribers (NCA, April, 2013) from all the six global mobile telecommunication operators in Ghana, namely: MTN Ghana, Vodafone Ghana, Airtel Ghana, Tigo, Expresso and Glo Ghana. The proposed index was tested using the same sample and dataset for each of the mobile operators‟ sub-sample.
of the effect of the 21 switching factors on switching intentions. PLS was appropriate because of its predictive focus, which is to maximize the variance in the dependent variable from a set of predictors (Chin, 2010).
4. Results 4.1 Analysis of direct effect of all independent variables The direct model is intended to provide information forderiving a set of small number of significant predictors of switching intention for the development of a switching index in MTI. The results of data analysis for direct model are presented in Tables 1 and 2, and Figures 1 and 2.In 3.2 Data analysis procedures Generally, data was analysed using Logistic the initial analysis in Table 1, 15 out of the 21 Regression in SPSS version 16.0 and Partial Least independent variables were not significant. Squares (PLS), specifically, SmartPLS 2.0 (Ringle, Therefore, they were removed and the analysis was Wende, & Will, 2005) to estimate the direct model re-run for the remaining six significant variables. Table 1 Direct model of antecedents of switching intentions S/No. 1 2 3 4 5
Structural Path PCS -> SINT PINCOV -> SINT PNQ -> SINT PREPQ -> SINT PSQ -> SINT
Weight 0.040 -0.012 0.114 0.135 -0.088
t-values 1.363 0.410 2.294 2.934 1.652
p-values 0.173 0.682 0.022* 0.003** 0.099
Remarks Not significant Not significant Significant Significant Not significant
13
International Journal of Business Innovation and Technology (IJBIT), Volume 1, Number. 1, March 2015, pp10-22
ISSN-L: 2458 – 7419 6 PV -> SINT 7 PX -> SINT 8 SAT -> SINT 9 COFF -> SINT 10 CREP -> SINT 11 ATTSW -> SINT 12 GC -> SINT 13 PEER -> SINT 14 PSC -> SINT 15 CMT -> SINT 16 UOS -> SINT 17 KNWMNP -> SINT 18 MNPSEF -> SINT 19 PPC -> SINT 20 PUSMNP -> SINT 21 ATTMNP -> SINT R-square (SINT)
0.038 0.033 0.049 0.142 0.049 0.317 0.055 0.059 -0.056 0.133 -0.022 0.039 0.004 -0.021 0.006 0.037 0.603
0.798 0.986 0.926 3.623 1.251 9.256 1.850 2.066 1.944 3.391 0.863 1.387 0.136 0.771 0.158 1.018
Not significant Not significant Not significant Significant Not significant Not significant Not Significant Significant Not significant Significant Not significant Not significant Not significant Not significant Not significant Not significant
0.425 0.325 0.355 0.000*** 0.211 0.000*** 0.065 0.039* 0.052 0.001** 0.389 0.166 0.892 0.441 0.875 0.309
Note: **significant at 0.001 two-tailed, or **Significant at 0.01 or * 0.05, SINT – overall switch intentions.
P PS Q
ATT SW
X
N
P
N
CS
S
PS C
S
PE ER
N
S
G
S
C
S
N
P NQ
N
S S
RE PQ
N
S
S
V
N S
S AT
S
Switch ing intentions R2 = 0.603
N
P
MNS EF
N S N
PEUM NP
S N
N
S N
S S
PIN
KWM NP
S
N
N
CO
S
COF F CRE P
S
S
PUSM NP
S C MT
ATTM NP
U OS
Figure 3. Direct model of antecedents of switching intentions Notes: NS. Non-significant path, S. – path significant at 0.05
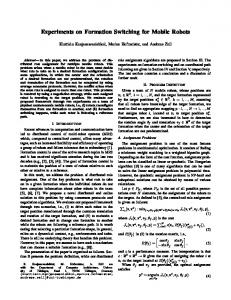
The results in Table 2 show that six of the firstorder independent constructs directly influenced switching intentions significantly. Specifically, they include two push effects, being low perceived network quality (PNQ) and low perceived corporate reputation/image quality (REPQ), one pull effect, being high attractiveness of competitor offer (COFF), two personal and social factor, being positive attitude towards switching (ATTSW) and positive peer
influence (PEER), and one relationship factor, being commitment to service provider (CMT). 4.2 Analysis of derived switching determinants In the final analysis of the direct model, together the independent variables predict 59% of variance in switching intentions, which is similar to the R-square (0.60) for the 21-variable model (see Table 1 and Figure 3). Attitude towards switching made the
14
International Journal of Business Innovation and Technology (IJBIT), Volume 1, Number. 1, March 2015, pp10-22
ISSN-L: 2458 – 7419 strongest contribution to switching intention, which is similar to the indirect model (weight = 0.336), this was followed by attractiveness of competitor offer, then commitment, corporate reputation of current service provider, perceived network quality and peer influence, being the least. It is worth noting that in the direct
model, commitment made the same contribution as service provider reputation quality (weight = 0.170). The results of the direct model will be used in further analysis to develop a switching index in the next section.
Table 2: Final direct model of antecedents of switching intentions Structural Path ATTSW -> SINT CMT -> SINT COFF -> SINT PEER -> SINT PNQ -> SINT PREPQ -> SINT R-square (SINT) ***Significant at 0.001, ** 0.01
Weight
t-values
p-values
0.33 0.15 0.18 0.06 0.13 0.15 0.590
10.9612 4.5891 6.5539 2.5988 3.3387 4.0925
0.000*** 0.000*** 0.000*** 0.004** 0.000*** 0.000***
Remarks Significant Significant Significant Significant Significant Significant
ATTSW
PNQ
S S
PEER
S
REPQ
Switching intentions R2 = 0.59
S
S S CMT
COFF
Figure 5.3.10 Final direct model of antecedents of switching intentions Notes: S. – path significant at 0.05
4.3 Deriving switching index The switching index is based on the final six independent variables in the direct model, in addition to an overall switching intention construct, which are presented in Table 3. It indicates the relative weight of each of the index factors or variables to the switching index. Since the total regression weights is above one, it is prudent to scaled all the weights to one in order to be able to
easily scale the switching index down to one or up to 100 points. Based on the scaled regression weights, the final switching index (SWX) is estimated as: SWX = ATTSW(0.13) - CMT(0.20) + COFF(0.09) + PEER(0.02) + PNQ(0.20) + PREPQ(0.17) + OVSINT(0.19)
15
International Journal of Business Innovation and Technology (IJBIT), Volume 1, Number. 1, March 2015, pp10-22
ISSN-L: 2458 – 7419 Table 3: Relative weight and significance of switching index factors Index factors ATTSW CMT COFF PEER PNQ PREPQ OVSINT Total weight
Weight (W) 0.17 0.26 0.12 0.03 0.25 0.22 0.25 1.30
W Scaled to 1 0.13 0.20 0.09 0.02 0.20 0.17 0.19 1.00
4.4 Derived measurement items for the switching index The six constructs and their respective measurement items for measuring the derived
T-value 19.3358 36.7056 16.4233 4.7374 26.4732 33.1611 43.7634
p-value 0.000 0.000 0.000 0.000 0.000 0.000 0.000
Remarks Significant Significant Significant Significant Significant Significant Significant
switching index are presented in Table 4. Appropriate Likert scale responses for each of the items could be used (e.g. strongly agree to strongly disagree, very likely to very unlikely, etc).
Table 4: Measurement items for derived switching index Construct Network quality (PNQ)
No. 3
Reputation (PREP)
3
Attitude towards switching
3
Peer Inf. (PEER)
2
Commitment CMT
3
Switching intention(SINT)
3
18 Measurement items I believe that the quality of XYZ network services is……. Generally, on XYZ network, there is high speed for telecom services (calls, SMS, etc) Overall, I experience high network clarity when making calls on XYZ network. I am able to successfully complete calls without failures in XYZ‟s network XYZ mobile network seems to have good reputation for quality XYZ telecom is well known as a good and socially responsible. Which one of these words best describes how you see XYZ? For me switching from one mobile network to another is … For me changing from one network to another is a decision that is… The idea of changing from one mobile network to another is to me a …… My loved ones, friends and colleagues encourage me to switch to networks services they use. I usually want to use the mobile network of important people in my life (e.g. business partners). I am really committed to XYZ as my mobile network provider. I feel a strong sense of „belonging‟ to XYZ network. I really love XYZ services. Do you have the intention of switching to use a better mobile network services in the next year? How likely are you to switch from XYZ to a different network in the next two years? Are you considering changing from XYZ to a better mobile telecom network soon?
4.5 How the switching index works: procedure for applying it The procedure for estimating the switching index for a given dataset of customers of any service provider is outlined below: Step I. Calculate the weight (W) of each category of Likert scale response. Assuming the highest value in the Likert scale is five, five will be scaled to a weight of one and the weight of the rest of scale points are estimated as a fraction of one as in Table 5.4.3. Please note that the scale points for CMT, PNQ, REPQ, ATTSW and SINT are reverse coded and accordingly weighted due to the implied meanings of their scale points. This means, for example, that responses such as “very likely / Definitely yes / strongly agree” should
be weighted 0.4, “Likely/a bit yes/agree” should be weighted 0.3, “neutral/can‟t really tell” (this point is technically not zero as conventional wisdom may suggest) should be weighted 0.2, “Unlikely/a bit no/disagree” should be weighted 0.1, and “Very unlikely/definitely no/strongly disagree” should be weighted zero (0). Step II: Find frequency of observations (FO) for each Likert scale response (LSR) for each question item for each construct. Step III: Multiply the weight (W) of each scale response by the frequency of observation (FO) each scale response for each question item for each construct to get weight observations (WO).
16
International Journal of Business Innovation and Technology (IJBIT), Volume 1, Number. 1, March 2015, pp10-22
ISSN-L: 2458 – 7419
weighted observation (RWO) for each construct. Step VII: Multiply each RWO of each construct by their respective scaled regression weight (SRW) to arrive at the index for each construct. Step VIII: Add all the index for each construct to arrive at the grand switching index. This index can be scaled up to 100% by multiplying it by 100. The above steps and procedure can be computed into excel spread sheet. A copy of this can be obtained from the author upon request.
Step IV: Find the sum of all the weighted observations (WO) for each scale response for each question item for each construct to arrive at total weighted observation (TWO). Step V: Multiply the total weighted observations for each item by the highest/maximum scale point weight (i.e. 0.4) to get the maximum weighted observation (MWO) for item (IMWO) and for each construct (CMWO). Step VI: Find the total weighted observations (TWO) as a fraction of the maximum weighted observation (MWO) by dividing the MWO by the TWO to get the Relative
Table 5 procedure and components of the switching index Construct
LSR
Code
Question item 1
SD D N A SA
1 2 3 4 5
0 0.1 0.2 0.3 0.4
SD D N A SA
1 2 3 4 5
0 0.1 0.2 0.3 0.4
SD D N A SA
1 2 3 4 5
0 0.1 0.2 0.3 0.4
Total FO Total WO for item 1 (ITWO) Question item 2
Total FO Total WO for item 2 (ITWO) Question item 3
W
FO 26 44 338 243 85 736 20 41 297 300 78 736 28 30 300 200 178 736
WO
RWO
RIndex (RWO × scaled W)
0 4.4 67.8 72.9 34 179.1 0 4.1 59.4 90 31.2 184.7 0 3 60 60 71.2
Total FO/ITWO for item Total WO for item 3 (ITWO) 194.2 Total FO for construct 736+736+736 2208 Maximum weighted observation (MWO) – construct 2208 × 0.4 883.2 TWO for a construct (CTWO) (179.1+184.7+ 194.2) 558 CTWO÷MWO = Relative Weighted Observation (RWO) 558/883.2 0.632 RWO × SRW = construct index 0.632 × 0.13 0.082 Add all construct indexes The final result is the Switching Index Notes: LSR - Likert scale response, SD - Strongly disagree, D - Disagree, N- Neutral, A- Agree, SA - Strongly agree, FO – frequency of observation, W-weight (scale is reverse coded for CMT, PNQ, REPQ, ATTSW, SINT), WO – weighted observation, TWO – total weighted observation, SRW – scaled regression weight.
17
International Journal of Business Innovation and Technology (IJBIT), Volume 1, Number. 1, March 2015, pp10-22
ISSN-L: 2458 – 7419 4.6 Descriptors of the switching index According to Table 6, for a description of the index, an index ranging from 0 – 30 is extremely weak/low, 31 – 40 is very weak/low, 41 – 49 is fairly weak/low, 50 – 59 is strong/high, 60-79 is very strong/high, and 80-100 is extremely strong/high. Table 6: Descriptors of switching index Switching index 80 – 100 60 – 79 50 – 59 41-49 31- 40 0 – 30
Description Extremely strong Very strong Strong Fairly Weak Very weak Extremely weak
4.7 Estimating switching index for six mobile network operators Based on the procedure for using the switching index, the switching index was estimated for respondents of each of the six mobile telecom networks. These six sub-groups are Expresso (n = 40), Glo (n = 55), Airtel (n = 102), Tigo (n = 61), Vodafone (n = 177) and MTN (n = 301) respectively. A summary of results of switching index for the subgroups is presented in Table 7. Specifically, it is confirmed that using only overall switching intentions construct, MTN respondents showed the strongest intention to switch (0.65), followed by Tigo (0.50) and Expresso respondents (0.46), while respondents of Vodafone appear to have the lowest switching intentions (0.36) , followed by Glo (0.41) and Airtel respondents (0.41). Moreover, in Table 7, results indicate switching index for the industry and each of the six companies. The industry recorded a fairly weak switching index of 0.46. Among the six industry players, MTN recorded the highest switching index (0.54) which could be described as strong, followed by Tigo with an index of 0.48 which is fairly weak, Expresso recorded a switching index of 0.45, which is fairly weak. Airtel recorded 0.43, Glo recorded 0.42 and Vodafone recorded 0.42. Thus, among the respondents of the six companies, it is obvious that Vodafone respondents has the weakest switching propensity, followed by Glo, Airtel, Expresso and then Tigo. MTN respondents consistently demonstrate strong intentions to switch to new service providers in the industry. 5. Discussion The overarching purpose of this sub-section of the study was to measure the switching intentions of mobile subscribers and develop a switching index to assess the switching propensity of customers in MTI in general and GMTI in particular. The study provides empirical support for differences in switching intentions and switching index among customers of the six mobile network operators in GMTI. Also, this study developed a switching index for assess consumer
propensity to switch, which is based on most significant direct switching factors in GMTI. The regression equation for the switching index is as follows: SWX = ATTSW(0.13) - CMT(0.20) + COFF(0.09) + PEER(0.02) + PNQ(0.20) + PREPQ(0.17) + OVSINT(0.19) WhereSWX – switching index, ATTSW – favourable attitude towards switching, low CMT – consumer commitment, COFF – high attractiveness of competitor offerings, PEER – favourable peer influence to switch, PNQ – low perceived network quality (technical quality) of current service provider, PREPQ – low perceived reputation quality of current service provider, OVSINT – high overall switch intentions. This study indicates consistent results for overall switching intentions for the mobile network companies. This is demonstrated by results of the switching index, test of differences for switching intentions among respondents, and descriptive analysis of switching index.The results generally show that the switching index for the industry is fairly weak. Amongst the mobile network operators, MTN respondents showed high or strong intention different from the other service providers. Vodafone appear to have the lowest switching index, followed by Glo, Airtel, Expresso and Tigo respondents respectively. Comparing this finding with what was found by previous researchers (Nimako et al., 2010), there is strong evidence that MTN Ghana stand the risk of losing customers to other competitors in the next few years since consistently their customers expressed stronger intentions to switch. This implies that there might be technical and functional quality issues of service delivery that MTN is missing out in meeting customers‟ desires and expectations (Nimako, 2012d; Nimako, 2012e; Nimako et al., 2010). It might also be that other competitors in the industry are able to attract customers from MTN. Such strong attractions are able to influence customers to develop strong intentions to switch (Bansal et al., 2005). The implication to the management of MTN Company is that they should endeavour to improve upon its network quality and corporate reputation, in addition to other relevant marketing strategies in order to reduce the degree of switching propensity of its customers. On the other hand, Vodafone respondents has the weakest switching propensity, followed by Glo, Airtel, Expresso and then Tigo. This finding suggests that the management of Vodafone has significantly improved upon its delivery of service quality and satisfaction of customers through effective service management strategies. Compared with their performance in 2009 when Vodafone went into management crisis that led to the switching of many of its customers to other firms in GMTI (Nimako et al., 2010), the new management appears to have been able to win back the confidence
18
International Journal of Business Innovation and Technology (IJBIT), Volume 1, Number. 1, March 2015, pp10-22
ISSN-L: 2458 – 7419 of existing customer and attracted new ones who have little intentions to switch. For the other companies such as Glo, Expresso, Airtel and Tigo, their respondents have fairly weak intentions to switch to networks. This implies that management of these companies should keep improving their service quality and value to customers in an attempt to influence customers‟ intentions to switch. Second, the findings imply that, practically, National Communication Authority (NCA) in Ghana can use the index to achieve two main purposes. One, the NCA could use the index for measuring, as an independent body, the switching propensity of mobile subscribers for GMTI to enhance its managerial
decision making as well as industry statistics for other users. Second, the NCA can use the results of the index to provide managerial advice to mobile telecom operators regarding the operators‟ attempts to improving service quality to customers in the telecom industry, especially network quality and reputation quality. The other mobile network operators should endeavour to reduce the intentions of their consumers to switch completely to a new service provider by encouraging them to use the MNP platform, improving network quality, corporate reputation for quality, customer service, customer value, reducing consumer inconveniences and rates/charges for calls and other mobile telecom services.
Table 7:Switching Index for mobile companies in GMTI Weight
Full sample (Industry) RWO
ATTSW 0.13 CMT 0.20 COFF 0.09 PEER 0.02 PNQ 0.20 PREPQ 0.17 OVSINT 0.19 Overall Switching Index Remarks
0.59 0.44 0.48 0.49 0.43 0.40 0.46
Expresso (n = 40)
Index
RWO
0.08 0.04 0.04 0.01 0.08 0.07 0.09 0.46 Fairly weak/ low
0.56 0.44 0.58 0.42 0.24 0.53 0.46
Glo (n = 55)
Index
0.07 0.09 0.05 0.01 0.05 0.09 0.09 0.45
Fairly weak/low
RWO
Index
0.55 0.44 0.51 0.51 0.32 0.37 0.41
0.07 0.09 0.05 0.01 0.06 0.06 0.08 0.42
Fairly weak/low
Tigo (n = 61) RWO
Airtel (n = 102)
Index
RWO
Index
0.07 0.09 0.05 0.01 0.08 0.08 0.10 0.48
0.56 0.44 0.56 0.53 0.34 0.36 0.41
0.07 0.09 0.05 0.01 0.07 0.06 0.08 0.43
0.55 0.44 0.56 0.56 0.41 0.48 0.50 Fairly Weak/low
Fairly Weak/low
Vodafone ( n = 177) RWO
MTN (n = 301)
Index
RWO
0.07 0.09 0.05 0.01 0.07 0.05 0.07 0.40
0.65 0.44 0.37 0.45 0.55 0.54 0.65
0.51 0.44 0.61 0.56 0.34 0.29 0.36 Fairly Weak/low
Index
0.09 0.09 0.03 0.01 0.011 0.09 0.13 0.54 Strong/high
RWO - Relative Weighted Observation
5.1 Theoretical contribution First, theoretically, this research makes a major contribution to the field of marketing by developing a switching index that is theoretically grounded and provides a handy and simple managerial tool for management and policy makers of MTIby developing a switching index that is theoretically grounded and simple to use by marketing practitioners. Theoretically, the index is based on the synthesized consumer switching model (SCSM) which is grounded in the PPM migration theory of consumer service switching (Bansal et al., 2005; Moon 1995). The index is based on the direct model of SCSM which has similar predictive power of 59% of switching intentions comparable to the full combined, indirect SCSM. In effect, the simplicity of index factors does not affect the novelty and relevance of the index developed. The development of the switching index is an attempt to fill the gap in the marketing literature regarding tools for measuring consumer propensity to switch in MTI. This switching index is named Nimako-Ntim Switching Index or N-N Switching Index for short. Second, the index highlights the theoretical importance of the six marketing constructs that form the bases for the development of the index. It implies that in the GMTI, these switching factors are critically important in predicting consumer switching decisions since they have significantly direct effect on switching behaviour as found in other similar research (e.g.
Bansal et al., 2005). These directly critical switching factors are favourable attitude towards switching, low consumer commitment, high attractiveness of competitor offerings, favourable peer influence to switch, low perceived network quality of current service provider, low perceived reputation quality of current service provider and high overall switch intentions. Theoretically, these six constructs emphasise the relevance of the PPM migration model of consumer switching (Bansal et al., 2005; Bougue 1977; Moon 1995) in a fundamentally simplified model of switching. This is because each component of the PPM constructs are represented in the six constructs in the simplified, direct model. More specifically, there are two push effects, being low perceived network quality (PNQ) and low perceived corporate reputation/image quality (REPQ), one pull effect, being high attractiveness of competitor offer (COFF), two personal and social factor, being positive attitude towards switching (ATTSW) and positive peer influence (PEER), and one relationship effect, being commitment to service provider (CMT). Marketing scholars hoping to develop simplified models of consumer switching should consider incorporating these six due to their fundamentally relevance in explaining consumer switching intentions directly in MTI.
19
International Journal of Business Innovation and Technology (IJBIT), Volume 1, Number. 1, March 2015, pp10-22
ISSN-L: 2458 – 7419 Third, the index provides other researchers the opportunity to develop similar switching index for different industries. Other researchers can use the variables in the index and add other relevant ones to enrich the usefulness of the index in specific service industries. 5.2 Implications to management Managerially, the development of the switching index in this study, The Nimako-Ntim Switching Index (or N-N Switching Index) implies that managers and industry regulators can use this index as an effective tool to measure and assess mobile subscribers‟ propensity to switch in GMTI and in other similar MTI in the world. This exercise could reveal areas for improvement in service delivery such as service provider network quality, corporate reputation, consumer attitude towards switching, commitment to service provider, consumer attraction to competitor offers, and peer influence to switch, which are critical and direct determinants of switching intentions comparable to the newly proposed CSB model, SCSM. The outcome will in turn serve as basis for developing effective marketing strategies for retaining existing customers. The National Communication Authority (NCA) in Ghana can use the index to achieve two main purposes. One, the NCA could use the index for measuring, as an independent body, the switching propensity of mobile subscribers for GMTI to enhance its managerial decision making as well as industry statistics for other users. Second, the NCA can use the results of the index to provide managerial advice to mobile telecom operators regarding the operators‟ attempts to improving service quality to customers in the telecom industry, especially network quality and reputation quality. In this regard,the findings indicate that, the industry recorded a fairly weak switching index of 0.46. With respect to competing mobile telecom players in GMTI, propensity to switch was comparatively stronger among MTN mobile subscribers than the other networks. Customers of MTN brand recorded a Nimako-Ntim switching index of 0.54, described as strong, followed by Tigo with an index of 0.48 which is fairly weak, Expresso recorded a switching index of 0.45, which is fairly weak. Airtel recorded 0.43, Glo recorded 0.42 and Vodafone recorded 0.42. The implication to the management of MTN Company is that they should endeavour to improve upon its network quality and corporate reputation, in addition to other relevant marketing strategies in order to reduce the degree of switching propensity of its customers. For the other companies such as Vodafone, Glo, Expresso, Airtel and Tigo, their respondents have fairly weak intentions to switch to networks. This implies that management of these companies should keep improving their service quality and value to customers in an attempt to influence customers‟ intentions to switch.
6. Conclusion, limitations and future research The main purpose of this paper is to develop and apply a theoretically grounded and handy switching index to enable managers measure mobile subscribers propensity to switch from one mobile operator to another in Ghana. It is important for managers and scholars to understand relevant variables that have to be taken into accounts in order to fully capture consumers‟ switching propensity. Drawing from SCSM model, which incorporates antecedents of CSB in the marketing literature and PPM theory of CSB, a conceptual model of 21 antecedents of CSB was proposed for the purpose of developing an index that contains only a small number of significant switching factors. Using dataset from 736 mobile subscribers from six telecoms in Ghana‟s mobile telecommunication industry (GMTI), the proposed model was tested using Partial Least Squares Structural Equation Modelling approach (PLS-SEM) to derive a six-factor reduced model of switching determinants. Finally, a regression analysis using PLS path modelling was used to estimate the relative weight for each switching factor for the development of a switching index. The results indicated that, from the six-factor index, low commitment and perceived network quality contribute a weight of 0.20 to consumer switching propensity, followed by overall switching intentions (0.19), low perceived reputation of current service provider (0.17), positive attitude towards switching (0.13), attractiveness competitor reputation (0.09) and the least weighted factor was peer influence (0.02). Moreover, by applying the switching index in GMTI and for its competing players, the findings indicate that, the industry recorded a fairly weak switching index of 0.46. With respect to competing mobile telecom players in GMTI, propensity to switch was comparatively stronger among MTN mobile subscribers than the other networks. Customers of MTN brand recorded a switching index of 0.54, described as strong, followed by Tigo with an index of 0.48 which is fairly weak, Expresso recorded a switching index of 0.45, which is fairly weak. Airtel recorded 0.43, Glo recorded 0.42 and Vodafone recorded 0.42. The procedures for deriving, applying and describing the index are thoroughly explained for managerial purpose. This paper fills the dearth of empirical studies that develop theoretically grounded switching index in general and especially in the telecom industry context. It, therefore, provides a handy tool that can help mobile telecom managers and practitioners to conveniently assess and predict the propensity to switch of their customers periodically. The limitations of the study provide avenues for future research. First, the sample used in this research are from Ghana only and the variables included are context-specific to the MTI. It is recommended that future research should extend the application of the Nimako-Ntim switching index to other MTI contexts
20
International Journal of Business Innovation and Technology (IJBIT), Volume 1, Number. 1, March 2015, pp10-22
ISSN-L: 2458 – 7419 and compare the results with those found in this study. Moreover, future research should extend this index to different service context and develop a modified versions that take into account context-specific variables in other service contexts. References [1] Bansal, H. S., & Taylor, S. F. (1999). The service provider switching model (SPSM): A model of consumer switching behaviour in the services industry. Journal of Service Research, 21,200 218. [2] Bansal, H. S., Irving, P. G., & Taylor, S. F. (2004). A three component model of customer commitment to service provider. Journal of the Academy of Marketing Science, 32(3),234250.DOI:10.1177/0092070304263332 [3] Bansal, H. S., Taylor, S. F., & Y. James. (2005). “Migrating” to New Service Providers: Toward a Unifying Framework of Consumers' Switching Behaviors. Journalof the Academy of Marketing Science,33(1). 96-115. DOI:10.1177/0092070304267928. [4] Bogue, D. J. (1977). A Migrants-Eye View of the Costs and Benefits of Migration to a Metropolis. InInternal Migration: A Comparative Perspective. New York: Academic Press, 167-182. [5] Cheng, Z., Yang, Y., & John, L. (2009). Cyber Migration: An Empirical Investigation on Factors that Affect Users‟ Switching Intentions in Social Networking Sites Proceedings of the 42ndHawaii International Conference on System Sciences, 2009 [6] Chin, W. (2010). How to write up and report PLS analyses. In: EspositoVinzi V, Chin W.W, Henseler J, Wang H (eds) Handbook of partial least squares: concepts, methods and applications. Springer Heidelberg, 655 – 690. [7] Clemes, M. D., Gan, C., & Zheng, L, Y. (2007). Customer switching behaviour in theNew Zealand banking industry. Banks and Bank Systems, 2(4), 50-65. [8] Edvardsson, B., & Roos, I. (2003). Customer Complaints and Switching Behavior- A Study of Relationship Dynamics in a Telecommunication Company. Journal of Relationship Marketing, 2 (1/2), 43-68. [9] Fu, J. R. (2011). Understanding career commitment of IT professionals: Perspectives of push-pull mooring framework and investment model. International Journal of Information Management,31(3), 279–293. doi>10.1016/j.ijinfomgt.2010.08.008 [10] Gerrard, P., & Cunningham, J. B. (2004). Consumer switching behavior in the Asian banking market. Journal of Services Marketing, 18, 215-223. [11] Gro¨nroos, C. (2001). The Perceived Quality Concept: a mistake? Managing Service Quality11(3),150-152.
[12] Gummesson, E., Kuusela, H., & Närvänen, E. (2014). Reinventing marketing strategy byrecasting supplier/customer roles. Journal of Service Management, 25(2), 228 - 240. [13] Helkkula, A., Kelleher, C., & Pihlstro ¨ m, M. (2012). Characterizing value as anexperience: implications for service researchers and managers. Journal of Service Research,15 (1), 59-75. [14] Hou, A.C.Y., Chern, C.C., Chen, H.G., & Chen, Y.C. (2011). Migrating to a New VirtualWorld‟: Exploring MMPORG Switching through Human Migration Theory. Computers in HumanBehavior, 27(5), 1892–1903. doi>10.1016/j.chb.2011.04.013 [15] Hsieh, J. K., Hsieh, Y. C., Chiu, H.C., & Feng, Y.C. (2012). Post-Adoption Switching Behavior for Online Service Substitutes: A Perspective of the Push–Pull–Mooring Framework. Computers in Human Behavior, 28, 1912–1920. [16] Jaakkola, E., & Alexander, M. (2014). The Role of Customer Engagement Behavior in ValueCo Creation A Service System Perspective. Journal of Service Research, 1-15.DOI: 1094670514529187. [17] Keaveney, S. M. (1995). Customer switching behavior in service industries: An exploratory study. Journal of Marketing, 50. (2), 71-82. [18] Kotler, P., & Keller, K.L. (2012). Marketing Management 14th Edition, Upper Saddle River, NJ: Prentice Hall [19] Lam, T., & Hsu, C. H. C. (2006) Predicting behavioral intention of choosing a travel destination. Tourism Management, 27, 589-599. [20] Lee, E. S. (1966). A Theory of Migration. Demography, 3 (1), 47–57. [21] Lin, I. Y. H., & Mattila, A. S. (2006) Understanding restaurant switching behavior from a cultural perspective. Journal of Hospitality & Tourism Research, 31, 3-15. [22] Lopez J. P. M., Redondo Y. P., & Olivan, F.J.S. (2006). The impact of customer relationship characteristics on customer switching behaviour. Difference between switchers and stayers, Managing Service Quality, 16 (6), 556 – 574. [23] Manrai, L.A., & Manrai, A. K. (2007). A Field Study of Consumers‟ Switching Behavior for Bank Services. Journal of Retailing and Consumer Services, 14, (3), 208- 217. [24] Moon, B. (1995). Paradigm in Migration Research: Exploring 'Moorings' as a Schema. Progress in Human Geography, 19, 504–524. [25] Nimako, G. S., Azumah, K. F., Donkor, F., &AduBrobbey, V. (2010). Overall Customer Satisfaction in Ghana‟s Mobile Telecommunication Networks: Implications for Management and Policy.African Technology Development Forum, 7(3/4), 35-49. [26] Nimako, S.G., & Ntim, B. A. (2014). Modelling the Antecedents and Consequence of Consumer Switching Intentions in Ghana Mobile Telecommunication Industry. Forthcoming paper
21
International Journal of Business Innovation and Technology (IJBIT), Volume 1, Number. 1, March 2015, pp10-22
ISSN-L: 2458 – 7419
[27]
[28]
[29]
[30]
[31]
(article in press) in the International Journal of Business and Emerging Markets. Ringle, C.M., Wende, S., & Will, S. (2005). SmartPLS 2.0 (M3) Beta. Hamburg, http://www.smartpls.de. Sathish M., Kumas K.S., & Jeevanantham, K.J.V. (2011). A study on consumer switching behaviour in cellular service provider: A study with reference to Chennai, Far East Journal of Psychology and Business, 2(2), 71-81. Seo, D., Ranganathan, C., & Babad, Y. (2008). Two-level model of customer retention in the US mobile telecommunications service market. Telecommunications Policy, 32(3), 182-196. Ye, C., & Potter, R. (2011). The Role of Habit in Post-Adoption Switching of Personal Information Technologies: An Empirical Investigation. Communications of the Association for Information Systems, 28(1), 585-610.Available at: http://aisel.aisnet.org/cais/vol28/iss1/35 Zhang, K.Z.K., Cheung, C.M.K., & Lee, M.K.O. (2012). Online service switching behavior: The case of blog service providers. Journal of Electronic Commerce Research, 13(3), 184 -197.
22