Term of Financing. 20 years. 25 years. 30 years. Interest Rate. 5%. 5%. 5%. Debt Service/AF. ($373). ($330). ($302). 2005 © American ... Anecdotal evidence suggest that a potential 20% energy saving may be achieved using the 2-pass NF ...
Developing an Experimental Protocol for Evaluating Low-pressure Desalting Membranes for Seawater Desalination Tai Tseng, Robert C. Cheng, Diem X. Vuong, and Kevin L. Wattier Long Beach Water Department, 2950 Redondo Ave., Long Beach, CA 90806 The Long Beach Water Department (LBWD), similar to many Southern California utilities, have been facing the issue of decreased potable water supplies. Because of its location, the City of Long Beach is ideally situated to take advantage of desalinated seawater as a source of drinking water. However, the primary barrier to seawater desalination has been its relatively high cost as compared to other available water sources. One method of reducing the operational cost for seawater desalination being proposed by LBWD is through a two-pass nanofiltration (NF) membrane process, which has the potential of lowering the overall energy required. In this configuration, permeate from the first pass is treated by the second pass membranes in order to produce potable water. This paper will present LBWD’s investigation into the behavior of these lowerpressure membranes during seawater desalination.
Background Seawater membrane desalination is both capital and energy intensive. In past years, research trends have focused on increasing membrane productivity and system recovery in order to minimize footprint and system capital cost. High productivity and system recovery is typically achieved by increasing the overall system pressure. However, given the favorable terms and the high electrical prices in today’s market, maximizing recovery may be misdirected. The following is a rudimentary cost analysis performed to assist LBWD better direct research approach. LBWD currently estimate the capital cost for desalination at five dollars ($5) per gallon capacity. The capital financing cost associated with building a desalination facility, assuming an interest rate of five percent (5%), ranges from $373 per acre-foot (AF) to $302 per AF depending on the term of the financing (Table 1). The operating energy cost associated with seawater desalination has been reported to vary from 11 to 16 kilowatt-hour per 1000 gallons of water produced (kW/kgal). Energy prices vary between five cents per kilowatt (kW) to ten cents per kW, where five cents is based on purchasing power directly from the power generator (“direct access”) rather than through the energy grid. However, the California Public Utilities Commission (PUC) has currently ruled that no new load can sign up for direct access. Thus, the industrial retail energy price will likely be near ten cents per kW in California. Using the aforementioned assumptions, if the energy required to desalination is at 16 kW/kgal (upper end of reported values), the unit production cost will be on the order of $543/AF (Table 2). Table 1. Range of capital debt financing cost in dollars per acre-foot for various terms at an interest rate of 5%. Term of Financing Interest Rate Debt Service/AF
20 years 5% ($373)
25 years 5% ($330)
30 years 5% ($302)
2005 © American Water Works Association - Membrane Tech. Conference (All Rights Reserved)
Table 2. Unit production cost in $/acre-foot for various power prices and energy requirements. The grayed areas represents regions where power prices are not likely for California. Power $/kW $0.04 $0.05 $0.06 $0.07 $0.08 $0.09 $0.10
10 $136 $170 $204 $238 $271 $305 $339
11 $149 $187 $224 $261 $299 $336 $373
12 $163 $204 $244 $285 $326 $366 $407
kW/1000gal 13 $176 $221 $265 $309 $353 $397 $441
14 $190 $238 $285 $333 $380 $428 $475
15 $204 $254 $305 $356 $407 $458 $509
16 $217 $271 $326 $380 $434 $489 $543
Anecdotal evidence suggest that a potential 20% energy saving may be achieved using the 2-pass NF approach. However, the capital consequence may be a 10% increase in cost. Using the above financial analysis, if a 10 MGD facility was being financed for 30 years at 5 percent interest and if the operating cost is 16 kW/kgal at $0.10/kW, annual debt service repayment would be $302/AF while the desalination energy alone would be $543/AF. At these financing terms, a 10% increase in capital would result in a $31/AF increase, where a 20% reduction in operating cost would result in a saving of $68/AF. Given that energy savings significantly exceeds the added debt financing cost, the focus of research at LBWD was directed towards reducing unit energy cost.
Literature Review NF membrane was primarily developed as a membrane-softening process, offering an alternative to chemical softening (1). NF is also effective in the removal of disinfection byproduct (DBP) precursors (2-4) and other synthetic organic chemicals (SOCs) (5). There are currently several full-scale NF plants worldwide that target the removal of hardness and/or DBP precursor removal from surface or groundwater supplies. Recently, the Saline Water Conversion Corporation in Saudi Arabia (SWCC, Saudi Arabia) evaluated the effectiveness of NF as a pretreatment to seawater reverse osmosis (SWRO) membranes (6-9). The main objectives for the NF pretreatment of SWRO feed were to: a) minimize particulate and microbial fouling of the SWRO membranes by removal of turbidity and bacteria b) prevent scaling by removal of the hardness ions, and c) lower the operational pressure of SWRO process by reducing the feedwater’s total dissolved solids (TDS) concentration Several publications presented by SWCC addressed various issues related to the application of NF pretreatment for SWRO. Early work was performed at a pilot facility (6-8) in which Persian Gulf seawater (TDS = 44,000 mg/L) was first pretreated through multimedia filters, cartridge filter, and NF membranes. The NF permeate was subsequently treated through the SWRO process, which produced potable water. The concentrate was further processed through a multistage flash (MSF) distillation unit. Various unspecified NF and SWRO membrane types were evaluated in the study.
2005 © American Water Works Association - Membrane Tech. Conference (All Rights Reserved)
Subsequently, SWCC converted one of two SWRO parallel trains (Umm Lujj SWRO plant, Saudi Arabia) from a single SWRO into a NF-SWRO train to evaluate the NF pretreatment (9). The second identical train was maintained as a single SWRO process to serve as the reference process, with each train having a capacity of 0.6 MGD. For the demonstration plant, the NF-SWRO train showed an increase in productivity of 42 percent and an increase in system recovery from 28 to 56 percent, as compared to the single SWRO train. Additionally, the energy consumption of the NF-SWRO train was 23 percent lower than the single SWRO train. Although NF membranes have been previously tested with seawater, the application focused on using NF as pretreatment for the reverse osmosis membrane stage rather than using these membranes to produce potable water. In recent years, however, significant developments of NF membranes have been made, resulting in products that can achieve high TDS rejections (≥ 90%) at lower applied pressures. These advances allow a two-step, permeate-staged NF treatment process capable of producing potable water with lower overall applied pressure, and potentially lowering operating energy. To date, this concept does not appear to have been tested, as evidenced by the lack of literature in this area.
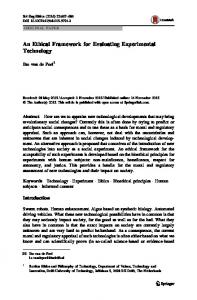
Materials and Methods A 9,000 gallons per day (approximate) pilot plant (pilot) was constructed to test the feasibility of NF membranes (Figure 1). The pilot consisted of two-750 gallon storage tanks, five-micrometers (5 µm) cartridge filters, two passes of NF membranes and a 250gallon, Pass 1 permeate tank, which feeds the Pass 2 NF membranes. The seawater is circulated through a 180,000 BTU chiller to maintain temperature throughout an experiment. The pilot is designed to operate in a continuous loop mode. To perform testing, approximately 1,500 gallons of Pacific Ocean seawater was delivered to the pilot site. The fresh Pacific Ocean seawater salinity was typically around 35,000 mg/L, and all cations and anions were consistent with literature. All permeate and brine flows were recycled during testing to minimize concentrating the feed water. To ensure steady state during testing, the pilot was operated for at least 3 hydraulic detention times prior to sample collection for every test. The only pretreatment provided was the 5-µm cartridge filters. No antiscalant or other chemicals were added during these tests. All water quality analyses were conducted in accordance with Standard Methods.
2005 © American Water Works Association - Membrane Tech. Conference (All Rights Reserved)
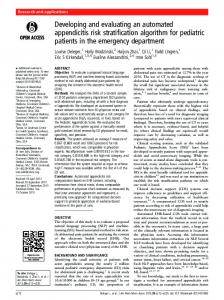
Figure 1. Photo of pilot plant used to test nanofiltration membranes for seawater desalination. Results and Discussion As stated in the literature review, NF membranes have traditionally been considered for softening and not desalination. However, the molecular weight cutoff for some NF membranes can overlap with reverse osmosis (RO) membranes because there is no standard definition for NF. Albeit the NF membranes may be “looser” than the RO membranes, these lower-pressure membranes can achieve the required salt rejection. In earlier research, lower-pressure membranes operated in a 2-pass array was able to achieve an estimated 13 kW/kgal unit energy (Figure 2). For that configuration, the permeate TDS was less than 100 mg/L. Additional power reduction may be achieved by slightly sacrificing permeate salinity. Unfortunately, because the use of lowerpressure membranes for seawater desalination is not well understood, there are no valid models presently available to help assist in optimization. Thus, to better understand how to optimize seawater desalination, various NF and ultra low pressure RO membranes (Table 3) were tested to evaluate how each membrane performs with respect to manufacturer’s performance specification and how permeate quality is impacted by various physical factors that affect performance (ie, vessel loading rate, temperature, pressure, etc.). The understanding of these factors will provide guidelines into optimization and full-scale design. The results of these testing are discussed below.
2005 © American Water Works Association - Membrane Tech. Conference (All Rights Reserved)
13.0
300
11.0
200
9.0
100
7.0
0
5.0 Array 9
400
Array 8
15.0
Array 7
500
Array 6
17.0
Array 5
600
Array 4
19.0
Array 3
700
Array 2
21.0 Theoretical Power (KW/1000 gallons)
50%ile Power
800
Array 1
TDS (mg/L)
50%ile TDS
Figure 2. Test results using lower-pressure membranes to desalinate seawater. Variation in membrane performance Membrane suppliers provide performance data for the various membranes supplied. However, because of the test conditions applied by each manufacturer may be different, agencies considering seawater desalination can not rely solely on manufacturer’s performance specification to determine applicability since NF membranes were not traditionally used to desalt seawater. Research was conducted on the ability of select lower-pressure membranes with similar performance specification to evaluate their permeate quality at various operating pressures. The results for the FilmTec NF90 membrane comparison against Saehan NE90 membrane are shown in Figure 3. From the performance specification sheet, both manufacturers used magnesium sulfate (MgSO4) for performance testing and rejection were 95% and 98.5% for the NF90 and NE90, respectively (Table 3). However, actual performance of these membranes differs greatly when application is seawater desalination. The results show that although the NE90 membranes had a higher MgSO4 rejection, total conductivity rejection was better with the NF90 membranes. This result illustrates the fact that actual performance may differ greatly compared to manufacturer’s performance specification and that membranes need to be tested individually based on application. However, it is important to point out that although the membranes performance differs greatly, the two pass array provided flexibility so that both membranes was able to achieve potable water quality.
2005 © American Water Works Association - Membrane Tech. Conference (All Rights Reserved)
Saehan NE90
FilmTec NF90
Permeate Conductivity (mS)
30 25 20 15 10 5 0 300
350
400
450
500
550
600
Feed Pressure (psi) Figure 3. Permeate quality at various operating pressures for NF90 and NE90 membranes. Testing for both membranes were conducted at 70oF and loaded at 1,500 gpd. Table 3. Lower-pressure membrane tested to evaluate behavior during seawater applications. General Information Area Product Manufacturer Model Mat'l 2 (ft ) Flow (gpd) FilmTec NF90 PA 80 1,850 Trisep TS80 PA 81 2,000 1 Trisep X20 PA 81 2,000 Saehan NE90 PA 85 1,900 2 Saehan NE90 V.2 PA 85 1 2
Manufacturer Test Condition Test P MgSO 4 NaCl mg/L Min. Rej. mg/L Min. Rej. (psi) 2,000 95.0% 70 2,000 97.0% 100 2,000 99.0% 100 2000 98.5% 75
Ultra low pressure RO membrane Custom NF membranes manufactured for this project. No standard data available.
Temperature affect It is well know that temperature will affect the salt diffusion rate as colder waters tend to “tighten” the membrane property and increase salt rejection. Testing was performed at various temperatures to evaluate magnitude of temperature affect (Figure 4). As expected, for the “loose” NF membranes, colder temperature can dramatically improve performance, while high temperatures can deteriorate salt rejection. Thus, the source water must be well characterized to help in determining anticipated potential operating needs and appropriately select the best membrane for the individual situation. For
2005 © American Water Works Association - Membrane Tech. Conference (All Rights Reserved)
example, if the source water is an open intake with large variability, it is important to incorporate sufficient operating flexibility to implement operational adjustments to continually meet water quality objectives. This result illustrate the need to understand both performance of the individual membranes in terms of salt passage as a function of temperature as well as knowing the range of expected temperature fluctuations in the source water. This will allow proper selection of membranes as well as allow development of operational tools to meet objectives.
18 gpm: 51F
18 gpm: 63F
18 gpm: 70F
23
Conductivity (mS)
22 21 20 19 18 17 16 15 14 13 380
430
480
530
580
Feed Pressure (psi) Figure 4. Affects of temperature on permeate conductivity at various pressures. Membranes were loaded at a rate of 18 gpm per vessel and each vessel housed 5 elements. Affects of pressure Membrane behavior with increasing pressures was evaluated to better understand how lower-pressure membranes perform in seawater desalination applications (Figure 5). The results show that a critical point can exist for these lower-pressure membranes and can be very pronounced as compared to SWRO membranes. As illustrated by the previous results, temperature can dramatically affect the “tightness” of the membrane. The critical point is more pronounced in warmer conditions. When the temperature is cold, NF membrane behave much like RO, where critical point is not reached and pressure can be continually applied. In conditions where a critical point exists (e.g., 70oF), permeate quality will continue to improve as pressure is applied and convention of water dominates. However, once the critical point is reached, the impact of diffusion
2005 © American Water Works Association - Membrane Tech. Conference (All Rights Reserved)
begins to dominate and water quality can deteriorate. Thus, the critical point should be viewed as the optimal point. This result illustrates that for each NF membrane, the critical point may exist, with temperature playing an important role. The critical point needs to be identified for each individual membrane, which will establish the optimal operating condition for Pass 1. Focus should then shift to optimizing Pass 2 to achieve the best quality at the lowest pressure.
16 gpm: 51F 23
Convection Dominate
22
Conductivity (mS)
16 gpm: 63F
16 gpm: 70F
Diffusion Dominate
21 20 Crittical Pt.
19 18
Convection Dominate
17 16 15 14 13 380
430
480
530
580
Feed Pressure (psi) Figure 5. Affects of pressure on permeate conductivity at various temperatures. Membranes were loaded at a rate of 18 gpm per vessel and each vessel housed 5 elements. Loading rate In the earlier section, a critical point was shown to exist for lower-pressure membranes. However, natural concern is whether the critical point is constant for all conditions. Loading rates were varied to see how the critical point was impacted. The results show that by increasing loading rate, the critical point shifts to the right, allowing higher pressures and consequently, achieving a better water quality (Figure 6). It is hypothesized that this shift in the critical point is attributed to the concentration polarization affect, where a thin layer of concentrated brine exist near the surface of the active layer. As the loading rate is increased, turbulence may disrupt and flush the concentrated brine and minimize salt diffusion. This result suggests that a higher loading rate should be employed to allow the process to reach higher pressures and better water quality. The impact of operating at a higher
2005 © American Water Works Association - Membrane Tech. Conference (All Rights Reserved)
loading rate is a marginal reduction in recovery (Figure 7). The reduction is likely offset by reduction in energy. However, a more detailed analysis is needed to better quantify the ideal loading rate.
16 gpm: 63F 18 gpm: 63F
16 gpm: 70F 18 gpm: 70F
23
Conductivity (mS)
22 21 20 19 18 17 16 380
430
480
530
580
Feed Pressure (psi) Figure 6. Affects of loading rates on critical point for two temperature conditions.
2005 © American Water Works Association - Membrane Tech. Conference (All Rights Reserved)
conductivity @ 16 gpm
Conductivity @ 18 gpm
Recovery @ 16 gpm
Recovery @ 18 gpm 70% 60%
20
50% 15
40%
10
30% 20%
5
10%
0
0% 400
420
440
461
482
500
520
539
Feed Pressure Figure 7. Affects of increasing loading rate on recovery.
2005 © American Water Works Association - Membrane Tech. Conference (All Rights Reserved)
Percent Recovery
Conductivity (mS)
25
Conclusions •
Due to differences in financing, improving operating power costs should be the primary focus for those agencies in California interested in seawater desalination.
•
Lower-pressure membranes may be employed for seawater desalination but individual membrane behavior needs to be quantified independently since manufacturer’s performance data may not provide an accurate picture of how the lower-pressure membranes will behave in seawater desalination applications.
•
Temperature can significantly change the “tightness” or “looseness” of the membrane and source water characterization is needed to better understand the best membrane for your need.
•
When using lower-pressure membranes for desalinating seawater, depending on the membrane “tightness” and water temperature, a critical point may develop. Optimization should be performed around the critical point, since that is the optimal point of applied pressure versus water quality.
•
A higher loading rate should be employed to allow the process to shift the critical point reach higher pressures and better water quality. A more detailed analysis is needed to better quantify the ideal loading rate.
•
The following is a potential membrane selection strategy: 1. 2. 3. 4. 5.
Identify the critical point for each perspective membrane at various temperatures. Determine the optimal loading rate for that membrane. Employ operating conditions determined from steps 1 and 2 for Pass 1. Optimize Pass 2 to achieve the desired water quality. Determine the net operating energy under overall optimized conditions, and compare to baseline conditions.
2005 © American Water Works Association - Membrane Tech. Conference (All Rights Reserved)
References 1. Conlon, W.J. and McClellan (1989), “Membrane Softening: A Treatment Process Comes of Age”, JAWWA, 81:11:47. 2. Fu, P., H. Ruiz, K. Thompson, C. Spangenberg(1994).”Selecting membranes for removing NOM and DBP precursors”, JAWWA, 86:12:55. 3. Allgeier, S., and S. Summers, “Evaluating NF for DBP control with RBSMT”, JAWWA, 87:3:87. 4. Chellam, S. J. Jacangelo, T. Bonacquisti, B Schauer (1997), “ Effect of pretreatment on surface water nanofiltration”, JAWWA, 89:10:77. 5. Duranceau, S.J., J.S. Taylor, L.A. Mulford (1992),”SOC Removal in a Membrane Softening Process”, JAWWA, 84:1:68. 6. Hassan, A.M., A.M. Farooque, A.T.M. Jamaluddin, A.S. Al-Amoudi, M.AK. Al-Sofi, A.F. Al-Rubaiain, N.M. Kither, I.A.R. Al-Tisan, A. Rowaili (1998), “A demonstration plant based on the new NF-SWRO process,” Proceedings of the Conference on Membranes in Drinking and Industrial Water Production, Vol 1, pp. 317 – 27. L’Aquila, Italy. 7. Hassan, A.M., A.M. Farooque, A.T.M. Jamaluddin, A.S. Al-Amodi, M.AK. Al-Sofi, A.F. Al-Rubaiain, M.M. Gurashi, N.M. Kither, A.G.I.Dalivi,I.A.R. Al-Tisan (1999), “Optimization of NF Pretreatment of Feed Water To SeaWater Desalination” Plants, Paper presented at the IDA World Congress on Desalination and Water Reuse in San Diego, California. 8. Farooque A.M., A.M.,Hassan, A.T.M. Jamaluddin, A.S. Al-Amodi, M.AK. Al-Sofi, A.F. Al-Rubaiain, M.M. Gurashi, A.G.I.Dalivi, N.M. Kither, ,I.A.R. Al-Tisan (1999), “Autopsy and Characterization of NF Membranes After Long Term Operation in an NF-SWRO Pilot Plant”, Paper presented at the IDA World Congress on Desalination and Water Reuse in San Diego, California. 9. Hassan, A.M., M.A. Alsofi, A.M. Al-Ajlan, A.A. Al-Azzaz, A.S. Al-Mohammadi (2002), “The New NF-SWRO Operation Increased Significantly UmmLujj SWRO Plant Output and Recovery”, Paper presented at the IDA World Congress on Desalination and Water Reuse in Manamah, Bahrian. 10. Standard Methods for the Examination of Water and Wastewater (1998). 20th Edition. American Public Health Association. Washington, D.C.
2005 © American Water Works Association - Membrane Tech. Conference (All Rights Reserved)