Journal of the Eastern Asia Society for Transportation Studies, Vol. 6, pp. 1708 - 1723, 2005
DEVELOPING THE SINGLY CONSTRAINED GRAVITY MODEL FOR APPLICATION IN DEVELOPING COUNTRIES Wahju HERIJANTO Lecturer Civil Engineering Department Institut Teknologi Sepuluh Nopember (ITS) Kampus ITS Sukolilo, Surabaya 60111, Indonesia. Fax: +62-315941490 E-mail:
[email protected] (also Postgraduate Research Student, School of Civil Engineering and Geosciences, University of Newcastle upon Tyne).
Neil THORPE Lecturer School of Civil Engineering & Geosciences University of Newcastle upon Tyne Cassie Building, Claremont Road Newcastle upon Tyne NE1 7RU, United Kingdom Fax: +44-1912226502 E-mail:
[email protected]
Abstract: This research aims to enhance the accuracy of the singly constrained gravity model by incorporating principles from fluid analogy theory. The method is based on an iterative process to generate and allocate trips in an origin-destination matrix and involves estimating the number of trips produced by and attracted to individual zones. The deterrence function and the attraction factor embedded within the model plays an important role in the relative attractiveness of each zone, while the fluid analogy method is used to allocate trips between zones. The method is applied to replicate the distribution of trip-lengths to work by motorcycle in the case-study city of Surabaya, Indonesia for a base year (1993) and for a horizon year (2003). The computed D-statistic and chi-square values indicate that the performance of the combined fluid-analogy and singly constrained gravity model output is better than the conventional singly constrained gravity model in this context Key Words: Trip distribution, gravity model, fluid analogy method.
1. INTRODUCTION 1.1 Background In transportation planning, it is of utmost importance to have an accurate model for forecasting the distribution of trips between origin and destination zones, as these trips are used as input into the process of assigning trips across the network. The gravity model is able to replicate interzonal trip distributions by considering the influence on trip generation and attraction of the spatial separation between zones. A deterrence function is used to represent the influence of this spatial separation, which is usually travel distance, time or out-of-pocket costs, to the probability of the occurrence of interzonal trips. The function represents the (usually negative) relationship between the number of trips attracted to a particular zone and the perceived generalised cost of travel between zones. Different specifications of gravity model can be categorized according to the level of constraints imposed – that is, either doubly constrained, singly constrained or unconstrained. The doubly constrained gravity model produces an estimated trip distribution matrix which, if summed horizontally and vertically, matches the observed zonal trip production and attraction. These models tend to have a high degree of the accuracy. The singly constrained gravity model also produces an estimated trip distribution matrix but only matches either the observed trip production (production constrained) or trip attraction (attraction constrained)
1708
Journal of the Eastern Asia Society for Transportation Studies, Vol. 6, pp. 1708 - 1723, 2005
rates. The unconstrained gravity model produces an estimated trip distribution matrix which only matches the total number of trips on the network. These models tend to have a relatively low degree of accuracy. Although the doubly constrained gravity model usually performs the best out of the three generic types described, implementing it in developing countries for forecasting future trip distributions is a complex and difficult process. The main problem encountered when trying to model trip distribution in developing countries is often the inadequacy of the input data, in particular the data used for the trip attraction forecasts. As the trip attraction forecast forms one of the key inputs to the doubly constrained gravity model, the inadequate data causes problems for the doubly constrained gravity model incapable to forecast the future trip distribution. Improving the quality and quantity of the data would require significant long-term government commitment and substantial investment which is often very difficult to achieve in developing countries due to limited resources and more urgent priorities. In contrast, the production constrained gravity model, which is a form of the singly constrained gravity model, does have the ability to forecast future travel patterns as the input data required is simply the output of the trip production process and thus overcomes the difficulty identified above. Despite this potential advantage, the poorer performance of this model compared to the doubly constrained model has meant that research into developing the singly constrained gravity model for application in developing countries has tended to be neglected in favour of developing the doubly constrained version. This research attempts to partly redress this imbalance by developing an improved singly constrained gravity model for application in developing countries where problems exist with the adequacy of trip attraction data. The case-study city selected is Surabaya in Indonesia. 1.2 Objectives The overall aim of this research is to develop a simplified singly constrained gravity model that incorporates a step-by-step fluid analogy approach to improve the accuracy of the model when applied in developing countries. To achieve this, the following detailed objectives have been set: 1. 2. 3. 4. 5. 6. 7.
to review critically the development of gravity models for forecasting urban passenger transport and their application particularly in developing countries; to review critically the fluid analogy method for modelling trip distribution;. to design, pilot and administer a data collection exercise to collect relevant information on passenger transport patterns in the case-study city of Surabaya, Indonesia; to build an improved trip distribution model based on the singly constrained gravity model that incorporates the fluid analogy method; to assess the relative performance of the new model compared to a conventional singly constrained model for replicating the base year and horizon year transport pattern in the case-study city; and also to assess the relative performance of the new model compared to a doubly constrained gravity model for the base year transport pattern; and to make recommendations for the implementation of gravity models in developing countries for forecasting future patterns of urban passenger transport.
1709
Journal of the Eastern Asia Society for Transportation Studies, Vol. 6, pp. 1708 - 1723, 2005
1.3 Limitations of the Research The focus in this research is restricted to trip distribution analyses of journey to work and journey to school during morning peak hours in the case-study city of Surabaya. Journeys to work and to school are the most dominant trips due to their high level of importance for basic household and family needs. These types of journeys are also strongly influenced by the spatial separation between origins and destination which the gravity model is capable of replicating. The morning peak period is selected since the significant environmental impacts generated by traffic is concentrated mostly during this period as the majority of schools and main centres of employment open daily between 0700-0800 hrs. This has the implication that most journeys interferes around 0700 hrs. The evening peak is not analysed here principally due to closing times for schools and employment centres being much more widely dispersed. In terms of the transferability of the results and findings, this model is being developed for the case-study city of Surabaya, Indonesia which has a population of approximately 2.5 million, a dominant transport mode in terms of motorcycling and poor public transport provision. Transferability of the results is therefore limited in the first instance to cities displaying similar to these and other socio-economic characteristics of which several may be identified in developing countries throughout south-east Asia. According to Dimitriou (1990) for example, registered motorcycles in Kuala Lumpur and Jakarta represent more than 60% of the total registered vehicle fleet while in Surabaya motorcycles constitute 75% of the total motorised fleet (Surabaya Statistic Office, 2001). Trips by motorcycle in Surabaya in 1993 represented almost 40% of total trips by motorised and non-motorised modes, while in Bangkok and Jakarta, the motorcycle modal share increased from 15% and 29% in 1980 to 81% and 62% respectively in 1982 (Dimitriou, 1990). The dominance of poor public paratransit modes is also very noticeable in Manila, Jakarta, Karachi, Lagos, Khartoum and Bandung, as well as in Surabaya (Dimitriou, 1990).
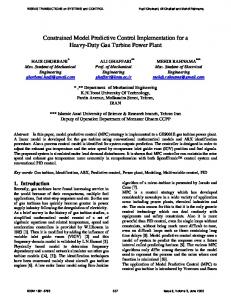
2. GRAVITY MODEL THEORY 2.1 The Role of Trip Distribution in Transport Modelling The most commonly used approach in transport modelling is the four stage sequential transport model. The four stages are Trip Generation (TG), Trip Distribution (TD), Modal Split (MS) and Trip Assignment (TA). To implement this approach, the study area is divided up into a number of zones. The literature suggests four generic approaches to implementing the sequential analysis (Black, 1981; Tamin, 2000) as shown in Figure 1. The choice of which approach is appropriate for any particular application depends on a range of circumstances. For example, in developed countries, where public transport provision is usually better in terms of frequency and reliability, many car owners chose to use public transport. Therefore, it is necessary to analyse modal split using either a diversion curve or a modal split formula. For this reason, the Type I and Type III approaches are more appropriate as they assume that modal split is influenced by spatial characteristics (Black, 1981; Tamin, 2000; Ortuzar and Willumsen, 2001). In contrast in developing countries, where public transport is less well provided for, it is reasonable to expect that the majority of car and motorcycle owners will not use public
1710
Journal of the Eastern Asia Society for Transportation Studies, Vol. 6, pp. 1708 - 1723, 2005
transport (Dimitriou, 1990). Therefore, either the Type IV approach which combines trip generation and modal split, or Type II which uses diversion curves based on zonal characteristics, are considered more realistic. These two approaches are appropriate as they both assume that zonal characteristics (e.g. income, vehicle ownership, family size) influence modal split more than spatial characteristics (e.g. distance, travel time and travel cost). TG
TG
TD
MS
TG
TG/MS
TD/MS
TD
MS
TD
TA
TA
TA
TA
Type I
Type II
Type III
Type IV
Figure 1: Different Approaches to Implementing the Four Stage Sequential Model. (Source: Black, 1981)
2.2 Computation and Estimation Methods for Gravity Models Several methods exist for computing and estimating gravity models and the choice of which to use depends largely upon the availability of relevant data. The unconstrained (or total flow constrained) gravity model uses a relatively simple computation method for estimating interzonal flow. This method is used if the trip generation process is difficult due to incomplete trip production and attraction data. Estimation of the calibration parameter based on total flow can be achieved without having to match trip production and attraction rates (Jones, 1977; Taaffe, 1996). This requires adding a parameter k to the gravity model formula to ensure that the sum of modelled interzonal flow of is equal to the observed total. Production constrained gravity models require more complex computational techniques to match the estimated and observed trip production rates for each zone. This is usually possible where the estimates of trip production are more complete due to the availability of relevant data, such as from home interview surveys. In cases where more data is available to support trip attraction than trip production, the attraction constrained gravity model should be adopted (Jones, 1977; Oppenheim, 1995; Taaffe, 1996). As noted above, the production constrained gravity model attempts to match estimated and actual trip production rates with estimated and actual trip attraction rates not necessarily being equal (Jones, 1977; Tamin, 2000; Taaffe et al., 1996; Torrens, 2000; BPR, 1965; Black, 1981). The production constrained gravity model is more appropriate for trip distribution analysis where the trip production analysis is very detailed and accurate, as well as supported by sufficient relevant data compared to the trip attraction process. For example, combining trip production data from home interview surveys with population data provides a strong basis for trip production analysis. Taaffe et al (1996) argue that if the strong trip production analysis
1711
Journal of the Eastern Asia Society for Transportation Studies, Vol. 6, pp. 1708 - 1723, 2005
combined with poor information of regarding the trip attraction variables, such as the data of employment, visitors, customers and school capacity, the production constrained gravity model is the appropriate model to use for trip distribution analysis. Equation 1 shows the formula for this type of singly constrained gravity model: Tij = OiAiWjf(Cij) Ai = [∑j {Wjf(Cij)}]-1
{Equation 1}
Where: Tij = interzonal trips from zone i to zone j Oi = trips produced from zone i Wj = attraction factor for zone j (see Jones, 1977; Taaffe et al., 1996; Torrens, 2000); and Ai = a balancing factor to ensure ∑jTij = Oi In cases where a relatively comprehensive observational survey has been undertaken that includes the main attraction centres (such as the city centre, industrial, office and school locations), the accuracy of the model estimates is usually lower than those produced by the doubly constrained gravity model. The doubly constrained gravity model estimates both zonal trip production and attraction that tend to be close the observed values. If data to support both trip production and attraction estimates are available, the doubly constrained gravity model is considered widely to be the most appropriate as the model matches estimated and actual zonal trip production and attraction values (see for example Stopher and Meyburg, 1975; Ortuzar and Willumsen, 2001). The doubly constrained model is the most developed of the gravity model family. The model ensures that estimated values for trip production and attraction are equal to the observed values. However, serious difficulties often arise during the trip forecasting stage when applying the model in developing countries due to the lack of good quality data. The model compares favourably with the singly constrained model in terms of accuracy, but is less attractive in developing countries due to this requirement for more comprehensive input data. To use the model to forecast future trip distribution patterns requires forecasts of trip production and trip attraction to the horizon year using relevant data. The advantages of the doubly constrained gravity model are therefore greatly reduced if one (or both) of these inputs is difficult to forecast. 2.3 The Availability of Data in Developing Countries As discussed, population data is usually available for developing countries and easy to forecast as annual updates are normally available. This makes the trip production process relatively straightforward as this is usually a function of population characteristics. However, this is not the case for the trip attraction process in developing countries as the required input data is not always available or, if it is, it is often out-of-date. Statistical performance indicators suggest that the trip attraction model is usually not as good as the trip production model (Herijanto, 1995). Often the result is satisfied for the base year, however it can not be used as forecasting tool since the data needed for supporting trip attraction analysis (e.g.: land-use area, employment) is rarely updated (Surabaya Statistics Office, 1990). As this tends to increase the difficulty of the trip attraction forecasting process, it is often not worthwhile to use the forecast trip attraction values as a constraint. It is also important to mention that trip
1712
Journal of the Eastern Asia Society for Transportation Studies, Vol. 6, pp. 1708 - 1723, 2005
attraction data from home interview surveys are often insufficiently accurate for input into the doubly constrained gravity model. Generally, surveys conducted in activity centres yield more appropriate data. The implication of these various issues is that the forecast number of total trips produced by summing all individual zonal trip generation forecasts (which is normally quite accurate) may often be very different from the forecast of total trips derived from the trip attraction estimates. The calibration of the gravity model is only successful if the total number of trips produced is equal to the total number of trips attracted by all zones (see Figure 2). 1
2
3
4
n
forecasted Oi
1
O1
2
O2
3
O3
Tij=Ai Oi Bj Dj f (Cij)
4
O4
n
On
forecasted Dj
D1
D2
D3
D4
T
Dn
Figure 2: The doubly constrained gravity model scheme Source: after Ortuzar and Willumsen (2001) The cell matrix Tij is completed using the forecast Oi and Dj values. The total sum of trips (T) in the network is then equal to the total sum of trips generated from all zones. As the trip attraction forecasts are often inaccurate due to the acknowledged problems with input data, the values of Dj are then amended to new values Dj1 (which should then sum to equal to T) using Equation 2. The original value of Dj is used as a ratio: Dj1 = T. Dj / (∑ Dj)
(Equation 2).
If the supporting data required for the trip attraction computations are comprehensive, as is often the case in developed countries, the value of Dj tends to be much closer to Dj1. This is less likely in developing countries where continuous annually-updated data are rare and thus makes constraining the estimated trip attraction values inappropriate.
1713
Journal of the Eastern Asia Society for Transportation Studies, Vol. 6, pp. 1708 - 1723, 2005
3. TSYGALNITZKY’S FLUID ANALOGY METHOD 3.1 Tsygalnitzky’s fluid analogy method for linear conditions Tsygalnitzky (1977) developed a method for estimating trip distribution matrices along public transport routes using boarding and alighting data as inputs. This method is known as Tsygalnitzky’s fluid analogy method (Simon & Furth, 1985). The main assumption underpinning this method is that every passenger has an equal probability to alight at a given stop if his/her boarding stop was at least a certain minimum distance before the alighting given stop. The fluid analogy method considers the bus as a container travelling along a route, with passengers treated as fluid which is added to the container at each boarding point, mixed between stops and then poured out of the container at each alighting point. The computation is as follows: In a bus route, i is a boarding stop, j is an alighting stop and j is always greater than i. First, assuming the vij = eij = 0 for j = i (where vij is the volume of passengers travelling from stop i to stop j and eij is the volume of passengers who board at i that are eligible to alight at j. For j – i = 1, vij = eij. The computation proceeds from alighting stop j=i+1 to j=n. At stop j, passengers who are eligible to alight are ej, while the observed passengers actually alighting are vj. The fraction fj = vj / ej gives the total passengers eligible to alight actually alighting at stop j. This fraction is then applied to each boarding stop i for which there are eligible passengers to alight, i.e. vij = fj eij for all i < j. Before proceeding to the next alighting stop j = j+1, the number of eligible passengers to alight is reduced by eij+1 = eij – vij. 3.2 Characteristics of the fluid analogy method Simon and Furth (1985) report that the accuracy of this approach has been proven statistically for linear routes and for linear routes containing some branching using data from the Southern California Rapid Transit district (SCRTD). The method is found to work particularly well for simple routes. The performance of the fluid analogy model and doubly constrained gravity model have been compared using data from an intercity coach route in Indonesia, using ticket data made available by the operating company (Herijanto, 2001). Comparisons of the replicated trip length distributions for the base year suggest that the fluid analogy model is more accurate than the distributions generated by the doubly constrained gravity model. However, the major limitation of the fluid analogy method is that it can only be used to produce trip distribution estimates for linear routes (as opposed to complex non-linear citywide networks).
4. THE COMBINED FLUID ANALOGY AND SINGLY CONSTRAINED GRAVITY MODEL 4.1 Strengths and weaknesses of the singly constrained gravity model Problems in developing countries with the quality and quantity of input data, especially socioeconomic data, affect the accuracy of trip attraction forecasts. Therefore, it is often not worthwhile generating trip distribution forecasts using the doubly constrained gravity model since it relies upon these forecasts as input. In this case, a singly constrained gravity model
1714
Journal of the Eastern Asia Society for Transportation Studies, Vol. 6, pp. 1708 - 1723, 2005
which uses trip production estimates as the only constraint should be a much more powerful forecasting tool. The model contains variables other than the output of the trip attraction process – for example these variables can relate to socio-economic and land-use characteristics. The main weakness of the singly constrained gravity model compared to the doubly constrained model is the accuracy of the base year validation due to the level of constraints being limited to trip production data. 4.2 The combined fluid analogy and singly constrained gravity model algorithm In this approach, the method used to allocate trips from a trip production zone to an attraction zone is based on fluid analogy principles. However, since the origin-destination matrix represents a complex pattern of movement across the city, it is not possible to use the conventional fluid analogy approach which uses a sequential ordering technique only for linear routes. To overcome this limitation, a novel approach of combining trip attraction variables and the influence of zonal spatial separation has been developed here by the authors to allocate trips to the most probable attraction zone. The method works as an iterative process. In each stage, instead of using the trip attraction model, a fraction of the trips generated by each zone is allocated between attraction zones proportional to the attraction factor of each zone to avoid difficulties in forecasting. Therefore, it is a combined fluid analogy and singly constrained gravity model. The algorithm of the process is as follows (see also Figure 3): • in each iteration, the fraction of trips generated by each zone is allocated to an active attraction zone (see below); • the approach treats the partial O-D trip matrix as a fluid flowing through a network of pipes from a production zone (that acts as a pressure pump) to an active attraction zone (that acts as a suction pump); • in each iteration, only one production zone is activated (i.e. releasing trips) and a partial O-D matrix is distributed to the active attraction zones; • in each iteration only one attraction zone is activated which is determined by the zone with the minimum travel time and the highest trip attraction factors, subject to the capacity of the attraction zone; • when the capacity of an attraction zone has been reached, the attraction zone with the ‘second best’ travel time function and attraction factors is activated; • the capacity of the attraction zone is proportional to the attraction factor; • this is then repeated for each production zone in successive iterations until the partial O-D matrix for the final zone has been allocated; • the process then returns to the first zone and allocates the second fraction of the total O-D matrix; • the process continues until all trips produced from all production zones have been allocated; and • the capacity of the attraction zone is proportional to the attraction factor.
1715
Journal of the Eastern Asia Society for Transportation Studies, Vol. 6, pp. 1708 - 1723, 2005
Input: Travel time cij, O-D matrix nij attraction factor Wj Trip production Oi = Σj Tij Attraction capacity Capj = Wj /Σj Wj*Σi Oi m=0; k=1; i=1; j=1;Dj = 0; Activator max, Actmaxi =0 travel time average from data c0 = Σcij nij / Σnij β 0 = 1 / c0 m=m+1 Generating X fraction of trip production Pi = Oi / X Activating production zone (from i=1 to z) Examining attraction zone (from j=1 to z) Calculate activator value, actij =Wj Exp(-βcij)
k=k+1 i=i+1
Actij > Actmaxi and Attraction Aj < Capj j=j+1 Ti,j,k = Pi q=0 Ti,j-q-1,k = 0 Actmaxi = Actij
Ti,j,k = 0 q = q+1
Trip attraction j, Dj =Σ Wj Exp(-βcij) j=z i=z k=x Tij = 0; k=0; i=0; j=0
βm = cm*βm-1 / cm
Ti,j = Ti,j + Tijk j=j+1 j=z
i=i+1
k=k+1
j=z k=x travel time average from model, cm= Σcij Tij / ΣTij Relative difference, rd = (cm – c0) / c0 rd < E Output: O-D matrix and Trip length distribution
Figure 3: Flow chart of combined fluid analogy and singly constrained gravity model
1716
Journal of the Eastern Asia Society for Transportation Studies, Vol. 6, pp. 1708 - 1723, 2005
5. DATA COLLECTION 5.1 Survey methods There are several survey methods for gathering household travel pattern information. For example, Sapsford and Jupp (1996) mention home interview surveys, telephone interviews and postal questionnaires. Jones (1978) used a technique called the Household ActivityTravel Simulator (HATS) involving travel diaries to investigate the processes, outcomes and wider repercussions of everyday household decisions. Ampt et al (1992) provide an excellent review of the main approaches available for collecting data on household travel patterns. In Indonesia, and especially in Surabaya, the choice of which survey approach to adopt is determined by a number of factors. For example, there are few households with access to a telephone in the ‘kampongs’ area (slum areas) that are inhabited by the lower socio-economic classes. Thus there would be a bias against the representation of these groups in the data collection exercise. One consequence of this would be a lack of information on public transport and motorcycle usage. The general level of education throughout the population is relatively low meaning that the survey must be simple to complete and comprehensible which often requires the presence of a trained interviewer to provide (unbiased) explanation as necessary. For this reason, postal surveys are generally inappropriate in these circumstances. Cultural conditions in Indonesia usually mean an ‘open house’ environment applies for guests that are friendly and have good reason. In this situation, home interview surveys are highly appropriate which is quite the opposite of various other cultures in the world (Vougioukas et al, 1992)! Interview costs are also important to consider. The cost of a postal questionnaire in Indonesia is very cheap (at approximately Rp 4,000.00 for each address) but response rates are generally poor. Telephone calls are also relatively cheap (at Rp 150,- per minute) meaning that a one hour questionnaire would cost approximately Rp 12,000.00-, including the interviewer’s payment. Home interviews are the most expensive approach but the one likely to yield the highest quality data. A household interview of one hour is estimated to cost approximately Rp 15,000.00 per household and includes interviewer fees and transport cost. The resources available for this study meant that a household face-to-face interview approach was feasible which was encouraging in terms of collecting high quality data from our respondents. The household interview survey gathered data for a two day period (i.e. the interview day and the previous day) with the depth of the questioning being similar to the travel diary method used in the HATS method (Jones, 1978). Pilot and main interviews were conducted during JulyAugust 2003. (N.b. The 1993 base year data were also collected by household face-to-face interview by the Government of Surabaya.) Data collected include details of (return) journeys to work, school, for shopping and background socio-economic characteristics of the household being interviewed. 5.2 Sampling Strategy Disaggregate data is readily available for the 28 kecamatan districts of Surabaya. (N.b. only 19 kecamatan existed in the base year 1993 which forms the basis of the model.) As one of the purposes of the home interview survey is to gather origin-destination data, a stratified sample of households was drawn from the districts in proportion to their population with individual households then being selected at random until the quota for that district was achieved (Czaja and Blair, 1996).
1717
Journal of the Eastern Asia Society for Transportation Studies, Vol. 6, pp. 1708 - 1723, 2005
Sample sizes for home interviews vary from one study to another. For example, Jou (2000) recruited 297 households generating a total of 925 questionnaires in the Taichung metropolitan area in Taiwan. In contrast, a survey conducted by the Hong Kong Government in 1992 interviewed 31,000 households (Tong and Wong, 1997). Larger sample sizes obviously increase the level of confidence in the results but must be weighed up against the extra resources required to gather the information. In this study, the sample size for the 2003 horizon year was 300 households representing interviews with 1421 household members. In comparison, the 1993 database originated from interviews to the 2556 households representing 12320 household members. 5.3 Administration of the Main Household Survey The household survey was conducted to gather the relevant travel pattern information required for the project including origin-destination data, travel times, trip purpose and mode choice. The survey focused on Monday-Friday to meet the research objectives of focussing on work-trips only. Surveys were conducted on Wednesdays and Thursdays to cover travel undertaken between Tuesday and Thursday of the survey week In Indonesia, Mondays are not typical working days as many workers are travelling back in the city from homes in other regions. Fridays are also atypical due to religious commitments during the daytime. School holiday periods were also avoided. Three groups may be identified in the sample – those households owning a car(s), household owning a motorcycle(s) and households owning neither of these modes. Household data included the socio-economic and travel data necessary to estimate a trip distribution model. Household data included household size, vehicle ownership, basic expenditure, gross monthly personal income and employment details. Travel information included origins and destinations, travel times and times of travel, modes and trip purpose.
6. MODEL ESTIMATION 6.1 The calibration The combined fluid analogy and singly constrained gravity model has been calibrated for the 19 sub-districts in the base year using the data collected in Surabaya as described above. The data relates to journeys to work by motorcycle during morning peak hours. The data inputs are: • • •
the surveyed O-D matrix nij; the O-D travel time matrix cij; and a trip attraction factor Wj for each zone based on the amount of trading and industrial activity measured in hectares.
If the total number of trips generated from a zone is used as one of the inputs to the model, the total number of trips attracted by destination zones is not included in the model. Instead, trips are distributed between the trip attraction zones in proportion to the trip attraction factor. An exponential deterrence function is used as suggested be Wells (1975) for urban scenarios, and
1718
Journal of the Eastern Asia Society for Transportation Studies, Vol. 6, pp. 1708 - 1723, 2005
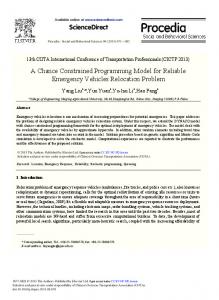
the calibration process produced a value of 0.0092 for the exponential parameter (β). 6.2 Statistical test of the validation A range of statistical techniques are available for measuring the accuracy of the results of the trip distribution models. Here, we use two measures for the trip length distribution – the Kolmogorov-Smirnov test and the chi-square test (Black and Salter, 1975). Using these statistics, the performance of the combined fluid analogy and singly constrained gravity model at reproducing observed base year O-D pattern is compared with that of conventional doubly and singly constrained gravity model. For the horizon year, the performance is measured only against the conventional singly constrained gravity model due to weaknesses in the trip attraction element of the doubly constrained model (Section 2.3). 6.3 Validation of the trip length distribution for the base year (1993) The output of the model is an O-D trip matrix that can be disaggregated by travel time to estimate the distribution of trip lengths based on travel time. The trip length distributions for journeys to work by motorcycle are shown in Figure 4. 60.00 Percentage of trips.
50.00 40.00 30.00 20.00 10.00 0.00
5
15
25
35
45
55
65
75
85
data
0.00 11.02 51.3130.56 6.11 0.71 0.28 0.00 0.00
doubly constrained
0.00 16.36 42.5333.07 7.54 0.43 0.07 0.00 0.00
conventional singly constrained model
0.00 18.49 40.1830.94 9.96 0.36 0.07 0.00 0.00
combined fluid analogy 0.00 18.12 45.4929.07 7.11 0.14 0.07 0.00 0.00 and singly constrained model Mean of travel time range (minutes)
Figure 4: Trip length distributions of journey to work by motorcycle, morning peak hours (Base year: 1993) Figure 4 suggests that the combined fluid analogy and singly constrained gravity model performs better than the conventional singly constrained gravity model for reproducing the base year trip length distribution. However, the doubly constrained gravity model still performs better than both types of the singly constrained approach. Comparison using chisquare goodness test and Kolmogorov-Smirnov (K-S) test shows their performances. In this case, the chi-square statistic of the combined fluid analogy and singly constrained gravity model is 0.067 which compares favourably with a corresponding value of 0.086 estimated for
1719
Journal of the Eastern Asia Society for Transportation Studies, Vol. 6, pp. 1708 - 1723, 2005
the conventional singly constrained gravity model, but less favourably with the doubly constrained gravity model (0.048). A similar pattern is revealed by the K-S Test with D values for the three models of 0.071, 0.075 and 0.053 respectively. 6.4 Forecasting horizon year trips In order to evaluate performance as a forecasting tool, the models are next used to calculate the O-D matrices for the horizon year (2003). Both the conventional singly constrained model and the combined fluid analogy and singly constrained gravity model require the forecasts of trip production as input. In contrast, the doubly constrained gravity model requires forecasts of both trip production and trip attraction for each zone. The trends and formulae for the trip production and trip attraction models are shown in Figures 5 and 6 respectively. The spread of data and coefficient of determination (0.75) in Figure 5 suggest that the trip production model is reliable. However, the coefficient of determination in Figure 6 (0.15) argues against using the trip attraction model as a forecasting tool. Unlike the population data (the independent variable for the trip production model), land-use data is generally not available which aggravates the situation. As forecasting using the doubly constrained gravity model requires the output from the trip attraction model as input, the reliability of the doubly constrained gravity model is adversely affected. For this reason, the performance of the combined fluid analogy and singly constrained gravity model is compared here only to the performance of singly constrained gravity model. This is described in the next section.
Trip production
200 150
y = 0.0006x + 1.3482
100
R = 0.7485
2
50 0 0
50000
100000 150000 200000 250000 Total population
Figure 5: Trip production model of journey to work by motorcycle (using base year data: 1993)
1720
Trip attraction.
Journal of the Eastern Asia Society for Transportation Studies, Vol. 6, pp. 1708 - 1723, 2005
160 140 120 100 80 60 40 20 0
y = 0.1141x + 58.128 2
R = 0.1492
0
100
200
300
400
500
Trading-industrial area (ha)
Figure 6: Trip attraction model of journey to work by motorcycle (using base year data: 1993) 6.5 Validation of trip length distribution in the horizon year (1993) The trip length distribution data from the 2003 household interview survey is used as the base for evaluating the performance of the combined fluid analogy and singly constrained gravity model for forecasting purposes with the conventional singly constrained model (see Figure 7). 50.00 Percentage of trips.
40.00 30.00 20.00 10.00 0.00
5
15
25
35
45
55
65
75
85
data
40.69 8.97 11.72 15.86 12.41 2.07 4.83 3.45 0.00
conventional singly constrained model
10.63 19.86 26.92 22.58 5.33 5.00 4.87 3.88 0.92
combined fluid analogy 22.96 19.39 23.49 18.66 7.81 4.63 1.92 0.86 0.26 and singly constrained model Mean of travel time ranges (minutes)
Figure 7: Trip length distribution of journey to work by motorcycle, morning peak hours (Forecasted to the horizon year: 2003) Figure 7 shows that for the horizon year, the trip length distribution produced by the combined of fluid analogy and singly constrained gravity model is still more accurate than the
1721
Journal of the Eastern Asia Society for Transportation Studies, Vol. 6, pp. 1708 - 1723, 2005
conventional singly constrained gravity model. The new inputs for the trip distribution forecast are as follows: • the output of the trip production forecast for 2003; and • the observed travel times. The estimated chi-square value of the combined fluid analogy and singly constrained gravity model is 0.42 compared to 1.13 for the singly constrained gravity model. The calculated D values are 0.18 and 0.30 respectively.
7. CONCLUSIONS The results indicate that combined fluid analogy and singly constrained gravity model produces improved trip length distribution outputs compared to the conventional singly constrained gravity model for journeys to work by motorcycle in Surabaya city, as measured by the Kolmogorov-Smirnov and chi-square tests ( Section 6.3 and 6.5). Although the doubly constrained gravity model produces even better results, the limited quality and quantity of data in developing countries available for trip attraction model make this approach inappropriate. Thus, the combined fluid analogy and singly constrained gravity model has greater potential to give better results in forecasting to horizon year as shown here. The application of the model to analyse journeys to work by motorcycle in Surabaya, Indonesia suggest that the combined fluid analogy and singly constrained gravity model produces more accurate replications of base and horizon year trip length distributions than the conventional singly constrained gravity model Thus, we conclude that the combined fluid analogy and singly constrained gravity model has considerable potential for application in developing countries where there is concern over the quality and quantity of trip attraction data.
REFERENCES Amt, E.S., Richardson, A.J., Meyburg, A.H. (1992) Selected Reading in Transport Survey Methodology. Eucalyptus Press, Melbourne. Ang, A.H.S.and Tang, W.H. (1975) Probability Concepts in Engineering Planning and Design, Volume I, John Willey & Sons. Black, J.A. (1981) Urban Transport Planning: Theory and Practice, Cromm Helm, London. Black, J.A. and Salter, R.J. (1975) A statistical evaluation of the accuracy of a family of gravity models. Proceedings of the Institution of Civil Engineers, London. BPR. (1965) US Bureau of Public Roads, Calibrating and Testing a Gravity Model for any Sized Urban Area. Washington,DC: Bureau of Public Roads. Dimitriou, H.T.(1990) Transport Planning for Third World Cities, Routledge, London and New York.
1722
Journal of the Eastern Asia Society for Transportation Studies, Vol. 6, pp. 1708 - 1723, 2005
Edward,Jr.,J.D. (1992) Transportation Planning Handbook. Institute of Transportation Engineers. Prentice Hall, New Jersey. Herijanto, W. (1995) Captive Public Transport Passenger Demand Modelling in Surabaya Municipality, Master Thesis, Institut Teknologi Bandung, Bandung (in Indonesian). Herijanto, W. (2001) Modelling passenger trip distribution along intercity bus route using fluid analogy method for case study Surabaya – Jember route. Proceeding of FSTPT, Denpasar-Bali (in Indonesian). Jones, I.S. (1977) Urban Transport Appraisal, The MacMillian Press Ltd, London. Jones, P.M. (1979) ‘HATS’: a technique for investigating household decisions. Environment and Planning A, 11, 59-70. Oppenheim, N. (1995) Urban Travel Demand Modelling: from Individual Choices to General Equilibrium, John Willey & Sons. Ortuzar, J.D. and Willumsen, L.G. (2001) Modelling Transport, Second Edition, John Willey & Sons. Sapsford,R. and Jupp, V. (1996) Data Collection and Analysis. Sage Publication Ltd. New Delhi. Simon, J. and Furth, P.G.. (1985) Generating O-D matrix from on-off data, Journal of Transportation Engineering 111(6), 583-593. Stopher, P.R. and Meyburg, A.H. (1975) Urban Transportation Modeling and Planning, Lexington Books, Toronto and London. Surabaya Statistics Office (1990-2001) Surabaya in figure (in Indonesian), Surabaya. Taaffe, E.J., Gauthier, H.L., O’Kelly, M.E. (1996) Geography of Transportation, Second Edition, Prentice Hall, New Jersey. Tamin, O.Z. (2000): Transportation Planning and Modelling, 2nd edition, Penerbit ITB, Bandung (in Indonesian). Tong, C.O. and Wong, C. (1997) The advantages of a high density, mixed land use, linear urban development, Transportation (24) 295-307. Kluwer Academic Publisher, The Netherlands. Torrens, P.M. (2000) How land-use Transportation Models Work, Working Paper Series, Centre for Advance Spatial Analysis, University College London, London. Tsygalnitzky, S.A. (1977) Simplified Methods in Transportation Analysis. M.I.T. Theses. http://theses.mit.edu/Dienst/UI/2.0/Describe/0018.mit.theses/1977-89. Vougioukas, E.M., Harajli, A.H. and Timberlake, R.S. (1992) Appropriate traffic modelling techniques for developing cities: the case of the Oman capital area. In Ortuzar, J.D. (eds) Simplified Transport Demand Modelling, PTRC Education and Research Ltd. London. Wells, G.R. (1975) Comprehensive Transport Planning, Charles Griffin & Company Ltd, High Wycombe.
1723