R
Iranian Journal of Pharmaceutical Sciences Summer 2007: 3(3): 161-170 www.ijps.ir
Original Article
Development and Application of a Validated Liquid Chromatography-Mass Spectrometry Method for the Determination of Dexchlorpheniramine Maleate in Human Plasma Aravindaraj Joghee Rajua,*, Gopinath Rama, Rajan Sekara, Mahesh Kumar Siddaiahb, Nanjan Moola Jogheeb, Suresh Bhojrajc JSS College of Pharmacy,bTIFAC CORE, JSS College of Pharmacy, cPrincipal, JSS College of Pharmacy, Rock lands, Ootacamund, India
D
aCADRAT,
ive
of
SI
Abstract A convenient liquid chromatographic-single Quadrupole mass spectrometric (LC-MS) method was developed and validated for dexchlorpheniramine maleate (INN name: chlorphenamine) determination in human plasma. The need for just a single liquid-liquid extraction with ethyl acetate and being highly sensitive were the advantages of this method. The linearity was also excellent over the range of 1 to 150 ng.ml-1 of dexchlorpheniramine maleate concentration. The method was statistically validated for its selectivity, linearity, precision and robustness. This method was successfully applied to the analysis of chlorpheniramine maleate in clinical studies.
ch
Keywords: Bioequivalence; Dexchlorpheniramine maleate; LC-MS. Received: February 5, 2007; Accepted: April 11, 2007.
Ar
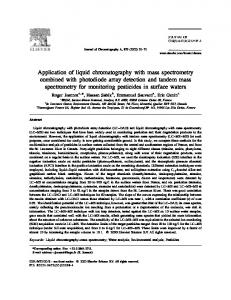
1. Introduction Chlorpheniramine maleate (RS-CPM) (3(4-chlorophenyl)-N,N-dimethyl-3-(2-pyridyl) propylamine monomaleate) (Figure 1) is a highly potent and widely used antihistaminic drug. It has been widely used for symptomatic relief of common colds and allergic diseases. Its activity is predominantly attributed to the dextrorotary S-enantiomer [1]. The European Pharmacopoeia III describes an HPLC method for the determination of the enantiomeric purity of dexchlorpheniramine maleate (S*Corresponding author: Aravindaraj joghee Raju, Senior Research Associate, CADRAT, JSS College of Pharmacy, Rocklands, Ootacamund - 643 001, India. Tel (+91)423-2447135; Fax (+91)423-2447135 Email:
[email protected]
CPM), allowing the presence of 2% (m/m) of R-enantiomer in the tested sample. Pharmacokinetic studies have revealed that plasma chlorpheniramine concentrations in humans are low, for example, the maximum levels of 6.2 and 7.0-8.2 ng/ml after a single oral administration of 2 and 4 mg [2]; and 5.8-11.3 and 3.9 ng/ml after a 4 and 2.67 mg administration, respectively. Some devised methods have been reported to determine human plasma RS-chlorpheniramine by using gas chromatography (GC), gas chromatography-mass spectrometry (GC-MS) and high-performance liquid chromatography (HPLC) [3-9]. This paper describes development and
www.SID.ir
AJ Raju et al./ IJPS Summer 2007; 3(3): 161-170
validation of a simple, specific, rapid and sensitive liquid chromatography-mass spectrometry (LC-MS) method for the determination of S-CPM in human plasma with a limit of quantification (LOQ) of 1.0 ng/ml for S-CPM during a 5.0 min. run time, using simvastatin (STA) (Figure 1) as an internal standard. In addition, this method was applied to S-CPM quantification of a single dose administration of tablets containing 6 mg of S-CPM in a crossover bioequivalency study of S-CPM in healthy male human subjects.
SI
D
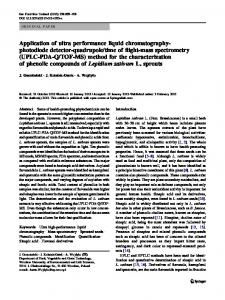
2.2. Calibration curves The stock solutions of S-CPM and internal standard were prepared in acetonitrile at free base concentration of 1000 μg.ml -1 . Secondary and working standard solutions were prepared from stock solutions by dilution by water:acetonitrile (50:50, v/v). These diluted working standard solutions were used to prepare the calibration curve and quality control samples. Blank human plasma was screened prior to spiking to ensure it was free from endogenous interference at retention times of S-CPM and internal standard of SCPM (Figure 2). An eight point standard curve of S-CPM was prepared by spiking the blank plasma with appropriate amount of SCPM. The calibration curve ranged from 1.0 to 150.0 ng.ml-1. Quality control samples, prepared at three concentration levels of 5.0, 25.0, 75.0 and 125.0 ng.ml-1 for S-CPM were made with blank plasma. The samples were vortexed and stored at (-) 70±2 °C for further processing.
Ar
ch
ive
of
2. Materials and methods 2.1. Chemicals and reagents The reference standards of S-CPM (purity: 99.67%) and STA (purity: 98.44%) were obtained from M/s, Orchid pharmaceuticals (Chennai, India) and Cadila Pharma (Ahmedabad, India). Highly purified water was prepared in-house using a Milli-Q water purification system obtained from Millipore (India) Pvt. Ltd. (Bangalore, India). Gradient grade methanol and acetonitrile were
purchased from E. Merck Ltd. (Mumbai, India). Ammonium acetate and formic acid were purchased from Qualigens Fine Chemicals (Mumbai). Drug free (blank) heparinized human plasma was obtained from the local Nursing hospital (Ootacamund, India) and was stored at (-) 20 °C prior to use.
2.3. Sample preparation A 0.5 ml aliquot of human plasma sample was mixed with 0.1 ml of the internal standard working solution (2500.0 ng.ml-1 of STA) and 1.0 ml of borate buffer of pH 9.00 were added and mixed. The resulting solution was vortexed and extracted by ethyl acetate (3×2 ml). The upper organic layer was separated, evaporated and the drug was reconstituted using 0.5 ml of the mobile phase and analyzed.
Figure 1. Structure of dexchlorpheniramine and simvastatin.
162
www.SID.ir
Determination of dexchlorpheniramine
Table 1. Precision studies of dexchlorpheniramine maleate samples (ng.ml-1). Quality control Nominal sample concentration
Intra-assay Mean concentration (ng.mL-1) SD % CV
LLOQ LQC MQC HQC
4.519 24.472 73.686 123.221
5.00 25.00 75.00 125.00
0.330 0.383 1.370 1.433
7.28 1.57 1.86 1.16
Inter -assay N
Mean concentration (ng.mL-1)
SD
% CV
N
5 5 5 5
4.573 24.661 73.902 123.225
0.385 0.402 1.530 1.434
8.42 1.63 2.07 1.16
5 5 5 5
S.D: Standard deviation; CV: Coefficient of variance; N: Total number of observations for each concentration; LLOQ: Lower limit of quantification; LQC: Lower quality control; MQC: Middle quality control; HQC: High quality control.
chromatograms obtained from the samples containing S-CPM and the internal standard STA with those obtained from blank samples. Sensitivity was determined in terms of LLOQ “lower limit of quantification” where the response of LLOQ should be at least five times greater than the response of interference in blank matrix at the retention time or mass transitions of the analyte. The linearity of different concentrations of standard solutions was prepared to contain 1 to 150 ng.ml-1 of SCPM containing 2500.0 ng.ml-1 of STA. These solutions were analysed and the peak areas and response factors were calculated. The calibration curve was plotted using response factor against concentration of the standard solutions. The standard curve fitting was determined by applying the simplest model that adequately describes the concentration-response relationship using appropriate weighing and statistical tests for goodness of fitting. The precision of the method was determined by intraday precision and interday precision. The intraday precision was evaluated by analysis of blank plasma sample containing S-CPM at three different concentrations namely low, medium and high quality control concentrations using nine replicate determinations for three occasions. The interday precision was similarly evaluated over a two-week period. The accuracy of the developed method was determined by relative and absolute recovery experiments. The relative recovery of the drug was calculated by comparing the concentration obtained from the drug supplemented plasma to the actually added concentration. Recovery studies were carried
Ar
ch
ive
of
SI
D
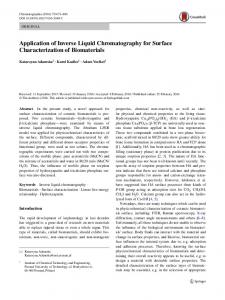
2.4. Instrumentation Chromatographic separation was carried out on a Shimadzu HPLC (Shimadzu Corporation, Japan) with phenomenex (Luna) - ODS (100x4.6 mm i.d., 5 μm). The mobile phase consisting of a mixture of methanol (10 mM) and ammonium acetate (90:10 v/v) was delivered with a flow rate of 0.5 ml/min. under ambient temperature. The total running time for each sample analysis was 6.0 min. Mass spectra were obtained using a Single Quadrupole mass spectrometer (Shimadzu, Japan) equipped with Atmospheric Pressure Chemical Ionization (APCI) source and Electrospray ionization (ESI). The mass spectrometer was operating in the selected ion-monitoring (SIM) mode. Sample introduction and ionization was done in the positive ion mode. The spray voltage and capillary temperature were 1.3 KV and 400 °C, respectively. The mass transition ion-pair was selected as m/z 274.9 for S-CPM (Figure 3) and m/z 302.9 for STA. The data acquisition was ascertained by LC-MS solution data station. For quantification, the peak area ratios of the target ions of the drugs to those of the internal standard were compared with weighted (1/c) least squares calibration curves in which the peak area ratios of the calibration standards were plotted versus their concentrations. 2.5.Validation The method was validated according to FDA guidelines [10, 11] and was validated for selectivity, sensitivity, linearity, precision, accuracy, and stability. The selectivity of the method was evaluated by comparing the
163
www.SID.ir
AJ Raju et al./ IJPS Summer 2007; 3(3): 161-170
Table 2. Stability of dexchlorpheniramine maleate in human plasma samples. Sample concentration Concentration found (ng.ml-1) (n = 6) (mean±S.D.) (ng.ml-1)
24.3937±0.46660 73.3997±0.60909 124.4027±1.95214
1.91 0.83 1.58
24.7066±0.51219 73.7361±1.18283 124.7353±0.63385
2.07 1.60 0.51
25.0503±0.10986 74.9663±0.11445 124.0693±0.92361
0.44 0.15 0.74
D
Short-term stability (1, 2, 3 h) 25 75 125 Long-term stability (4 weeks) 25 75 125 Stock solution stability (7, 14, 21 Days) 25 75 125 Freeze thaw stability (3 Cycle) 25 75 125
SI
24.7416±0.3771 73.1361±1.06265 124.7513±0.58869
1.52 1.49 0.47
(-)70 °C over 4 weeks. In addition, stability of standard solutions was performed at room temperature for 6 h and freeze condition for four weeks. The stability of triplicate spiked human plasma samples following three freeze thaw cycles was analysed. The mean concentrations of the stability samples were compared to the theoretical concentrations. The stability of triplicate short term samples spiked with S-CPM was kept at the room temperature for 1.00 to 3.00 h before extraction. The plasma samples of the long term stability were stored in the freezer at (-) 70 °C until the time of analysis.
Ar
ch
ive
of
out six times for three levels and the percentage recovery, mean, standard deviation and coefficients of variation were calculated. As a part of the method validation, stability and partial volume analysis were evaluated. The room temperature stock solution stability, refrigerated stock solution stability, freeze thaw stability, short term stability and long term stability were determined. The room temperature stock solution stability was carried out at 0, 3 and 8 h by injecting four replicates of prepared stock dilutions of SCPM equivalent to middle quality control sample concentration and the stock dilution of the internal standard equivalent to the working concentration. Comparison of the mean area response of S-CPM and internal standard at 3 and 8 h was carried out against the 0 h value. Refrigerated stock solution stability was determined at 7, 14 and 27 days by injecting four replicates of prepared stock dilutions of the analyte equivalent to the middle quality control sample concentration and the stock dilution of internal standard equivalent to the working concentration. The stability studies of plasma samples spiked with S-CPM were subjected to three freezethaw cycles, short term stability at the room temperature for 3 h and long term stability at
% CV
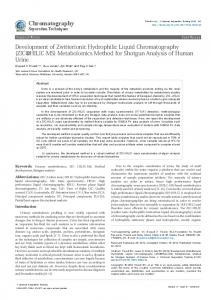
3. Results and discussion 3.1. Method development The goal of this work was to develop and validate a simple, rapid and sensitive assay method for the quantification of S-CPM, suitable to determine the pharmacokinetics of this compound in clinical studies. To achieve this goal, during method development different options were evaluated to optimize sample extraction, detection parameters and chromatography. The standard solutions of SCPM were analysed by LC-MS system using direct injection probed with ESI and APCI interfaces. From the mass spectrum recorded, 164
www.SID.ir
Determination of dexchlorpheniramine
the detection molecular ion selected was 274.9 for S-CPM (Figure 4).
Different reversed phase stationary phases (C 4 , C 8 , and C 18 ) were used and the chromatograms were recorded. Based on the retention and peak shape, Phenomenex Luna ODS column was selected for S-CPM. Liquid-liquid extraction (LLE) was used for the sample preparation in this work. LLE can be helpful in producing a spectroscopically clean sample and avoiding the introduction of non-volatile materials onto the column and MS system. Clean samples are essential for minimizing ion suppression and matrix effect in LC-MS analyses. Six organic solvents, diethyl ether, ethyl acetate, hexane, dichloromethane, chloroform and butyl tertmethyl ether, and their mixtures in different combinations and ratios were evaluated. Finally, an ethyl acetate was found to be optimal, which can produce a clean chromatogram for a blank plasma sample and yield the highest recovery for the analyte from the plasma.
of
SI
D
3.2. Optimization of the chromatographic conditions The chromatographic conditions, especially the composition of mobile phase, were optimized through several trials to achieve good resolution and symmetrical peak shapes for the analyte and the IS, as well as a short run time. Modifiers, such as ammonium acetate and acetic acid alone or in combination with different concentrations were added. It was found that a mixture of acetonitrile-water (containing 10 mm ammonium acetate and 0.5% acetic acid) (90:10, v/v) could achieve this purpose and was finally adopted as the mobile phase. The percentage of acetic acid was optimized to maintain this peak shape while being consistent with good ionization and fragmentation in the mass spectrometer. After careful comparison of several columns, a Phenomenex (Luna)-ODS column (100×4.6 mm, i.d., 5μm) was finally used with a flow rate of 0.5 ml/min. to produce good peak shapes and permit a run time of 2.0 min. In order to produce a spectroscopically clean sample and avoid the introduction of nonvolatile materials onto the column and MS system, LLE was used for the sample preparation in this work. Clean samples are essential for minimizing ion suppression and matrix effect in LC-MS analyses.
Ar
ch
ive
3.3. Validation Estimation of the S-CPM in plasma samples from the volunteers was carried out using optimized chromatographic conditions. The validation parameters such as accuracy, precision (repeatability and reproducibility), linearity and range, sensitivity (limit of detection and limit of quantitation), robustness/ruggedness, stability, selectivity/ specificity and system suitability studies were evaluated. The validation results are given
Figure 2. LC-MS chromatogram of blank plasma sample.
Figure 3. LC-MS chromatogram of dexchlorpheniramine maleate and internal standard sample.
165
www.SID.ir
AJ Raju et al./ IJPS Summer 2007; 3(3): 161-170
Table 3. Mean pharmacokinetic properties of dexchlorpheniramine maleate obtained from studied subjects (N=24) after administration of a single 6-mg dose of reference and test dexchlorpheniramine maleate formulations. Pharmacokinetic parameters* Test Reference (N=24) (N=24)
Cmax, ng.ml-1 tmax, h AUC0-t (ng.h.ml-1) keli AUC0-Q (ng.h.ml-1) t1/2 (h)
25.3421 (2.0605) 3.2708 (1.1514)
22.1150 (4.4148) 6.7500 (0.9891)
234.1008 (22.8974) 0.1000 (0.0135) 262.8429 (23.6587)
241.5723 (33.8520) 0.1177 (0.0225) 270.3695 (35.5413)
7.0192 (0.9464)
6.0855 (1.0840)
Tmax: Time of maximum concentration; Cmax: Maximum concentration; AUC: Area under the concentration time curve; T1/2: Half-life; keli: Elimination rate constant; AUC0-t: Area under the plasma concentration-time curve, last available measurement; AUC0-α: Area under the plasma concentration-time curve from time 0 to infinity. *Values in the parenthesis indicate standard deviation.
in Table 1. The reference standard solution with internal standard, matrix blank without the internal standard, zero sample [Matrix blank with internal standard], spiked calibration standards, quality control samples were analysed and chromatograms were recorded. The mobile phase used for the assay provided a well defined separation between the drug, the internal standard and endogenous components. The blank plasma samples showed no interference at retention time of the drugs and their internal standards (Figure 2).
SI
D
these values was less than 10.00%. It is concluded that the developed methods are accurate and reliable.
ive
of
3.5. Precision The optimized method for the estimation of S-CPM was found to be precise (Table 2). This was evident from the coefficieny of variation values, which were less than 10.00% in all concentrations.
Ar
ch
3.4. Accuracy The accuracy of the optimised methods was determined by relative and absolute recovery experiments (Table 1). The percentage recovery values for S-CPM ranged from 89.06 to 91.32% and their relative recovery values ranged from 88.07 to 91.33 %. The coefficient of variation (%) of
Figure 4. Mass spectrum of dexchlorpheniramine maleate in positive mode Scan.
3.6. Specificity Specificity of the method was analysed by six blank plasma samples and the recorded chromatograms. These chromatograms were compared with the chromatograms obtained from standard solutions. Each chromatogram was tested for interference. The combination of the sample preparation procedure and chromatography provided an assay which is free from significant interfering endogenous plasma components at the retention times of the S-CPM and the internal standard. These observations show that the developed assay method is specific and selective. 3.7. Linearity It was observed that the optimised methods were linear within a specific range of S-CPM concentration. The calibration curves were plotted between response factor and concentration of the standard solutions. The linearity range were found to be 1 to 150 ng.ml -1 . The calibration curves were
166
www.SID.ir
Determination of dexchlorpheniramine
Table 4. Results of statistical analysis of the bioequivalency study of test and reference dexchlorpheniramine maleate formulations. AUC0-t (ng.h/ml-1) AUC0- α (ng.h/ml-1) Cmax, (ng ml-1)
Ratio (%) Geometric CI (%)
105.8 92.36-107.06
104.7 95.51-107.06
constructed on 11 different days over a period of four weeks to determine the variability of the slopes and intercepts. The results indicated no significant interday variability of slopes and intercepts over the optimised concentration range.
111.00 93.69-107.74
temperature and freeze condition within 6 h and within 4 weeks, respectively. The mean concentrations of samples were compared to the theoretical concentrations. The results indicated that selected drugs in plasma samples can be stored in freezing condition for 1 month without degradation. The results of stability studies of short term storage of plasma and also sample solution at room temperature and freeze thaw cycles show that no S-CPM degradation happened and therefore, plasma samples could be handled without special precautions.
SI
D
3.8. Limit of detection The limit of detection (LOD) values was found to be 0.25 ng.ml-1 for S-CPM and their limit of quantification (LOQ) values were 1.00 ng.ml-1. These observations indicate that the developed methods have adequate sensitivity. These values, however, may be affected by the separation conditions (eg. column, reagents, and instrumentation and data systems), instrumental changes (eg. pumping systems and detectors) and use of non HPLC grade solvents may results in changes in signal-to-noise ratios.
ive
of
3.11. System suitability studies System suitability parameters such as column efficiency (theoretical plates), resolution factor and peak asymmetry factor of the optimised methods were found to be satisfactory. Theoretical plates of the columns ranged from 18432 to 22987 and their resolution factor was 2.46. Similarly, the peak asymmetry factors ranged from 1.01 to 1.09. All these observations supported the system suitability for the evaluation of selected drugs. In conclusion, this is an accurate, precise, selective and linear method for S-CPM estimation in plasma and hence can be used for bioavailability and bioequivalency studies.
Ar
ch
3.9. Ruggedness and robustness The ruggedness and robustness of the methods were studied by changing the experimental conditions. No significant changes in the chromatographic parameters were observed when the experimental (operators, instruments, source of reagents and column of similar type) and optimised conditions (pH, mobile phase ratio and flow rate) were changed.
3.12. Application of the developed method The proposed method was applied to the determination of S-CPM in plasma samples from an on going project bioequivalence studies of sustained release formulation. Open label, balanced, randomized, two-treatment, two sequence, two-period, single dose, crossover bioequivalence study of marketed repetabs containing 6 mg of S-CPM (reference sample) against SR tablets containing 6 mg of S-CPM (test sample) manufactured by Sipali
3.10. Stability studies The stability of plasma samples which had been spiked with selected drugs were studied by subjecting the samples to three freezethaw cycles; short and long term stabilities at room temperature were measured within 3 h and within 4 weeks at (-)70 °C, respectively (Table 2). In addition, stability of standard solutions was measured at the room 167
www.SID.ir
AJ Raju et al./ IJPS Summer 2007; 3(3): 161-170
D
drawn as to whether the test product was bioequivalent to the reference product. Bioequivalence was to be concluded if the 90.0% confidence interval fell within the bioequivalency range 80.0-125.0 % for Cmax, AUC0 - t and AUC0- Q. The mean (±S.D.) plasma maximum concentration obtained for S-CPM in reference and test formulation is 22.1150 (4.4148) ng.ml -1 and 25.3421 (2.0605) ng.ml-1 (Table 3), respectively.
SI
4. Conclusions A simple, specific, rapid and sensitive analytical method for the determination of S-CPM in human plasma has been developed. The developed LC-MS method was successfully applied for the bioequivalency studies. The method provided excellent specificity and linearity with a of quantification limit of 1.00 ng.ml-1 for SCPM.
Ar
ch
ive
of
Chemicals, India in healthy, adult, male, human subjects under fasting conditions was conducted in accordance with the current good clinical practice (GCP) and FDA guidelines. The study was performed on healthy, willing, 24 male volunteers 18-45 years of age, after they had been informed of the purpose, protocol and risk involved in the study. All subjects gave written informed consent and the protocol was approved by local ethics committee. The venous blood samples 6 ml including (1 ml discarded heparinised blood) were withdrawn via an indwelling cannula at pre-dose and at 0.5, 1.0, 1.5, 2.0, 3.0, 4.0, 6.0, 8.0, 12.0, 18.0 and 24 h following drug administration in each period of the study. The samples were collected in pre-labeled vacutainers containing sodium citrate as the anti coagulant and centrifuged at 3000 rpm for 15 min. at 15 °C and plasma was collected in pre-labeled sample collection tube. A wash out period of 7 days was observed between the two phases of the study. The samples were stored in the deep freezer at (-)70±5 °C until analyzed by a validated LC-MS method. The pharmacokinetic parameters namely maximum plasma concentration (Cmax), time point of maximum plasma concentration (Tmax), area under the plasma concentrationtime curve from 0 h to the last measurable concentration (AUC0-t), area under the plasma concentration time curve from 0 h to infinity (AUC0-Q), elimination rate constant (λZ) and half-life of drug elimination during the terminal phase (t1/2) were calculated using PK solution software statistical analysis of pharmacokinetic parameters was carried out using SPSS 12.0.1 for un-transformed and ln-transformed pharmacokinetic parameters Cmax, AUC0-t and AUC0-Q (Tables 3 and 4). Based on the statistical results of 90.0% confidenct intervals for the ratios of the means of ln-transformed pharmacokinetic parameters Cmax, AUC0-t and AUC0-Q conclusion was
References [1] Marin A, Barbas C. LC-MS for the degradation profiling of cough-cold products under forced conditions. J Pharm Biomed Anal 2004, 35: 103545. [2] Suntornsuk L, Pipitharome O, Prapin Wilairat P. Simultaneous determination of paracetamol and chlorpheniramine maleate by micellar electrokinetic chromatography. J Pharm Biomed Analy 2003; 33: 441-9. [3] Takagaki T, Matsuda M, Mizuki Y, Terauchi Y. A simple and sensitive method for the determination of chlorpheniramine maleate in human plasma using liquid chromatography-mass spectrometry. J Chromatogr B 2002; 776: 169-76. [4] van Eeckhaut A, Detaevernier MR, Michotte Y. Development of a validated capillary electrophoresis method for enantiomeric purity testing of dexchlorpheniramine maleate. J Chromatogr A 2002; 958: 291-7. [5] Indrayanto G, Sunartob A, Adriani Y. Simultaneous assay of phenylpropanolamine hydrochloride, caffeine, paracetamol, glycerylguaiacolate and chlorpheniramine maleate in Silabat TM tablet using HPLC with diode array detection. J Pharm Biomed Anal 1995; 13: 1555-9.
168
www.SID.ir
Determination of dexchlorpheniramine
[6] Yamato S, Nakajima M, Shimada K. Simultaneous determination of chlorpheniramine and maleate by high-performance liquid chromatography using tetra-nbutylammonium phosphate as an ion-pair reagent. J Chromatogr A 1996 731: 346-50. [7] Hood DJ, Cheung HY. A chromatographic method for rapid and simultaneous analysis of codeine phosphate, ephedrine HCl and chlorpheniramine maleate in cough-cold syrup formulation. J Pharm Biomed Anal 2003; 30: 1595-601. [8] Celma C, Allue JA, Prunonosa J, Peraire C, Obach R. Simultaneous determination of paracetamol and chlorpheniramine in human plasma by liquid chromatography-tandem mass spectrometry. J Chromatogr A 2000 870: 77-86. [9] Andronis V, Mesiha MS, Plakogiannis FM. Design and evaluation of transdermal chlorpheni-
Ar
ch
ive
of
SI
D
ramine maleate drug delivery system. Pharm Acta Helvet 1995; 70: 301-6. [10] FDA guidance for industry, bioavailability studies for orally administered drug: Products-general considerations. US Department of Health and Human Services, Food and Drug Administration, Centre for Drug Evaluation and Research (CDER), 2000, website: http://www.fda.gov /cder/guidance/index.htm. [11] FDA guidance for industry, statistical approaches to establishing bioequivalence. US Department of Health and Human Services, Food and Drug Administration, Centre for Drug Evaluation and Research (CDER), 2001, Website: http:// www.fda.gov/cder/guidance/index.htm.
169
www.SID.ir