Analytical Biochemistry 281, 135–143 (2000) doi:10.1006/abio.2000.4564, available online at http://www.idealibrary.com on
Development and Application of Surface Plasmon Resonance-Based Biosensors for the Detection of Cell–Ligand Interactions John G. Quinn,* ,§ ,1 Shane O’Neill,‡ ,§ Aidan Doyle,† ,§ Colm McAtamney,† ,§ Dermot Diamond,‡ ,§ ,¶ Brian D. MacCraith,† ,§ ,¶ and Richard O’Kennedy* ,§ ,¶ *School of Biotechnology, †School of Physical Sciences, ‡School of Chemical Sciences, and §Biomedical and Environmental Sensor Technology Centre, Dublin City University and ¶National Centre for Sensor Research, Dublin 9, Ireland
Received June 8, 1999
Surface plasmon resonance (SPR)-based biosensors were investigated with a view to providing a portable, inexpensive alternative to existing technologies for “real-time” biomolecular interaction analysis of whole cell–ligand interactions. A fiber optic SPR-based (FOSPR) biosensor, employing wavelength-dependent SPR, was constructed to enable continuous real-time data acquisition. In addition, a commercially available integrated angle-dependent SPR-based refractometer (ISPR) was modified to facilitate biosensing applications. Solid-phase detection of whole red blood cells (RBCs) using affinity-captured blood group specific antibodies was demonstrated using the BIACORE 1000, BIACORE Probe, FOSPR, and ISPR sensors. Nonspecific binding of RBCs to the hydrogel-based biointerface was negligible. However, the background noise level of the FOSPR-based biosensor was ⬃25-fold higher than that of the widely used BIACORE 1000 system while that of the ISPR-based biosensor was over 100-fold higher. Nevertheless, the FOSPR biosensor was suitable for the analysis of macromolecular analytes contained in crude matrices. © 2000 Academic Press
Surface plasmons are longitudinal oscillations of free charges on the surface of a metal film that can be excited under specific conditions of total internal reflection of plane-polarized light. Under these conditions, the wave vector of the evanescent wave is equal to the wave vector of the surface plasmon and a fraction of the incident light is absorbed, thereby diminishing the intensity of the reflected light (6). This occurs for a spe1 To whom correspondence should be addressed. Fax: ⫹353-1-7045412. E-mail:
[email protected].
0003-2697/00 $35.00 Copyright © 2000 by Academic Press All rights of reproduction in any form reserved.
cific angle of incidence ( sp) at a given wavelength () and is a function of the dielectric properties of the sample medium and, therefore, its refractive index. Hence, optical SPR-based transducers may be configured for fixed-angle variable-wavelength mode or multiple-angle fixed-wavelength detection mode. Both optical configurations enable the progress of a biomolecular interaction to be monitored by detecting the change in refractive index within the probed layer. The refractive index change is directly related to a change in the protein concentration (4) by ⌬c ⫽ ⌬n(⭸c/ ⭸n), where ⭸c/⭸n is 5–7 g/cm 3, ⌬n is the refractive index change, and c is the protein concentration. We propose to investigate red blood cell (RBC)–antibody interactions using four surface plasmon resonance (SPR) 2 based biosensing systems. The use of SPR-based biosensors for the study of whole cell–ligand interactions is largely unexplored. Nevertheless, the detection of whole cells binding to a functionalized dextran surface has been documented for prokaryotic (1) and eukaryotic cells (2). SPR sensing produces “real-time” interaction curves that provide detailed information concerning the progress of surface binding events (3). We reported a preliminary investigation employing covalently immobilized monoclonal IgM for the detection of whole RBCs using the BIACORE 1000, a well-established angle-dependent SPR-based biosensing system (4). We demonstrated that antibodies reversibly capture target RBCs from suspension, thereby permitting solid-phase blood grouping. More2
Abbreviations used: SPR, surface plasmon resonance; FOSPR, fiber optic surface plasmon resonance; ISPR, integrated angle-dependent surface plasmon resonance; RBC, red blood cell; PBS, phosphate-buffered saline; HBS, Hepes-buffered saline; BSA, bovine serum albumin; CM, carboxymethylated. 135
136
QUINN ET AL.
over, the 50-m channels of the BIACORE analyzer did not hinder the analysis of physiological concentrations of RBC (e.g., ⬍40% (v/v)). Clearly, the viscoelastic properties of RBCs (5) facilitate the delivery of high RBC densities to the flow cell via the microfluidic system without causing blockages within the system. It is expected that the maximum cell-binding response will be limited by the fractional coverage of the sensor surface, the presence of an impenetrable hydrogel, and fluid dynamic effects. These limitations are significant due to the short penetration depth (i.e., ⬃200 nm (7)) of the evanescent wave and its exponential decay from the surface. However, the deformable biconcave disk morphology of the RBC facilitates an increased fractional coverage of the sensor surface in comparison to spherical cells. This combined with the high refractive index of RBCs (i.e., 1.39 (8)) significantly increases the expected cell-binding response. The widely employed BIACORE 1000/2000/3000 real-time biosensors are fully automated biosensing systems (BIACORE AB, St. Albans, Herts AL13AW, England). These analyzers employ a microfluidic system that has been designed to minimize mass transport limitation for kinetic analyses. Expectedly, we observed poor signal quality resulting from flow disturbances at high RBC concentrations (⬎40% (v/v)) when using the BIACORE 1000 (unpublished observations). Hence, the BIACORE Probe was employed to avoid these sampling difficulties. The BIACORE Probe is a fiber optic SPR-based biosensor, which differs from the integrated analyzer approach to biosensor design. A hand-held micropipette takes up the sample, bringing it into contact with the sensing surface. The disposable fiber optic sensing surface (CM5 Probe), which employs the same hydrogel-based biointerface as BIACORE’s SPR chip (CM5 chip), is fitted to the pipette. Real-time data acquisition is not supported, but a touchpad control interface enables a single-point measurement to be recorded as desired. The background noise level was approximately 10-fold higher than that of the BIACORE 1000 system. We have investigated alternative SPR-based sensors designs to enable continuous real-time interaction analysis of whole RBC–antibody interactions at high cell concentrations (e.g., 100% (v/v)). A commercially available miniature spectrophotometer was combined with a white light source, a bifurcated fiber optic cable, and a gold-coated fiber optic to yield a device similar to the BIACORE Probe. In a second approach, we have investigated the use of a low-cost integrated SPR (ISPR) transducer (9) available from Texas Instruments (Dallas, TX). This device was tested using two different formats. First, a hydrogel-based biomolecular interaction layer was grafted onto the gold layer of this device to facilitate real-time biomolecular interaction analysis. Second,
the device was modified to allow the incorporation of a disposable SPR sensor chip (i.e., the CM5 chip) as employed by the BIACORE instruments. MATERIALS AND METHODS
Equipment and Reagents The BIACORE 1000 and BIACORE Probe were obtained from BIACORE AB (St. Albans, Herts, AL13AW, England). All data analysis was performed using BIAevaluation 3.0 and Microsoft Excel software (Microsoft Corp.). All optical components were purchased from Ocean Optics (1104 Pinehurst Rd., Dunedin, FL) unless otherwise stated. FOSPR sensor construction. The configuration of the FOSPR sensor is similar to that developed by Jorgenson and Yee (10). A tungsten– halogen lamp (LS-1) was connected to the input arm of a bifurcated optical fiber probe (RS00-7) that accommodates reflective mode operation. An optical fiber sensing element was fitted to this optical fiber cable via a customized optical fiber connector that was fabricated “in house.” A miniature S2000 spectrometer, connected to the output arm of the optical fiber probe, monitored spectral changes in the propagated light resulting from SPR. Hence, an increase in the refractive index at the hydrogel layer caused a shift (i.e., response) in the resonance spectrum that was monitored using the miniature spectrometer. A National Instruments DAQ-700 PCMCIA I/O card was used to acquire data from the spectrometer. Data acquisition, processing, and display were performed using “custom-written” LabVIEW software (11, 12) and a laptop Pentium II class computer. The sensing element, a CM5 probe available from BIACORE AB, was a gold-coated (⬃50-nm layer) declad optical fiber with a mirror deposited at the tip. This sensing element was supplied with a carboxymethylated dextran (CM– dextran) hydrogel grafted onto the gold surface via an alkanethiol self-assembled monolayer. Integrated SPR sensor. This SPR transduction system (Speeta) was obtained from Texas Instruments. The system includes an SPR transducer with a goldcoated sensing surface, connector cables, power adapter, control box, flow cell, and dedicated software. Essentially, the device consists of miniature electrooptical components mounted on a single platform using conventional semiconductor-based optoelectronic manufacturing techniques (9). Reagents. Hybridoma supernatants containing anti-A IgG were donated by Gamma Biologicals (3700 Mangum Rd., Houston, TX). Human blood samples were obtained from the Blood Transfusion Service Board (40 Pelican House, Mespil Rd., Dublin 4, Ireland). Previously grouped EDTA anticoagulated whole
SURFACE PLASMON RESONANCE-BASED BIOSENSORS FOR CELL–LIGAND INTERACTIONS
blood samples were obtained 2 days after bleeding and were stored for no longer than 3 days at 4°C prior to analysis. Furthermore, RBC samples were allowed to equilibrate at room temperature before use in order to permit them to recover from reversible deformation incurred during storage at 4°C. All other chemicals were purchased from Sigma Chemical Co. (Fancy Rd., Poole, Dorset BH12 4QH, England) unless otherwise stated. Washing and enumeration of RBCs. After removal of the buffy layer (contains white blood cells), 1.0 ml of packed RBC was added to 50-ml centrifuge tubes. Forty-nine milliliters of Hepes-buffered saline (HBS), containing 10 mM Hepes, 0.15 M NaCl, pH 7.4 (or phosphate-buffered saline (PBS), Dulbeco’s A formulation, 0.14 M NaCl, pH 7.4), was added, and the cells were gently suspended. The cells were centrifuged at 1000g for 5 min. The supernatant was discarded and the pellet was resuspended in 49 ml of fresh PBS. This washing procedure was repeated three times and the cells were equilibrated at room temperature immediately before analysis. RBCs were counted using an improved Neubauer haemocytometer and a Nikon phase-contrast ELWD 0.3 microscope. RBC concentrations were also prepared as % (v/v) suspensions. A packed RBC pellet was assumed to represent 100% (v/v) RBCs and the appropriated dilutions were prepared from this sample (NB: 100% (v/v) RBC ⬇ 11.6 ⫻ 10 9 cells/ml). Calibration of FOSPR and ISPR Sensors Serial dilutions of 50% (v/v) glycerol in ultrapure water were prepared. The refractive index of these glycerol:water solutions was determined in duplicate at room temperature (i.e., 24.3°C) using an Abbe´ refractometer. These solutions of known refractive index were employed for sensor calibration. A calibration curve was constructed from the data and the appropriate calibration model was fitted to the data using BIAevaluation 3.0 software or Microsoft Excel software. Construction of Biointerface for ISPR Sensor Surface derivatization. The method outlined by Lo¨fås and Johnsson (13) was employed for surface derivatization. Briefly, the gold layer of the ISPR sensor was immersed in 5 mM 11-mercaptoundecanol (dissolved in 80% (v/v) ethanol) and incubated at 30°C overnight. The resulting self-assembled monolayer was rinsed with ultrapure water and activated by exposure to 0.6 M epichlorohydrin (dissolved in a 1:1 mixture of 0.4 M NaOH and 2-methoxyethyl ether) for 4 h at room temperature. The surface was rinsed with ethanol and incubated in 30% (w/v) dextran (molecular weight of
137
500 kDa) dissolved in 0.2 M NaOH for 15 h at room temperature. The surface was then rinsed in ultrapure water and immersed in 1 M bromoacetic acid dissolved in 2 M NaOH. After 4 h of incubation at room temperature, the surface was thoroughly rinsed in water and the device was stored at 4°C with desiccant. Preconcentration of BSA onto the CM– dextrancoated surface. The presence of the CM– dextran coating was confirmed by performing a preconcentration test. A customized flow cell was attached to the ISPR sensor and was flushed with ultrapure water. A bovine serum albumin (BSA) solution (100 g/ml in 10 mM sodium acetate, pH 4.5) was injected into the flow cell (volume of 10 l) and preconcentration of the positively charged BSA onto the negatively charged matrix was observed for 2 min. The preconcentrated protein was removed by injecting PBS into the flow cell to disrupt the ionic interactions. Ultrapure water was injected into the flow cell to return the signal to the initial baseline response. Biosensor integrated with a disposable SPR chip. In order to investigate the performance of the ISPR sensor with a disposable sensing element, the permanent gold coating was removed by polishing with finegrained sandpaper. A low-volume (i.e., 5 l) flow cell was custom fabricated (in house) to facilitate docking of a CM5 SPR chip. Microscope lens oil with a refractive index of approximately 1.51 was used to approximately match the refractive indices of the glass slide (1.52) and the epoxy plastic (1.52) of the SPR transducer. The assembled device, complete with flow cell, was then connected via a communications cable to the control box, which relays input and output data between a personal computer running proprietary software and the transducer. The sensor, fitted with the disposable SPR chip, was calibrated using the standard refractive index solutions of glycerol in water, described earlier. Detection of Whole RBCs Stability of protein A coated surface. Protein A (50 g/ml in sodium acetate buffer, pH 4.3) was immobilized (⬃5200 RU) using conventional amine coupling (13). Fifteen microliters of anti-A IgG (1/400 dilution in HBS buffer) was passed over the protein A coated surface at 5 l/min. The surface was regenerated using a 1-min pulse of 10 mM HCl. This binding–regeneration cycle was repeated for 124 cycles. BIACORE 1000 analysis. Protein A (50 g/ml in sodium acetate buffer, pH 4.3) was immobilized (⬃4400 RU) onto the dextran matrix using conventional amine coupling. Ten microliters of anti-A IgG hybridoma supernatant (diluted 400-fold in HBS running buffer) was injected over the interaction surface at 5 l/min. A washed blood group A sample was injected over the surface at 5 l/min for 5 min. The
138
QUINN ET AL.
surface was subsequently regenerated using a 1-min pulse of 10 mM HCl. Each sample was analyzed in triplicate in random order. This analysis was repeated for 10 samples from 0.13 ⫻ 10 9 to 1.32 ⫻ 10 9 cells/ml.
sponse was determined by exposing the protein A coated sensing element to 100% (v/v) group A RBCs for ⬃2 min in the absence of anti-A IgG. ISPR Analysis
BIACORE Probe Analysis This device uses a hand-held micropipette to aspirate the sample and bring it into contact with the sensing element within the pipette tip. One hundred microliters of each sample was aspirated during all analyses. The sensing element of the probe was exposed to PBS for 10 s before and after sample aspiration during all BIACORE Probe experiments. RBC titration curve. Protein A (50 g/ml in sodium acetate buffer, pH 4.3) was immobilized (⬃5.7 kRU, where 1 RU ⬇ 10 ⫺6 refractive index units) onto the surface using conventional amine coupling. The surface was exposed to neat anti-A IgG hybridoma supernatant for 30 s. Washed RBCs diluted in PBS were aspirated and allowed to interact with the surface for 1 min. Bound RBCs were removed by shearing forces generated by a wash bottle filled with PBS. The remaining antibody was removed using two 30-s exposures to 10 mM glycine, pH 1.7, followed by a 10-s exposure to 0.5% (v/v) Triton X-100 in PBS. The above binding–regeneration cycle was repeated in triplicate for increasing concentrations of washed group A RBC from 10% (v/v) to 100% (v/v). The determination of donor variation with respect to the RBC binding response was similarly performed. Washed group A RBCs from 18 donors were suspended at 50% (v/v) in HBS buffer and analyzed (n ⫽ 4) as outlined above. The nonspecific binding response was assessed by repeating the analysis for 50% suspensions of blood group O (10 donor samples) and blood group B (10 donor samples) RBCs. FOSPR Analysis Protein A (50 g/ml in sodium acetate buffer, pH 4.3) was immobilized onto a CM5 sensor probe surface by conventional amine coupling. A final protein A coating response of 8.8 arbitrary units (AU) was obtained, where a shift of 1 nm in the SPR spectral minimum represents 1 AU. The protein A coated sensing element was exposed to neat hybridoma supernatant (serumfree) containing monoclonal anti-A IgG for 1 min. The probe was then exposed to packed group A RBCs (suspended in PBS) for 2 min and the cell-binding response recorded. The sensing element was regenerated with a 20-s exposure to 20 mM HCl, a 15-s exposure to PBS containing 0.1% (v/v) Triton X-100, and a further 15-s exposure to 20 mM HCl. This procedure was repeated for group A RBC concentrations of 20, 40, 63, and 90% (v/v) in PBS. Furthermore, the nonspecific binding re-
A primary antibody was used to affinity capture the anti-A IgG onto the hydrogel. Goat IgG raised against the Fc region of mouse IgG (100 g/ml in 10 mM sodium acetate, pH 4.5) was immobilized onto a CM5 sensor surface by conventional amine coupling. Ultrapure water was injected into the flow cell to give a steady baseline. The final IgG immobilization response was recorded (i.e., ⌬n ⬇ 2.78 ⫻ 10 ⫺3 ). Neat anti-A IgG hybridoma supernatant (containing 0.3 M NaCl), pH 7.4, was injected for a contact time of 2 min. The flow cell was flushed with PBS. Washed group A RBCs (66% (v/v)) were injected and remained in contact with the sensor surface for 3.5 min. The flow cell was flushed with PBS and the response due to cell binding was recorded. The surface was regenerated using a 1-min exposure to 20 mM HCl followed by a 40-s exposure to 1% (v/v) Triton X-100. The nonspecific binding response was observed by conducting the analysis with 66% (v/v) group A RBCs in the absence of anti-A IgG. RESULTS AND DISCUSSION
Calibration of In-House Sensors Using data from a conventional Abbe´ refractometer, we obtained the following empirical relationship between refractive index and the glycerol concentration of glycerol:water solutions: n ⫽ 1.202 ⫻ 10 ⫺3 (% glycerol (v/v)) ⫹ 1.332218, with r 2 of 0.9985. The FOSPR sensor and the ISPR sensor were calibrated using these standard refractive index solutions. Expressions relating the refractive index at the interaction surface to the sensor response were obtained. As expected, the response of the FOSPR sensor was nonlinear and showed an increase in sensitivity to refractive index with increasing wavelength. The operational range of the sensor extended from a refractive index of 1.33 to 1.39. The signal noise, as expressed in refractive index units, varied from ⫾2.5 ⫻ 10 ⫺5 to ⫾ 1.5 ⫻ 10 ⫺5 from low to high response values. This background noise level is 30- to 50-fold higher than that of the BIACORE 1000 (7). As expected, the angle-dependent ISPR sensing configuration resulted in a linear dependence of the sensor response on the refractive index of the sample medium, giving the following empirical expression: n ⫽ 1.207 ⫻ 10 ⫺3 (% glycerol (v/v)) ⫹ 1.332215, with r 2 of 0.9985. The use of this sensor as a refractometer and biosensor has been previously demonstrated (9, 14, 15). However, the sensor’s performance is restricted by the signal/ noise ratio that is defined by the system’s electronic
SURFACE PLASMON RESONANCE-BASED BIOSENSORS FOR CELL–LIGAND INTERACTIONS
139
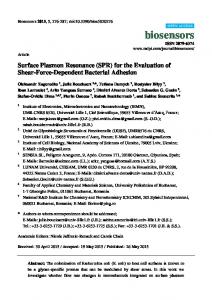
FIG. 1. Preconcentration of BSA onto the CM– dextran biointerface. The initial baseline is the response during exposure to water. The BSA solution (100 g/ml in 10 mM sodium acetate, pH 4.5) was injected into the flow cell and preconcentration of the positively charged protein onto the negatively charged matrix was observed (2-min incubation). The bulk refractive index change due to the dilute acetate buffer can be neglected. Hence, the refractive index change due to preconcentration was approximately 9.0 ⫻ 10 ⫺3 refractive index units. The preconcentrated protein was removed by injecting PBS into the flow cell to disrupt the ionic interactions and the flow cell was flushed with water, reestablishing the initial baseline response.
components (e.g., 8-bit analog/digital converter in the readout box). This limits the system’s resolution of the pixel position, giving a high background noise of ⫾1 ⫻ 10 ⫺4 refractive index units. Modification of the ISPR Device The device, as supplied by Texas Instruments, possesses a gold-coated SPR surface. A hydrogel-based biointerface was constructed at the gold surface in accordance with the method outlined by Lo¨fås and Johnsson (13). The assembly of the biointerface was confirmed by performing a preconcentration test and the resulting sensorgram is shown in Fig. 1. Essentially, the presence of CM– dextran at the surface will induce preconcentration of positively charged proteins under low ionic strength conditions, causing a reversible increase in response. Preconcentration of BSA gave a high refractive index change of 9 ⫻ 10 ⫺3. The response was reversible, indicating that nonspecific binding of BSA (10 mg/ml in HBS buffer) to the hydrogel-based biointerface was negligible. The presence of the biointerfacial layer was further confirmed by monitoring the increase in refractive index at the surface. The CM– dextran layer is approximately 100 nm thick (⭸n/⭸c(dextran) of 0.15) (6) and the refractive index increase due to the presence of the this layer was estimated to be 4.41 ⫻ 10 ⫺3. The ISPR device was interfaced with a CM5 SPR chip (BIACORE AB) using a refractive index matching
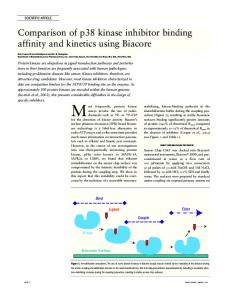
fluid (i.e., lens oil). The use of a disposable SPR chip avoids surface polishing and redeposition of gold layers onto the transducer. A flow cell was custom fabricated to facilitate docking the CM5 SPR chip with the device. The following empirical relationship relating the glycerol concentration to refractive index was determined: n ⫽ 0.001216(% glycerol) ⫹ 1.33230, with r 2 of 0.998. A wide refractive index range was observed (1.33–1.39), making it particularly suitable for the detection of high molecular weight macromolecules at high surface binding capacities. A real-time response curve for the calibration of the ISPR device interfaced with a CM5 chip and flow cell is shown in Fig. 2. The noise level (⫾5 ⫻ 10 ⫺5⌬n) was found to be 100-fold higher than that of the BIACORE 1000 system (5 ⫻ 10 ⫺7⌬n). Therefore, this system is not suitable for the study of low molecular weight interactants and is limited to applications that produce very high surface protein concentrations. Detection of Whole RBCs Our previous studies (4) using the BIACORE 1000 demonstrated that immobilized antibodies are capable of reversibly binding RBCs. However, a limited number of binding–regeneration cycles were possible due to an accumulative loss in cell-binding capacity after each cycle. We employed protein A affinity capture of the specific antibody to prolong the utility of the expensive CM5 chips. It was found that the relative binding re-
140
QUINN ET AL.
FIG. 2. Interaction curve for increasing glycerol concentrations using the miniature SPR device interfaced with a CM5 sensor chip and customized flow cell. Glycerol:water solutions were prepared by serially diluting a 40% (v/v) glycerol solution with ultrapure water. The samples were manually injected into the flow cell and were exposed to the surface for ⬎30 s.
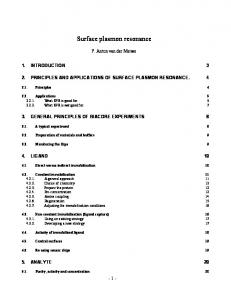
sponse of anti-A IgG hybridoma supernatant (diluted 400-fold in HBS running buffer) to a protein A coated surface decreased by approximately 5% over 124 binding–regeneration cycles with an average antibody binding response of 329.7 ⫾ 0.77 RU (unpublished results). Hence, this format was adopted for the present study. BIACORE 1000 analysis. The interaction of affinity-captured anti-A IgG and group A RBCs is shown in Fig. 3. Nonspecific binding was very low (⬃11 RU) while regeneration of the surface was nonideal as 21% of the total mass (i.e., RBC debris) remained at the surface. Furthermore, air spikes caused the SPR signal to fail at high RBC concentrations. This occurred frequently when analyzing concentrated RBC suspensions (⬎40% (v/v)) and may be attributed to turbulent fluid dynamic effects within the flow cell. A calibration curve (Fig. 4) of the cell-binding rate against concentration shows that the binding rate increased exponentially with RBC concentration. Cell binding in a flow stream. Particle adsorption is dictated by a number of fluid dynamic and electrochemical forces that have been described for cross-flow microfiltration systems (16). The forces acting within the microfluidic system of the BIACORE 1000 and within blood vessels may behave similarly. A qualitative model describing the dynamic forces acting at the interaction surface is shown in Fig. 5. Figures 5a–5c depict the progress of the interaction, and a characteristic sensorgram is shown in Fig. 5d. The cell-binding
process requires bulk transport of the RBCs to the interaction surface and the generation of sufficient binding avidity to overcome resistive forces. The magnitude of the avidity force is dependent on the affinity of the antibody–antigen interaction and the number of specific interactions formed. Furthermore, the binding
FIG. 3. RBC interaction curve obtained using the BIACORE 1000. Protein A was immobilized (⬃4400 RU) onto the dextran matrix using conventional amine coupling, and anti-A IgG hybridoma supernatant (diluted 400-fold in HBS running buffer) was injected over the interaction surface. Washed group A RBCs (1.06 ⫻ 10 9 RBCs/ml in HBS running buffer) were injected over the surface, giving a cell-binding response of 1156 RU. However, 21% of the total adsorbed mass remained after regeneration.
SURFACE PLASMON RESONANCE-BASED BIOSENSORS FOR CELL–LIGAND INTERACTIONS
FIG. 4. RBC binding rate as a function of RBC concentration. The initial binding rate was calculated for a series of interaction curves obtained as outlined in Fig. 3. A simple exponential fit describes the data well.
avidity may be expected to increase with increasing contact time due to capping of membrane-associated antigens. In addition, the presence of previously bound cells at the surface may result in cooperative binding of free cells (17). The motion of suspended cells can be described by an effective shear-induced diffusivity (18) which is strongly dependent on the cell concentration, size, and velocity. Furthermore, complex hydrody-
FIG. 5. Illustration depicts a simplistic description of charge repulsion effects on the progress of a given RBC binding interaction. The sensor surface is coated with a specific antibody that recognizes a specific membrane-associated antigen. (a) Point of injection of the RBC suspension. At this instant the cell-binding zone at the sensor surface is free of cells. (b) The cell-binding response exponentially declines as binding progresses. (c) A pseudo steady state is reached where cell binding ceases as the concentration of cells at the wall approximates the concentration in the bulk. Cells at the surface and within the bulk exert ionic repulsive forces on each other that may maximize the distance between cells and thus prevent free cells from entering the cell-binding zone. (d) Depiction of a RBC interaction curve showing the time-dependent changes of the binding response illustrated in a, b, and c.
141
FIG. 6. Calibration curve for the interaction of RBCs with affinitycaptured anti-A IgG employing the BIACORE Probe. A protein A coated CM5 probe was exposed to neat anti-A IgG hybridoma supernatant for 30 s, resulting in the capture of 3.5 kRU, approximately. RBCs were aspirated and allowed to interact with the surface for ⬃1 min. The surface was regenerated and the binding–regeneration cycle was repeated in triplicate for increasing group A RBC concentrations from 10 to 100% (v/v).
namic forces can result in the establishment of concentration gradients within the flow cell (e.g., tubular pinch effect (19)). BIACORE Probe analysis. It was expected that the use of the BIACORE Probe would avoid sampling difficulties, as highly viscous samples (100% (v/v) RBC) can be aspirated without deterioration of the SPR signal. Packed RBC samples were prepared and may be expected to contain ⬍5% extracellular fluid (20). A sigmoidal RBC titration curve for the interaction of increasing concentrations of RBCs with affinity-captured anti-A IgG is shown in Fig. 6. In contrast to the BIACORE 1000 studies, packed RBC suspensions (i.e., 100% (v/v) RBC) could be analyzed, allowing a complete titration curve to be constructed. The dynamic range for the sigmoidal titration curve is very low (⬍1 order of magnitude) and the limit of detection is approximately 5% (v/v) RBC. The donor variation of the RBC binding response was also evaluated. Washed group A RBCs (suspended at 50% (v/v) in HBS buffer) from 18 donors were analyzed and the results of the analysis are presented in Fig. 7. Significant donor variation (⬃2-fold) in the RBC binding response occurred for both blood group AB and group A samples. This variation may be attributed to the diversity of possible genotypes for the A-antigen and, hence, the variable copy number of antigen per cell (21). The nonspecific binding response was assessed using 50% (v/v) suspensions of blood group O RBCs (n ⫽ 10) and blood group B RBCs (n ⫽ 10) in HBS buffer. These samples were analyzed in an identical manner to the group A and AB donor samples and resulted in an average binding response of ⬍0.01 kRU. Significantly, the protein A coated probe was found to be stable for at least 100 cell
142
QUINN ET AL.
FIG. 7. Bar chart illustrating the RBC binding variation for individual donors as determined by BIACORE Probe analysis. Washed group A RBCs from 18 donors were suspended at 50% (v/v) in HBS buffer and analyzed (n ⫽ 4) as outlined in Fig. 6. The nonspecific binding response was assessed using 50% suspensions of blood group O (n ⫽ 10) and blood group B (n ⫽ 10) giving responses of ⬍0.01 kRU.
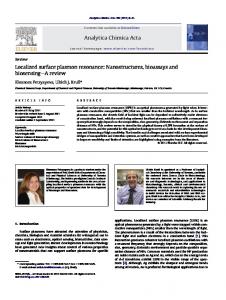
binding–regeneration cycles without deterioration of the RBC binding response. FOSPR sensor analysis. This sensor combines the desirable sampling attributes of the non-real-time BIACORE Probe with real-time sensing capability. Sampling was performed by simply immersing the ligand-coated sensing element in the sample. Similar to BIACORE Probe sampling, the sensing element was incubated in PBS buffer before and after each sample interaction to account for bulk refractive index variations. As in previous analyses, anti-A IgG was affinity captured by the protein A coated sensing element and enabled specific retention of group A RBCs (Fig. 8). The anti-A IgG capture step was reproducible (18.63 ⫾ 0.46 AU) for each binding cycle. Moreover, the interaction of group A RBCs was found to be highly specific since group A RBCs were not retained in the absence of anti-A IgG. The RBC binding response reached a plateau rapidly at high RBC concentrations (e.g., 100% (v/v)) whereas lower concentrations yielded a rapid initial binding phase followed by a much slower binding phase. In the absence of a flow cell, the development of a plateau may result from the inability of cells to reach the cell-binding zone due to charge repulsion. This is likely since the RBC membrane is highly negatively charged due to the presence of sialic acid residues. In addition, the resulting ionic repulsion may prevent RBCs from adhering to each other or to the negatively charged CM– dextran hydrogel. Unrelated studies have found ionic repulsion to be the dominant
resistive force for suspensions of latex particles (d ⫽ 0.021– 0.1 m) during cross-flow filtration experiments (16). ISPR biosensor. A primary capture antibody was immobilized using conventional amine coupling to facilitate the affinity capture of anti-A IgG from dilute hybridoma supernatant. Specific retention of RBCs
FIG. 8. Interaction curves for the detection of RBCs using the FOSPR sensor. The overlaid curves displayed above were normalized with respect to the initial baseline response. The protein A coated sensing element was exposed to neat hybridoma supernatant (serum-free) containing anti-A IgG for 1 min, giving a binding response of 18.5 AU. The probe was then exposed to washed group A RBCs for approximately 2 min. The sensing element was regenerated and the analysis repeated for each RBC sample. The response spikes at 2 min occur due to transfer of the sensing element from the RBC suspension to the PBS reference buffer.
SURFACE PLASMON RESONANCE-BASED BIOSENSORS FOR CELL–LIGAND INTERACTIONS
was demonstrated (response of 2.71 ⫻ 10 ⫺3⌬n) by injecting group A RBCs (66% (v/v)) over the surface. The background noise signal (⫾2 ⫻ 10 ⫺5⌬n) exceeded that observed for the FOSPR system. A control curve showed that nonspecific binding of RBCs to the surface in the absence of specific antibody was negligible (⬍2 ⫻ 10 ⫺5⌬n). CONCLUSION
RBC detection was successfully demonstrated using four SPR-based biosensing systems. Affinity capture of anti-A IgG from crude hybridoma supernatant using protein A coated (or goat anti-mouse Fc coated) sensing elements allowed specific retention of group A RBCs. In addition, RBCs were not retained in the absence of anti-A IgG or when A-negative RBCs were employed. The background noise levels of the BIACORE Probe, FOSPR, and ISPR systems were considerably higher than that of the BIACORE 1000 system. The background noise signal of the FOSPR system was 15- to 25-fold higher while the background noise level of the ISPR system was ⬃100-fold higher. The FOSPR biosensor proved a real alternative to the expensive analyzers currently available. The noise level of the device may not rival the BIACORE series of biosensors, but several applications do not require a low limit of detection. The system was suitable for the analysis of crude samples and provided a means of monitoring RBC–ligand interactions in real time at high concentrations. Further analyses were not conducted with the ISPR system due to its inherently high background noise. However, given improvements in both design and transducer components, the background noise of this sensor may be decreased in the near future. A rapidly established plateau in the RBC binding response was observed during both BIACORE 1000 analyses (4) and the FOSPR sensor analyses. The exponential decay of the cell-binding response and the subsequent plateau may be established by the approach to surface saturation and the formation of a cell-free zone. This cell-free zone may result from the tendency of bound RBCs to repel free RBCs due to charge repulsion. ACKNOWLEDGMENTS The authors thank BIACORE AB for donating the optical fiber sensing elements (i.e., the CM5 sensor probe) and providing the
143
BIACORE Probe. In particular, we appreciate the contribution of Janette Handley, Ian Campbell, and Roberta Graves. We gratefully acknowledge the support of Enterprise Ireland, EU Fair Research Grant No. CT961181, and the International Fund for Ireland (BEST Centre Support).
REFERENCES 1. Watts, H. J., and Lowe, C. R. (1994) Anal. Chem. 66(15), 2465– 2470. 2. BIACORE AB (1995) Biotechnology Note 105. 3. Quinn, J. G., and O’Kennedy, R. (1999) Anal. Lett. 32(8), 1475– 1517. 4. Quinn, J. G., O’Kennedy, R., Smyth, M., Moulds, J., and Frame, T. (1997) J. Immunol. Methods 206, 87–96. 5. Blackshear, P. L., and Anderson, R. J. (1977) Blood Cells 3, 377. 6. Stenberg, E., Persson, B., Roos, H., and Urbaniczky, C. (1991) J. Colloid Interface Sci. 143(2), 513–526. 7. Liedberg, B., Lundstro¨m, I., and Stenberg, E. (1993) Sens. Actuators B 11, 63–72. 8. Hladky, S. B., and Rink, T. J. (1982) in Red Cell Membranes: A Methodological Approach (Ellory, J. C., and Young, J. D., Eds.), pp. 335–358, Academic Press, New York. 9. Melendez, J., Carr, R., Bartholomew, D. U., Kukanskis, K., Elkind, J., Yee, S., Furlong, C., and Woodbury, R. (1996) Sens. Actuators B 35–36, 212–216. 10. Jorgenson, R. C., and Yee, S. S. (1993) Sens. Actuators B 12, 213–220. 11. O’Neill, S. (1999) Rapid Analytical Methods Based on Monitoring Colour Changes, Ph.D. Thesis, Dublin City University, Ireland. 12. Saez de Viteri, F. J., and Diamond, D. (1994) Anal. Commun. 31, 229 –232. 13. Lo¨fås, S., and Johnsson, B. (1990) J. Chem. Soc. Chem. Commun. 21, 1526 –1528. 14. Furlong, C. E., Woodbury, R. G., Yee, S. S., Chinowsky, T., Carr, R., Elkind, J. L., Kukanskis, K. A., Bartholomew, D., and Melendez, J. L. (1996) SPIE 28/36, 208 –215. 15. Texas Instruments (1997) Affinity Analysis, Web site: http// www.ti.com/research/docs/spr/affinity analysis. 16. Hwang, S., Chang, D. J., and Chen, C. (1996) Chem. Eng. J. 61, 171–178. 17. Stamatakis, K., and Tien, C. (1993) AIChE J. 39(8), 1292– 1302. 18. Zydney, A. L., and Colton, C. K. (1984) Chem. Eng. Commun. 30, 191–207. 19. Lokine, M. H., Field, R. W., and Howell, J. A. (1992) Trans. Inst. Chem. Eng. 70(c), 149 –161. 20. Chaplin, H., Jr., and Mollison, P. L. (1952) Blood 7, 1227. 21. Reid, M. E., and Lomas-Francis, C. (1997). The Blood Group Antigen Facts Book, Academic Press, New York.