beneficial alternative for improving the students' education in the Agricultural Machinery course. Keywords. Application technology, Education, Precision ...
DEVELOPMENT AND ASSESSMENT OF A PROTOTYPE AS AN INNOVATIVE METHOD FOR TEACHING AGRICULTURAL MACHINERY M. Pérez‐Ruiz, A. Rodríguez‐Lizana, J. Carballido, J. Agüera, F. Pelegrín
ABSTRACT. An educational variable‐rate application (VRA) sprayer was developed and laboratory tested at the University of Seville (Spain). It was designed and built during 2009 by the undergraduate engineering students in a Precision Agriculture course and used as a teaching model in an Agricultural Machinery course during 2010. The first stage involved mounting all the instrumentation, sensors, and the hydraulic system on a metal platform. The second stage involved mounting a DGPS receiver, flowmeter, automated application control system, and all necessary electrical connections to the platform. Preliminary calibration tests of the equipment at a constant speed of 0.375 m s‐1 (1.35 km h‐1) showed good performance for pressure (kPa) and application rate (L ha‐1) (R2 = 0.998, p < 0.001). To evaluate the teaching method based on the prototype, a short‐answer assessment test was conducted consisting of ten multiple‐choice questions, each with one possible correct answer. Data were analyzed using analysis of variance (ANOVA). The factors were the teaching method (TM), repeated course (R), and attended theory (AT). In addition, the effect of a covariate (number of times a student repeated the course) in the factors was controlled with an analysis of covariance (ANCOVA). The effect of teaching method was significant for the score on the VRA sprayer questions (SPS) variable and the score on the conventional sprayer questions (SCS) variable (p < 0.001 for both). The average success for students using the prototype sprayer was 86%, compared to 60% for those using a conventional sprayer. The total cost of the VRA prototype sprayer was 40% less than the cost of retrofitting a conventional sprayer with precision agriculture equipment. Since the students were engaged in their own learning, they maintained a high level of enthusiasm throughout the course when utilizing the VRA prototype sprayer. It has proved to be a complementary and beneficial alternative for improving the students' education in the Agricultural Machinery course. Keywords. Application technology, Education, Precision agriculture, Teaching models.
S
ince the early 20th century, institutions such as ASABE in North America and CIGR (Commission Internationale du Genie Rural) in Europe have en‐ deavored to further the interest in agricultural engi‐ neering, promote research, improve teaching methods, and better correlate these activities with those of the U.S. and Eu‐ ropean Departments of Agriculture. Nowadays, higher education is experiencing phenomenal improvements as a consequence of new teaching methodologies that have been shown to be more appropriate for the needs of today's stu‐ dents and industry. Improving teaching effectiveness is a stra‐ tegic focus in higher education to nurture innovation
Submitted for review in March 2011 as manuscript number EDU 9123; approved for publication by the Education Division of ASABE in October 2011. The authors are Manuel Pérez‐Ruiz, ASABE Member, Professor, and Antonio Rodríguez‐Lizana, Professor, Department of Aerospace Engineering and Fluid Mechanics, Agro‐forest Engineering, University of Seville, Spain; Jacob Carballido del Rey, Doctoral Student, and Juan Agüera Vega, ASABE Member, Professor, Department of Rural Engineering, ETSI Agrónomos y Montes, University of Cordoba, Spain; and Francisco Pelegrín Sánchez, Professor, Department of Aerospace Engineering and Fluid Mechanics, Agro‐forest Engineering, University of Seville, Spain. Corresponding author: Manuel Pérez‐Ruiz, Department of Aerospace Engineering and Fluid Mechanics, Agro‐forest Engineering, University of Seville, Ctra. Sevilla‐Utrera km 1, Seville 41013, Spain; phone: +34‐955481389; fax: +34‐955481389; e‐mail: manuelperez@us. es.
(Campbell and Colbeck, 1998; Dym et al., 2005). The teach‐ ing of instrumentation, control systems, electronics, and au‐ tomation in the discipline of agricultural engineering has paralleled the engineering developments in agriculture. Dy‐ namometer technology illustrates the developments in agri‐ cultural engineering. Dynamometers apply loads to a running engine, allowing engineers to determine the engine's torque, horsepower, safety, and inefficiencies or failure conditions (Davidson and Chase, 1908). Teachers and researchers are tasked with developing mod‐ ern teaching techniques that instill motivation for learning engineering and applying the progress that occurs in industry, such as technological advances, globalization, etc. A recent study confirmed that students are encouraged to learn by classroom environments that incorporate interaction, discus‐ sion (particularly for higher‐grade point average students), hands‐on activities (particularly for lower‐grade point aver‐ age students), and assignments that demonstrate a clear con‐ nection to their prospective profession (Mankin et al., 2004). Future courses in Agriculture Machinery should not only focus on the transmission of knowledge but also provide tools that allow students to direct their own learning. During the last decade, university programs in agricultural engineering in Europe faced profound challenges, including decreased student enrolment, reduced prestige, and declining funding (Briassoulis et al., 2001; USAEE‐TN, 2006). This challeng‐ ing situation provided the motivation for improving the edu‐ cational methodologies, which will hopefully increase
Transactions of the ASABE Vol. 54(6): 2353-2360
E 2011 American Society of Agricultural and Biological Engineers ISSN 2151-0032
2353
student enrolment, enhance prestige, and increase funding for agricultural engineering universities. Fink (2003) observed that the typical methodology for teaching a course is to generate a list of eight to twelve topics pertaining to the subject and then create lectures for each top‐ ic. The addition of midterm and final exams completes the course. The list of topics may come from the teacher's experi‐ ence with the subject or from the table of contents of a text‐ book. This particular formulation of the course design process has a number of attractive features for teachers (sim‐ ple, rapid, efficient, etc.). However, Fink (2003) argued that this process is based on information organization, which tends to induce superficial learning and often does not precip‐ itate subject retention. As an alternative, collaborative learn‐ ing is effective and convenient when integrated into a course that focuses on the learner. The concept of actively involving the students in using a prototype is to teach innovation and to cement the learning process. Sternberg and Horvath (1995) searched for a middle ground between the current definition‐ al model and the ad hoc model of teaching expertise, which are prevalent in educational research. They argued that a well‐defined standard of teaching expertise, which all ex‐ perts and non‐experts met, does not exist. They then proposed a prototype view that provides a new paradigm of teaching expertise that incorporates standards in which not every ex‐ perienced practitioner is an expert. This allows for variability in the prototype profiles. Their rationale for using a teaching prototype distinguishes teachers who are experts from those who are merely experienced at teaching students. Prototypes clarify a teacher's pedagogical proficiency. The use of prototypes in engineering courses is relatively rare, or at least not a fundamental part of the subject. These courses usually rely on deductive learning by focusing on theoretical aspects of the subject. However, when prototypes are applicable, they facilitate student interest, especially in subjects that involve experimental components, such as agri‐ cultural machinery. Schuguresnsky et al. (2000) involved student participation by building a scale greenhouse. Experi‐ ments were then performed within the model greenhouse rather than in a traditional laboratory. Slocombe et al. (1990) designed a teaching prototype to demonstrate which pesti‐ cide application technology resulted in fewer application er‐ rors. This prototype was included in educational programs to ensure greater operator understanding of application equip‐ ment design and functionality. An important motivation in the use of prototypes is eco‐ nomic. How the prototypes are linked to conventional lecture‐based teaching is therefore important (Wellstead, 1990). The approach should allow greater autonomy for stu‐ dents to carry out tests in subjects that are otherwise ex‐ plained as theory. However, the use of a conventional sprayer with a tractor would require the presence of university staff for safety and security. In addition, agricultural engineering students must also learn the basic components of these de‐ vices (Dickinson et al., 2007). Denson (2005) created a cur‐ riculum development team that prepared drafts of curriculum modules to oversee the design and engineering of a prototype 1/8‐scale model row‐crop tractor, which was used to simulate preventive maintenance and retrofitting activities. This pro‐ totype was implemented in agricultural tractor safety training programs for youth who work in production agriculture in the U.S.
2354
The cost of prototypes in an Agricultural Machinery course can be justified by the acquisition or rental cost of new machinery, the cost of travel to farms, the risk of adverse weather, the rapid improvements in technology, and the diffi‐ culty of using farms not located on campus. In addition, ap‐ plying prototypes in the teaching process facilitates an understanding that is not possible with paper or a computer screen (Ruiz Estrada, 2009) because the teaching process is divided into classroom teaching (theory and problem solv‐ ing) and a practical section. With the addition of prototyping, knowledge, key points, and difficulties can be addressed and resolved immediately. In this way, the students proceed step by step from easy material to difficult concepts, steadily mas‐ tering the course knowledge. There is a base knowledge level for the course. Beyond the basics, the students are encour‐ aged to explore in‐depth knowledge, ask question, analyze, and solve problems to maximize their own potential and im‐ prove their comprehension. The main objectives of this educational experiment were (1) to develop a variable‐rate application (VRA) sprayer pro‐ totype and (2) compare teaching using the prototype with traditional teaching in an Agricultural Machinery course.
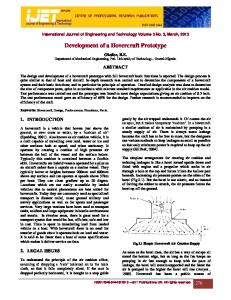
MATERIALS AND METHODS SPRAYER CONSTRUCTION AND CALIBRATION An automatic laboratory sprayer with a 15 L capacity was designed and developed by 20 undergraduate students during a Precision Agriculture and Natural Resource Engineering course. Figure 1 shows the prototype. It consisted of a metal platform on which the instrumentation, sensors, and the com‐ plete hydraulic system were mounted. The sprayer was equipped with a compressed air system (using a bottle of compressed air or inert gas) at pressures ranging from 0 to 500�kPa. The boom was divided into four sections, each con‐ taining one nozzle. The four flat‐fan nozzles (Teejet XR11040, Spraying Systems Co., Wheaton, Ill.) were on 50�cm spacing. Each nozzle was controlled by a solenoid‐ actuated valve (model Masotti, Elttromotori S.R.L., Ischitel‐ la, Italy) that was energized by a 12 VDC source, allowing each boom section to be controlled independently. The sprayer has two configurations: fixed and unfixed. The fixed configuration is for laboratory work. The boom and GPS antenna are detached from the system and travel along a 1.5 m rail to simulate tractor movement while the rest of the system remains stationary. A 12 VDC motor moves the boom and antenna along the rail by driving a pinion and roller chain. A limit switch stops the motor before the boom im‐ pacts the rail's end support. By selecting the pinion diameter, the boom's linear velocity can be regulated. In the unfixed configuration, the boom and GPS antenna are attached to the metal platform and the whole system moves as one unit. The unfixed configuration is used to move the system outside of the laboratory, but only for short distances. In this case, the electric motor no longer moves the boom, and the boom is at‐ tached to the metal platform. An important aspect in both configurations is the GPS antenna position. In the fixed con‐ figuration, the GPS antenna is mounted above the boom, which allows both to be moved by the motor. In the unfixed configuration, both are mounted on the metal platform. A DGPS receiver, flowmeter, fluid control system, ap‐ plication control system (AgGPS EZ‐Boom 2010), and all
TRANSACTIONS OF THE ASABE
(a)
(a)
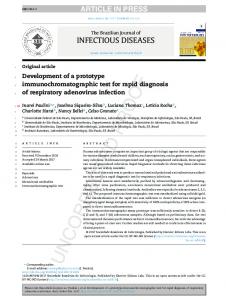
(b) Figure 2. Teaching process for (a) undergraduate students who followed the teaching process with the conventional sprayer and (b) undergradu‐ ate students who followed the teaching process with the VRA sprayer pro‐ totype.
(b) Figure 1. Prototype built for teaching and evaluating the learning process: (a) diagram of the VRA sprayer prototype with two possible locations of the GPS antenna, and (b) components and connections of VRA sprayer prototype.
necessary electrical connections were mounted on the plat‐ form. The EZ‐Boom system (Trimble Navigation Ltd., Sun‐ nyvale, Cal.) automatically controls the individual boom sections to minimize overspray and untreated gaps that may occur on angled end rows, terraces, waterways, and other no‐ spray areas within a field. Further, a geographic information system (GIS) could provide field information such as ap‐ plication maps, field prescription maps, detailed application reports, etc. An assisted manual guidance system (EZ‐Guide
500, Trimble Navigation Ltd.) with the GPS antenna mounted 1.5 m above ground, capable of sub‐meter accuracy, was connected to the sprayer harness to provide position data to the system. After the sprayer was assembled, the flow sensors and nozzles were calibrated following the manufacturers' recom‐ mended procedures. Following calibration, three spraying prescriptions were written using Farm Works (Trimble Navi‐ gation Ltd.) mapping software. Finally, the students' (n = 20) satisfaction was assessed. During the course's final exam, the students were asked to answer an anonymous question (ques‐ tion Q1 in table 1) to determine their opinion regarding the suitability of the prototype equipment as a learning tool. AGRICULTURAL MACHINERY COURSE AND EXPERIMENTAL DESIGN The VRA sprayer prototype was introduced as a teaching tool in an Agricultural Machinery course during the fall of 2010. This course was divided into two sections: classroom
Table 1. Student questions for the Precision Agriculture and Natural Resource Engineering course and the Agricultural Machinery course after the prototype development activity. Question Q1
Percent
No. of Answers
a) Yes, it provides a practical focus to the course.
35
7
b) Yes, but I believe the time and effort spent is is very high and may not compensate.
40
8
c) No, it's something that I can learn easily in the future when I leave the university.
10
3
d) No, I get the same education with a conventional sprayer attached to a tractor.
15
2
Question
Possible Answers
Do you consider that the development of the VRA sprayer prototype has been helpful for your education in Precision Agriculture and Natural Resource Engineering?
e) Don't know/didn't answer Q2
Do you think it is interesting to add the use of prototypes as teaching models to improve the teaching quality?
Vol. 54(6): 2353-2360
0
0
a) Yes
70.4
50
b) No
18.3
13
c) Don't know/didn't answer
11.3
8
2355
teaching (theory and exercises) and laboratory teaching (ap‐ plication of agricultural equipment) (fig. 2). The laboratory teaching section displays, describes, and demonstrates agri‐ cultural machines. Currently, the students in the Agricultural Machinery course form four main groups (A, B, C, D). There are also two practice subgroups per main group, making a total of eight subgroups (A1, A2, B1, B2, C1, C2, D1, D2) of between 14 and 17 students each. The total number of Agricultural Ma‐ chinery students for 2009‐2010 was 124. When testing a sprayer (laboratory teaching), each of the subgroups was ran‐ domly divided in half. The first half used the VRA prototype sprayer (PS), while the rest of students used a conventional hydraulic sprayer mounted on a tractor (CS). All of the sub‐ groups had received theoretical training on this type of ma‐ chinery a week earlier. To standardize the students' theoretical training, the three professors of the subject had agreed on the material and visual resources used during the course. After the laboratory teaching, a short‐answer assessment test was conducted consisting of ten multiple‐choice ques‐ tions, each with one possible correct answer (see Appendix). To determine any difference in learning between the proto‐ type and conventional sprayer subgroups, the instructors as‐ signed the following mutually exclusive classifications to the questions: five questions related to theory, two questions re‐ lated to the conventional sprayer, and three questions related to the VRA sprayer prototype. To avoid carry‐over effects, the short‐answer assessment test maintained the proportions indicated above but contained different questions for the eight subgroups. In addition, to assess the level of student sat‐ isfaction with the prototype a week after the laboratory teach‐ ing, a survey question was asked (question Q2 in table 1). The students answered voluntarily and anonymously. The WebCT platform (Blackboard, Inc., Washington, D.C.) was used to administer the questions. This was particularly useful during the optional survey questions. STATISTICAL ANALYSIS For data analysis, univariate factorial analysis of variance (ANOVA) and covariance (ANCOVA) were performed. Three fixed factors in a completely randomized design were used. The factors were the teaching method (TM), attended theory (AT), and repeated (R). Each design factor had two levels (yes and no). The variable “repeated” refers to the students who retook the course. Students who obtain a score of 5 (maximum of 10) or higher cannot repeat the course. Those with a score below 5 must repeat the course since the subject matter was not ade‐ quately learned. At the University of Seville, this subject matter is divided into a theoretical and a practical course. The university stated that attendance was voluntary for the theoretical course and mandatory for practical course. There‐ fore, some students attended both the theoretical and practi‐ cal course, while others attended only the practical course. The model‐dependent variables were the score on theory questions (ST), the score on VRA sprayer questions (SPS), the score on conventional sprayer questions (SCS), and the overall score on the short‐answer assessment test (SSA). Scores on the different variables ranged from 0 to 5 (ST), 0 to 3 (SPS), 0 to 2 (SCS), and 0 to 9 (SSA). The SSA was ob‐ tained as:
2356
SSA = ST +
2 SPS + SCS 3
(1)
When it was not possible to comply with the terms of this type of model, robust ANOVA was carried out to verify the initial results obtained by classical ANOVA. In this case, the null hypothesis of equal 0.1‐trimmed means was contrasted. Differences between means in the ANOVA and ANCOVA models were performed using least significant difference test (a = 0.05) for the classical models and the Yuen‐Welch test (Yuen, 1974) for robust models. The homogeneity of vari‐ ances was tested using the Levene test, and normality was tested using the Shapiro‐Wilk test. Analyses were performed with IBM SPSS Statistics 19 and R software.
RESULTS AND DISCUSSION An automatic VRA sprayer, which used a GPS prescrip‐ tion map to determine its geospatial position and control the spray valves in the field, was successfully developed and op‐ erated in a workshop at the University of Seville as part of a Precision Agriculture and Natural Resource Engineering course. The system was specifically designed to optimize the spray application according to information regarding crop type. It was also used to assess a prototype‐based method of teaching and learning in an Agricultural Machinery course. The prototype was coordinated with other research projects (Dickinson et al., 2007; Ma et al., 2010). Once all the components were assembled on the mobile platform, the sprayer was tested in the workshop by simulat‐ ing situations that might occur in practice. The component systems included mechanics (stability of the boom, hose length, etc.) and electric (cables, voltage levels, power, com‐ munication equipment, etc.). Preliminary equipment calibra‐ tion tests were performed at a constant speed of 0.375 m s‐1 (1.35 km h‐1). These tests demonstrated good performance based on the coefficient of determination (R2) for pressure (kPa) and application rate (L ha‐1) measurements. In all three trials, a value close to 1 was obtained (R2 = 0.9984, 0.9988, and 0.9992). This shows that the nearly 100% of the dose variation can be explained by pressure. For calibration, the Salyani and Serdynski (1993) methodology was employed. The educational benefits centered on issues of understand‐ ing and operating the equipment, integrating multiple technology systems, developing laboratory tests, collecting and managing agronomic data, and managing real‐time field challenges. In these aspects, no quantifiable results were evi‐ dent. However, the instructors found the process to be a pow‐ erful learning experience. In the Precision Agriculture and Natural Resource Engi‐ neering course, response frequencies for the anonymous sur‐ vey question (question Q1 in table 1) were 35% (a), 40% (b), 10% (c), 15% (d), and 0% (e). In general, students who built the prototype under the guidance of a teacher were satisfied with the experience, as evidenced by the 75% positive an‐ swers for Q1. The percentage of satisfied students is in agree‐ ment with results obtained by Díaz‐Lantada et al. (2007) in a study of teaching applications for rapid prototyping technologies. It is also noteworthy that 40% of the students indicated that building the prototype was time intensive. In the research conducted by Díaz‐Lantada et al. (2007), the av‐ erage score on the student questionnaires reflected that stu-
TRANSACTIONS OF THE ASABE
Table 2. Frequencies of combinations of the factors considered in the study.[a] Teaching Attended Percent Model (TM) Theory (AT) of Total Repeated CS
PS
[a]
Table 4. Average scores in questions about theory, the VRA sprayer prototype, the conventional sprayer, and the final scores.[a] VRA Conv. Theory Final Prototype Sprayer Score Score Score Score (ST)[c] (SSA)[f] Factors and Levels[b] (SPS)[d] (SCS)[e]
N
No
No Yes
3.23 6.45
4 8
Yes
No Yes
21.77 21.77
27 27
No
No Yes
4.84 3.23
6 4
Yes
No Yes
17.74 20.97
22 26
[a]
CS = conventional sprayer, PS = prototype sprayer, and N = number of undergraduate students.
[b]
dents had to devote excessive time to the project. Activities of this type are not common in courses and may require extra effort because the students are accustomed to receiving a fixed agenda for courses. However, the experience was posi‐ tive. For students who are comfortable with experimentation and hand work, the construction process can be quite stimu‐ lating, whereas those who prefer more theoretical approaches can use the prototype to demonstrate how theoretical prin‐ ciples work in real situations (Torres, 2011), as we did in the simulations of flow and pressure relationships. In addition, only 10% of the students indicated that the development of the prototype was an experience that could easily be learned outside the university. One of the goals of education is to help students make sense of what they learn (Bransford and Schwartz, 1999), and the construction of this prototype is a clear example of this. With respect to the Agricultural Machinery course, the frequency distribution of the groups formed by combinations of the study factors is shown in table 2. Analysis of the data indicated that the covariate of the number of times a student repeated the course was not significant in any model. The p‐values equal 0.485 (ST), 0.994 (SPS), 0.954 (SCS), and 0.569 (SSA) (ANCOVA values are not shown). The TM factor was not significant in the dependent variable ST (table 3) since the theory questions did not directly relate. Nor was significance detected in the SSA analysis. This is rea‐ sonable since 50% of the short‐answer test score came from theory (ST). In contrast, the SPS and SCS variables were signifi‐ cantly influenced by TM (p < 0.001). Undergraduate students assigned to one or another method of sprayer learning re‐ sponded better to one or another subset of test questions directly related to their experience. This, together with the fact that the average short‐answer assessment scores were very similar (4.99 and 4.97, see table 4), leads us to believe that both methods are complementary rather than substitutes.
[c] [d] [e] [f]
TM
CS VRA
2.48 a 2.76 a
1.81 a 2.59 b
1.33 a 0.53 b
4.99 a 4.97 a
R
Yes No
2.77 a 2.43 a
2.38 a 1.97 a
1.09 a 0.81 a
5.46 a 4.51 b
AT
Yes No
2.59 a 2.68 a
2.14 a 2.36 a
0.94 a 1.00 a
4.91 a 5.32 a
Values followed by different letters within each column and factor are statistically different at the indicated p‐value in table 3. TM = teaching method, CS = conventional sprayer, VRA = variable‐ rate application, R = repeated, and AT = attended theory. Score of 0 to 5. Score of 0 to 3. Score of 0 to 2. Score of 0 to 9.
The scores obtained by students, as shown in table 4, can‐ not be classified as high in the ST variable. The scores of 2.48 and 2.76 points out of 5 are equivalent to 5.0 and 5.5 points out of 10, which are known in Spain as “sufficient.” Similar‐ ly, the SSA variable scores of 4.99 and 4.97 points out of 9 with the CS and VRA teaching models, respectively, are also “sufficient.” The rating of “sufficient” in questions on theory, with that variable being 50% of the questionnaire, had great influence on the final (SSA) score. Regarding the SPS and SCS variables, the ratings are more acceptable. For SPS, the students scored 1.81 and 2.59 out of 3 points, for a success rate of 60% and 86%, respectively, while for SCS, which is scored on a scale of 0 to 2, the success rates are 66% and 26% depending on the teaching method. According to our experi‐ ence, these results are not atypical, considering that the test was conducted with students from various courses in the De‐ partment of Agriculture. Students generally do not study theory diligently. In our view, four aspects are involved in all teaching pro‐ cesses, regardless of whether the teaching is effective or inef‐ fective, traditional or innovative: all teachers require knowledge of the course material, make decisions about the course design, interact with students, and manage course ac‐ tivities. This view implies that teachers who desire to im‐ prove their teaching abilities can do so by improving their competence in one or more of these four teaching fundamen‐ tals. Improving any of these teaching aspects facilitates an in‐ crease in the overall scores upon the post‐test for the following year.
Table 3. Robust analysis of variance for scores in questions about theory (ST), the VRA sprayer prototype (SPS), the conventional sprayer (SCS), and the final scores (SSA). Theory Score VRA Prototype Conventional Sprayer (ST) Score (SPS) Score (SCS) Sources of Variation Teaching method (TM) Repeated (R) Attended theory (AT) TM × R TM × AT AT × R TM × AT × R
Vol. 54(6): 2353-2360
df 1 1 1 1 1 1 1
Final Score (SSA)
F
p
F
p
F
p
F
p
1.80 3.40 0.03 0.67 0.20 0.83 0.07
0.207 0.092 0.865 0.432 0.660 0.381 0.797
17.64 3.82 0.21 0.59 0.26 0.03 0.05