SAMPLING
Development and Comparison of Intensive and Extensive Sampling Methods and Preliminary Within-Tree Population Estimates of Red Oak Borer (Coleoptera: Cerambycidae) in the Ozark Mountains of Arkansas M. K. FIERKE,1 D. L. KINNEY, V. B. SALISBURY, D. J. CROOK,
AND
F. M. STEPHEN
Department of Entomology, University of Arkansas, AGRI 319, Fayetteville, AR 72702
Environ. Entomol. 34(1): 184Ð192 (2005)
ABSTRACT Populations of red oak borer, Enaphalodes rufulus (Haldeman), a native wood-boring beetle, seem to be at unprecedented levels that are coinciding with extensive oak mortality occurring in the Ozark Mountains of Arkansas, Oklahoma, and Missouri. To quantify population levels, we developed intensive and extensive sampling methods with respect to the seasonal phenology of active and quiescent stages of the borerÕs synchronous 2-yr life cycle. Intensive whole-tree sampling yields data for the entire infested tree bole and provides baseline data for development of less timeconsuming sampling methods. Extensive partial-tree sampling uses a nine-sample proportional sampling scheme to estimate densities, which are extrapolated to the whole tree. Data comparison reveals extensive estimates and intensive data are not signiÞcantly different, thus verifying extensive sampling as a relatively accurate and acceptable sampling method. Preliminary data from 58 trees conÞrm epidemic population levels in three areas of the Ozark National Forest in northern Arkansas. Mean number of phloem galleries initiated by current generation larvae on 38 trees was 599 ⫾ 50 (SE) per tree, average number of live red oak borer found in 57 trees was 77 ⫾ 15 per tree, and mean number of previous generation heartwood galleries present in 38 trees was 185 ⫾ 30. Data generated through this research will permit detailed studies of red oak borer biology and mortality, facilitate development of less time-consuming Þeld sampling techniques, and set the stage for further study of factors contributing to the current outbreak and associated tree mortality. KEY WORDS Enaphalodes rufulus, Cerambycidae, native insect pest, insect sampling, Quercus
OAK-HICKORY FORESTS OF the Ozark Plateau of northern and central Arkansas, eastern Oklahoma, and southern Missouri are currently experiencing an oak decline event with concurrent mortality to thousands of red oak trees (Starkey et al. 2000). Oak-hickory forests comprise up to 67%, ⬇6.5 million hectares of the forested area of the Ozark-Ouchita Highlands, and ⬇25% of the live tree and sawtimber volume is red oak (U.S. Dep. Agric. FS 1999). Apart from harmful economic effects on the local timber industry, widespread oak mortality in the Ozark Highlands may also have severe ecological consequences because of red oaks being a signiÞcant mast (acorn) producer for wildlife (Kirkpatrick and Pekins 2002). Public safety is also an important issue because of branches and dead trees falling along camping areas, hiking footpaths, and roadways (Starkey et al. 2000). Manion (1991) described forest decline syndromes in terms of predisposing, inciting, and contributing factors. Predisposing factors include tree genotype and age, prolonged drought, and low site quality, e.g., 1
Corresponding author, e-mail mÞ
[email protected].
poor soils. Acute short-term drought stress, late frost, and defoliation are considered inciting factors, whereas contributing factors include boring from secondary insects, root diseases, and cankers. Oak decline or similar events have been described in most eastern states including the Ozarks (Tryon and True 1958, Mistretta et al. 1981, Yeiser and Burnett 1982, Tainter et al. 1984). The current oak decline event seems to be unique because it is associated with an unprecedented outbreak of a native long-horned wood-boring beetle, the red oak borer Enaphalodes rufulus (Haldeman) (Coleoptera: Cerambycidae). Red oak borer is found across the eastern United States and has been considered a minor pest of oaks, seldom causing tree mortality. Historically average populations were estimated at much less than one larva per tree, with survival and emergence of one beetle per tree indicating a severe infestation (Hay 1974). Early observations and preliminary studies revealed red oak borer population densities in the Ozark National Forest far exceeding HayÕs severe infestation estimates (Stephen et al. 2001).
0046-225X/05/0184Ð0192$04.00/0 䉷 2005 Entomological Society of America
February 2005
FIERKE ET AL.: RED OAK BORER SAMPLING
Intensive examination of the entire infested surface of trees is a natural starting point for quantitative studies to deÞne factors responsible for an insect outbreak (DeMars 1970, Pulley et al. 1977, Nebeker et al. 1978). Intensive sampling permits description of within-tree insect population densities and distributions, mortality estimates, occurrence of predators, parasites, and other associates, and construction of life tables (Southwood and Henderson 2000). During initial population studies of this outbreak, we determined that intensive sampling of the entire infested bole would ensure “oversampling” or collection of sufÞcient data to allow for a great degree of precision (Coulson et al. 1975). Information derived from intensively sampled trees can also be used for developing other less intensive sampling techniques (Pulley et al. 1977). Development of extensive sampling methods can minimize sampling effort in individual habitats, thus permitting a greater sampling effort over a larger geographic area (Southwood and Henderson 2000). Coulson et al. (1975) suggest use of a proportional extensive sampling scheme for sampling within-tree southern pine beetle populations. This type of stratiÞed sampling is superior to simple random sampling because it provides better precision at less cost than either random sampling or stratiÞed random sampling (Pulley et al. 1977, Nebeker et al. 1978). The primary objectives of this research were to develop intensive and extensive sampling methods, to assess in detail within-tree populations of red oak borer, and to compare extensive estimates to intensive counts to determine if extensive methods provide acceptably accurate estimates of within-tree populations. We also present initial results of within-tree red oak borer populations using intensive and extensive sampling and describe the life cycle, larval characteristics, and biology of red oak borer in northern Arkansas. We anticipate that techniques described here may serve as a foundation for development of a rapid survey method that will provide current and predictive estimates of area-wide population levels, damage, and landscape-level distribution. Data from this research will be critical in understanding what factors triggered the current outbreak and predicting where outbreaks might occur in the future and how long high populations will persist.
185
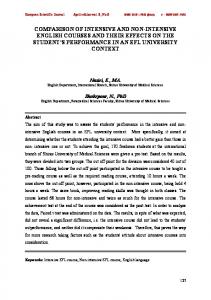
Fig. 1. Diagram of the red oak borer life cycle observed from August 2001 to August 2003. Divisions within the red oak borer life cycle require development of distinct sampling methods.
northern Arkansas red and white oak hosts. Adults emerge, mate, and oviposit in June and July of oddnumbered years. After emergence, activity is mostly nocturnal (Donley 1978). Females oviposit an average of 119 eggs, predominantly in bark crevices, but also under vines or lichens (Donley 1978). Eggs hatch in ⬍2 wk (Solomon 1995), and larvae bore through the bark surface, forming small attack holes (Fig. 2). Larvae then spend 4 mo actively feeding in phloem tissue and forming small feeding galleries until mid-November (Active 1; Fig. 3). They over-winter in these galleries until the following spring (Quiescence 1). In June of even-numbered years, larvae chew out of old phloem galleries, which have become darkened and necrotic, and form second-year feeding galleries in
Materials and Methods Life Cycle. The red oak borerÕs unique life cycle necessitates carefully timed, distinct sampling methods for the different periods of activity and quiescence (Fig. 1). Red oak borer exhibits a synchronous 2-yr life cycle in northern red oak, Quercus rubra L., black oak, Q. veluntina Lam., scarlet oak, Q. coccinea Muenchh., and white oak, Q. alba L., in Kentucky and Ohio, with adult emergence occurring only in odd numbered years (Hay 1969, Galford 1983). Passive and active trapping, Þeld observations, and dissection of red oak borerÐinfested trees, (1999 Ð2004) conÞrm that red oak borer also display a synchronous 2-yr life cycle in
Fig. 2. Red oak borer attack sites on the bark surface of northern red oak. Attack sites are typically crescent or oval shaped and are enlarged throughout the life cycle for frass expulsion.
186
ENVIRONMENTAL ENTOMOLOGY
Vol. 34, no. 1
Fig. 3. Typical Þrst-year larva and phloem feeding gallery revealed by outer bark removal in a northern red oak. Gallery surface area is ⬇3 cm2.
phloem and sapwood (Active 2; Fig. 4). Simultaneously, they also chew into the heartwood, forming 15Ð25 cm vertical tunnels (Fig. 5). In the second year, larvae overwinter from November to June in heartwood galleries protected with a frass plug
Fig. 5. Red oak borer heartwood gallery in a northern red oak. Heartwood galleries are associated with second-year feeding galleries and serve as overwintering and pupation chambers.
Fig. 4. Second-year feeding gallery and entrance to heartwood gallery (indicated by arrow) formed in the second year in a northern red oak. Gallery surface area is ⬇10 cm2.
(Quiescence 2). In June of the second year (oddnumbered), larvae again become active, pupating and emerging through large exit holes in the bark surface in June and July (Active 3; Fig. 6). Sample Trees. Fifty-eight northern red oaks, 2 white oaks, and 1 black oak were harvested from three areas in the Ozark National Forest, AR. Trees, representing a continuum of tree health based on crown condition, were chosen for sampling using two criteria: evidence of current red oak borer infestation and opportunity to safely fell the tree. Tree diameter at breast height (dbh), crown condition, and number of emergence holes below 2 m were recorded before felling. To retain information on cardinal directions, due north was marked on each tree before felling. After felling,
February 2005
FIERKE ET AL.: RED OAK BORER SAMPLING
Fig. 6. Red oak borer bark emergence site on a northern red oak. Emergence holes are typically round or ovoid and ⬃1 cm in diameter. In red oak borer infestations, holes of this size and shape are associated with galleries formed by previously emerged adult red oak borer.
total tree height and height of infested bole were measured, and a chainsaw was used to cut a north line along the entire length of the infested bole. Trees were cut into 0.5 m sample units from 0.5 m above the ground to the highest point of active infestation. Sample unit lengths of 0.5 m were the most practical and manageable size for handling and dissection. Sample units were labeled using a black permanent marker to indicate forest plot, tree number, and sample location on tree bole (top or bottom in relation to, and numbered sequentially from, tree base). Sample units were transported to the laboratory, where all lichen and moss were removed using a 152 mm coarse wire wheel mounted to a reversing hand drill. Sample units were stored at 5⬚C to suspend red oak borer development. Tree age was determined in the laboratory by counting annual rings on an ⬇8-cm-thick transverse section cut from the base of the tree. Tree age ranged from 50 to 105 yr, height from 14.5 to 23.5 m, and dbh from 18 to 38 cm. Northern red oaks were felled between January 2002 and June 2003. This time period encompasses the life cycle of red oak borer from the Þrst quiescent larval stage (Q1) until adult emergence. One white oak was harvested during the second quiescent stage (Q2) in April 2003. Another white oak and a black oak were felled during the third active stage (A3) just before adult emergence in June 2003 to compare densities of late-stage surviving red oak borer in these oak species. Intensive Sampling. Twenty-four of the 58 northern red oaks, the 2 white oaks, and the black oak were dissected based on the red oak borerÕs life cycle (Fig. 1). Samples were removed from cold storage, and all attack and emergence holes were mapped and counted. First-year sampling methods were used during the Þrst active period (A1) and Þrst quiescent period (Q1), from August to May of even-numbered years. Second-year sampling methods were used from June to adult emergence in the following odd-num-
187
bered year. This time period encompasses the second active period (A2), the second quiescent period (Q2), and the third active period (A3). Bark Mapping. Red oak borer larval attack holes and previous generation adult emergence holes on the bark surface were identiÞed (Donley and Terry 1977, Solomon 1995) (Figs. 2 and 6), counted, and marked using colored grease pencils. Locations of attack or emergence holes were recorded using distance from base of the sample unit (rise) and distance to the right of the line indicating north (run). Mapping was done in this manner to permit exploration of spatial patterns of attack and survival and to provide basic information for subsequent work on host selection, adult behavior, and population dynamics (Shepherd 1965). Bark mapping methods remained constant throughout the life cycle. Subsequent dissection methodology, however, was dependent on life stage being sampled. First-Year Sampling Methods. In northern Arkansas, in late summer and fall of odd-numbered years, red oak borer larvae form feeding galleries by actively foraging in tree phloem from the time of initial larval attack to November (Fig. 3). Larvae remain in these “Þrst-year galleries” in a quiescent state until June of the following even-numbered year. To expose these galleries, sample units were placed in handmade wooden cradles and outer bark was removed using a drawknife with a straight 25 cm blade. Location of galleries and phloem surface area foraged was recorded and removal of bark and live tissue continued until larval presence was established. Live larvae were placed between petri dishes to limit movement and allow measurement of larval length and head capsule width to the nearest millimeter using calipers. Other insects found in galleries and larval remains were also noted. Second-Year Sampling Methods. In even-numbered years, from mid- to late June until November, larvae become active and form second-year galleries within living tree tissues, phloem, cambium, and xylem (Fig. 4). During this time, they simultaneously excavate heartwood galleries in which they will overwinter. To expose both Þrst- and second-year galleries, outer bark was removed as described above. First-year galleries in which larvae did not survive were noted. Further tissue removal revealed second-year galleries and heartwood-gallery entrance holes. Location and area foraged were noted. Sample bolts were split using a 26 ton log splitter to determine presence or absence of live red oak borer larvae, pupae, or adults in heartwood galleries (Fig. 5). Larval location, second year or heartwood gallery, length, and head capsule width were recorded. Previous Generation Gallery Dissection. On removal of all bark, with both Þrst- and second-year dissection methods, and before splitting, heartwood galleries formed by previous generations of red oak borer were identiÞed (Fig. 7A). During the Þrst year of the red oak borer life cycle, current generation galleries were located on the surface, so all heartwood galleries present were formed by previous generations. Distinguishing between current and previous
188
ENVIRONMENTAL ENTOMOLOGY
Vol. 34, no. 1
phloem by the current generation of larvae), live red oak borers, and previous generation galleries. Four trees were completely mapped and split, providing numbers of attack holes, live red oak borers, and emergence holes. Thirteen trees, including the black oak and white oak, were examined for emergence holes and split, yielding number of emergence holes and live red oak borers. Extensive Sampling. Thirty-four of the 58 northern red oaks were sampled using extensive sampling methods. Extensive sampling incorporates intensive dissection techniques using nine 0.5-m sample units taken proportionally from the tree bole. The Þrst sample unit was at 1.5Ð2.0 m above ground. This sample unit was always dissected to enable correlations of within-tree data with Þeld-collected information that could be recorded by an observer on the ground. Eight additional sample units were collected proportionally, with samples located at 10% increments from 10 to 90% to the upper limit of the infested bole. Data Analysis. Using the nine-sample proportional scheme described above, an extensive data set was derived for each red oak borer population variable from each of the 24 intensively sampled trees. This extensive data set was compared with intensive data. For these comparisons, all data were summarized and presented on a per square meter basis. Extensively sampled tree data were extrapolated to the whole tree by calculating tree surface area based on a frustum of a cone equation: SA ⫽ ⫻ (r1 ⫹ r2) ⫻
Fig. 7. Previous generation gallery dissection: (A) after bark and phloem removal and (B) after chiseling to reveal previous generation red oak borer galleries.
generation galleries was more difÞcult during the second year. Decay, discoloration, scar tissue, and depth of gallery relative to living tree tissues helped to classify galleries. Previous generation galleries were often partially or completely covered with scar tissue, resulting in an obvious bulge after removal of outer bark and phloem. Scar tissue was removed using a hammer and chisel to determine if bulges were attributable to red oak borer (Fig. 7B). Location and gallery area foraged was recorded. It was not possible to measure all variables on all sampled trees because of time-dependent aspects of the insectsÕ life cycle, method development, and time constraints. Eight northern red oaks and one white oak were completely mapped and dissected, providing counts of attack holes, emergence holes, current generation galleries (galleries successfully initiated in the
冑 ((r1 ⫹ r2)2 ⫹ h2)
where SA is surface area of the infested tree bole, r1 is the radius at the base of the tree bole, r2 is the radius of the ninth sample unit taken from the tree, and h is the height of infested bole. This equation was validated by comparing calculated tree surface area estimates to actual intensive tree surface area measurements. Statistical analyses were completed in JMP 5.1 (SAS Institute 2004). Matched pair analysis using paired t-tests was used to compare sampling techniques and determine if intensive data and extensive estimates were statistically different. Percent bias was calculated as percent difference between intensive data and extensive estimates for each parameter of interest. Bias provides information on how much extensive estimates either over- or underestimate true values provided by intensive sampling of whole trees. Correlations between tree and red oak borer population variables were assessed using linear regression analysis, in separate models, with red oak borer population variables, attack holes, current generation galleries, live larvae, emergence holes, and previous generation galleries as dependent variables and tree variables, tree dbh, age, and height as independent variables. Results Intensive/Extensive Comparison. Extensive sampling yielded density estimates that were consistently close to true values derived from intensive sampling of
February 2005 Table 1.
Life stage Q1 Q1 Q1 Q1 Q1 A2 A2 Q2 Q2 Q2 Q2 Q2 Q2 A3 A3 A3 A3 A3 A3 A3 A3 A3 A3 A3 Mean Mean bias t df P
FIERKE ET AL.: RED OAK BORER SAMPLING
189
Intensive density data and extensive density estimates of red oak borer pop variables in 24 northern red oaks Attacks/m2
Current generation/ m2
Live ROB/m2
Emergence/m2
Previous generation/m2
Intensive
Extensive
Intensive
Extensive
Intensive
Extensive
Intensive
Extensive
Intensive
Extensive
274.1 41.2 181.6 328.9 112.0 320.5 142.5 378.2 63.9 112.5 61.1 9.6 58.7 Ñ Ñ Ñ Ñ Ñ Ñ Ñ Ñ Ñ Ñ Ñ 160.4
297.1 49.3 209.8 361.3 103.9 343.1 129.8 387.7 37.5 123.9 64.6 10.8 69.9 Ñ Ñ Ñ Ñ Ñ Ñ Ñ Ñ Ñ Ñ Ñ 168.3
Ñ 31.4 69.4 81.6 58.2 60.3 84.7 Ñ 26.3 Ñ 31.1 Ñ Ñ Ñ Ñ Ñ Ñ Ñ Ñ Ñ Ñ Ñ Ñ Ñ 55.54
Ñ 31.0 61.9 82.8 52.6 66.1 83.1 Ñ 18.2 Ñ 37.1 Ñ Ñ Ñ Ñ Ñ Ñ Ñ Ñ Ñ Ñ Ñ Ñ Ñ 54.1
Ñ 12.7 50.0 51.4 26.0 4.9 9.4 8.6 5.5 1.1 0.8 0.2 0.0 2.6 1.7 3.7 10.5 2.2 5.5 6.1 10.3 1.5 8.3 7.5 10.0
Ñ 9.7 40.2 49.4 22.2 5.6 10.4 10.2 5.4 1.5 1.0 0.0 0.0 3.6 1.6 4.4 7.4 2.3 8.0 6.6 8.9 0.3 8.9 4.0 9.2
58.2 1.1 22.7 32.8 4.4 11.4 3.4 5.7 1.1 3.0 3.5 0.0 3.7 2.9 5.7 8.6 4.0 1.3 18.0 14.4 31.5 21.9 17.9 22.0 12.5
57.0 0.0 19.6 34.2 6.8 14.5 4.3 3.1 0.0 4.1 1.4 0.0 4.3 3.6 6.0 8.2 4.8 1.2 18.8 13.5 34.0 22.6 18.3 18.4 12.4
66.3 0.78 28.9 36.3 2.67 8.12 3.06 Ñ 1.05 Ñ 3.39 Ñ Ñ Ñ Ñ Ñ Ñ Ñ Ñ Ñ Ñ Ñ Ñ Ñ 16.7
65.4 0.67 24.1 37.3 3.85 8.47 2.67 Ñ 0.68 Ñ 3.82 Ñ Ñ Ñ Ñ Ñ Ñ Ñ Ñ Ñ Ñ Ñ Ñ Ñ 16.3
4.0% 1.71 12 0.1128
⫺3.0% ⫺0.661 7 0.5299
⫺4.4% ⫺1.54 22 0.1378
⫺5.2% ⫺0.0598 23 0.9528
⫺1.9% ⫺0.695 8 0.5067
Life stage indicates the red oak borer life cycle period when the tree was felled. Q1, Þrst quiescent period; A2, second active period in even-numbered years; Q2, second quiescent period; A3, third active period prior to adult emergence in odd-numbered years. Mean percent bias quantiÞes how much extensive estimates over- or underestimate intensive data. Paired t-test results are given and indicate no signiÞcant difference in data derived from intensive and extensive sampling techniques.
24 northern red oaks (Table 1). Extensive estimates for attack holes on 13 trees are comparable to intensive data with extensive sampling overestimating real values, with an average positive bias of 4.0%. Current generation gallery counts for a tree represent the sum of all galleries initiated by red oak borer larvae in the current generation. This population variable was measured along the entire infested bole of eight trees. Extensive estimates are comparable with intensive data, with extensive sampling on average underestimating real values with a negative bias of 3.0%. Numbers of live red oak borers were measured along the entire infested bole of 23 trees. Extensive estimates are comparable with intensive data, with extensive sampling underestimating real values with an average negative bias of 4.4%. Extensive estimates of emergence hole density on 24 trees were comparable with intensive data with extensive sampling, on average, underestimating real values with a negative bias of 5.2%. Heartwood galleries formed by previous generations were sampled along the entire infested bole of nine trees and on average extensive sampling underestimated real values with a negative average bias of 1.9%. Paired t-tests revealed no signiÞcant difference between intensive and extensive sampling for the variables measured (Table 1).
Red Oak Borer Population Data. Intensive sampling yielded data on a whole tree basis and extensive sampling data were extrapolated to the whole tree using calculated tree surface areas. Calculated whole tree surface area estimates had an average bias of ⫺2.7% compared with actual surface areas measured with intensive sampling. Paired t-tests revealed no signiÞcant difference between calculated and real surface area values (t ⫽ 1.36, df ⫽ 23, P ⫽ 0.1872). Attack holes mapped on the bark surface of 47 trees ranged from 371 to 5,041 (mean, 2,249 ⫾ 177 SE). Current generation galleries found in 38 trees ranged from 142 to 1,244 per tree (mean, 599 ⫾ 50). Live red oak borer from 57 trees, across all life periods, ranged from 0 to 577 per tree (mean, 77 ⫾ 15). Emergence holes on the bark surface ranged from 7 to 694 on 58 trees (mean, 173 ⫾ 18). Previous generation gallery numbers from 38 trees ranged from 7 to 790 (mean, 185 ⫾ 30). Linear regression analysis of whole tree data revealed signiÞcant correlations at ␣ ⫽ 0.05 between tree dbh and attack holes (t ⫽ 3.4; df ⫽ 46; P ⫽ 0.0014), current generation galleries (t ⫽ 3.23; df ⫽ 37; P ⫽ 0.0026), emergence holes (t ⫽ 2.67; df ⫽ 57; P ⫽ 0.0098), and previous generation galleries (t ⫽ 2.18; df ⫽ 37; P ⫽ 0.0355). Tree age was signiÞcantly cor-
190
ENVIRONMENTAL ENTOMOLOGY
related with number of attacks (t ⫽ 3.48; df ⫽ 40; P ⫽ 0.0012). Tree height was not signiÞcantly correlated with any red oak borer population variables. Statistical analysis of density (per square meter) of measured population variables resulted in one signiÞcant relationship between tree age and attacks (t ⫽ 2.97; df ⫽ 40; P ⫽ 0.0051). Intensive sampling of two white oaks and a black oak revealed population numbers similar to those found in northern red oak. One of the white oaks was completely mapped and dissected during the Q1 life period and had 3,114 attacks, 1,242 current generation galleries, 8 live red oak borers, and 28 previous generation galleries. The second white oak and black oak were examined for emergence holes and split for live red oak borers during the A3 life period. The white oak had 38 live red oak borers and 68 emergence holes. The black oak had 83 live red oak borers and 49 emergence holes. Discussion Potential or realized fecundity is a preferred starting point for mortality analysis and development of life tables (Pedigo 1996). Initially, we anticipated being able to quantify egg numbers in the Þeld because laboratory rearing of larvae was not difÞcult and eggs were relatively large (⬎5 mm). However, after Þeld examination of several trees, up to 5 m on the bole, in different areas during the oviposition period and nocturnal observations of ovipositing females, we found that the cryptic nature of egg placement prohibited use of egg data as a starting point. Red oak borer attack holes (Fig. 2) have a distinct size and shape that distinguish them from other possible insect damage on the surface of trees (Hay 1969, Solomon 1995). Attack holes would therefore be the next logical choice for a starting point to establish red oak borer baseline mortality rates because they are early evidence of egg survival. A major drawback to using attack holes is that laboratory and Þeld observations indicate that some may be relics from previous generation attacks. In some instances, removal of outer bark revealed either scar tissue or smooth phloem tissue underlying attack holes. This indicates that the attack holes were associated with a previous generation attack that was in the process of scarring over or that the attacks were superÞcial phloem injuries that healed over internally leaving little or no trace. Field observations of marked attack holes over 2 yr further support the conclusion that attack holes are cumulative because they remain observable and neither slough off nor heal over. First-year phloem galleries thus seem to be the earliest starting point for red oak borer mortality analysis because they are just under the bark surface and are easily recognizable, even late into the second year of larval development. This allows division of mortality within a tree into Þrst and second years of the life cycle. In the Þrst year of the life cycle, red oak borer larvae are often found in clusters. As larvae forage, galleries increase in size,
Vol. 34, no. 1
frequently resulting in a single amalgamation of 4 Ð 10 merged galleries with only one or two larvae surviving. This may indicate conspeciÞc facultative predation (Dodds et al. 2001) and can make it difÞcult to distinguish number and size of original galleries. Another unusual phenomenon encountered when using intensive sampling techniques is that larval remains are rarely found within empty galleries. It is uncertain whether remains quickly deteriorate within the damp tissue of the tree, are removed through cannibalism or predation, or are simply destroyed during bark removal. Second-year phloem galleries are more difÞcult to identify than Þrst-year galleries. Distinguishing between a second-year gallery with no larvae present and a previous generation second-year gallery can be difÞcult. Current generation second-year galleries are normally the same color as surrounding live tree tissues, although, whereas tissue in older galleries begins to deteriorate, darken, and scar over from the edges. Previous generation gallery dissection revealed that several successive generations of red oak borers may infest a tree without killing it. Comparison of counts of emergence holes on the bark surface to previous generation gallery values (Table 1) show that exit holes, which are external and easy to see, are reasonable indicators of the number of red oak borers that emerged in previous generations. Two problems encountered in measuring this parameter are that some emergence holes heal over and that red oak borer emergence holes may be difÞcult to distinguish from other large wood-boring insect emergence holes, e.g., carpenter worm, Prionoxystus robiniae Peck (Lepidoptera: Cossidae). Intensive sampling is very accurate. However, it is impractical at a large scale because it is time consuming and expensive. An intensively sampled tree with an average of 27 (range, 21Ð34) 0.5 m sample units requires ⬇137 h to collect and dissect, whereas an extensively sampled tree takes ⬇57 h, a savings of ⬇80 h/tree. Our research reveals that extensive sampling is acceptably accurate for red oak borer population parameters of interest. Attack and emergence hole estimates were accurate, with extensive estimates only slightly overestimating attack holes and slightly underestimating emergence holes. Extensive estimates of current generation galleries and live larval density, both variables of great interest in knowing current generation densities, and changes in population levels from generation to generation, were also acceptably accurate. Previous generation gallery estimates were very accurate (bias ⬍ 2%), and this variable would be important for determining how many red oak borers were present over the lifetime of the tree and perhaps provide insight into red oak borer densities that lead to tree death. By examining both fresh and residual evidence within individual trees and among large numbers of different trees, it is possible to better understand red oak borer population dynamics. It is important, however, to recognize the strengths and weaknesses of each estimate and
February 2005
FIERKE ET AL.: RED OAK BORER SAMPLING
attempt to use some combination of sampling techniques and population measurements before drawing Þnal conclusions. The decision to implement extensive sampling is a compromise between accuracy and efÞciency. Extensive estimates seem accurate enough to justify an increased sampling effort, allowing population estimates at the tree, stand, and perhaps area level. This procedure, however, is still too time consuming and costly to estimate populations at the landscape level. Based on data collected from both intensive and extensive sampling of infested trees, we are developing a rapid estimation procedure that will provide a quick and nondestructive technique for estimating damage and within-tree population densities using variables easily measured in the Þeld. This will allow researchers to rapidly survey populations, estimate damage, and extrapolate population densities to the tree, stand, area, and landscape level. Red oak borer population densities are much higher in the current oak mortality event than those reported historically. Current generation galleries are from current year attacks associated with successfully formed phloem feeding galleries and are comparable with previous research of active red oak borer attack sites. Hay (1974) found an average of 2.9 attacks on the basal 1.8 m of scarlet oak, northern red oak, and black oak. Our current generation counts from 0.5 to 2 m (1.5 m) of eight intensively sampled trees were 10 times higher (30.1 per tree). Furthermore, we found ⬇1.8 live borers per tree from 0.5 to 2 m and a maximum of 23 just before adult emergence in 11 trees split in the Þeld in June 2003. In comparison, Hay (1974) found a maximum of 15 borers and an average of 0.62 adults emerging from the basal 1.8 m. Donley and Rast (1984) found an average of 2.0 attack sites per tree in Pennsylvania and 3.6 in Indiana, much less than our whole tree numbers of 599 current generation galleries per tree. Trees in the red oak group, Erythrobalanus, are preferred hosts for oviposition (Hay 1974, Donley 1978). Examination of our data for two white oaks indicates that they are also serving as red oak borer hosts. The two white oak trees we sampled were in areas exhibiting high red oak borer populations and did have visible red oak borer attack holes. The Þrst white oak harvested was completely mapped and scraped and had 1,242 current generation galleries and eight live red oak borers. The second white oak was taken late in the life cycle and had 38 live red oak borers in pupal and pharate adult stages. In comparison, Galford (1983) examined 457 white oaks in Ohio and found only 27 that exhibited signs of red oak borer attack, and those had an average of seven attacks that reached xylem. It is unknown at this point if we inadvertently chose two unusually infested white oak trees or if this is a widespread phenomenon connected to this oak decline event, but it is certainly merits further study.
191
Acknowledgments The authors thank B. Kelley, L. Lucio, M. Hardy, S. Wingard, B. Rowe, and J. Bates for assistance with data collection. Financial support for this research was provided in part through the Arkansas Agricultural Experiment Station, the Arkansas Forestry Research Center, and Special Technology Development Grants funded by the USDA Forest Service, Forest Health Management, Pineville, LA.
References Cited Coulson, R. N., F. P. Hain, J. L. Foltz, and A. M. Mayyasi. 1975. Techniques for sampling the dynamics of southern pine beetle populations. Texas A & M University, Texas Agric. and Experiment Station, College Station, TX. DeMars, C. J. 1970. Frequency distributions, data transformations, and analysis of variations used in determination of optimum sample size and effort for broods of the western pine beetle, pp. 42Ð 65. In R. W. Stark and D. L. Dahlsten (eds.), Studies on the population dynamics of the western pine beetle Dendroctonus brevicomis LeConte (Coleoptera: Scolytidae). University of California, Division of Agricultural Sciences, Davis, CA. Dodds, K. J., C. Graber, and F. M. Stephen. 2001. Facultative intraguild predation by larval Cerambycidae (Coleoptera) on bark beetle larvae (Coleoptera: Scolytidae). Environ. Entomol. 30: 17Ð22. Donley, D. E. 1978. Oviposition by the red oak borer, Enaphalodes rufulus Coleoptera: Cerambycidae. Ann. Entomol. Soc. Am. 71: 496 Ð 498. Donley, D. E., and J. R. Terry. 1977. How to identify damage by major oak borers in the Eastern United States. USDA Forest Service, Northeastern Forest Experiment Station, Newtown Square, PA. Donley, D. E., and E. Rast. 1984. Vertical distribution of the red oak borer, Enaphalodes rufulus (Coleoptera: Cerambycidae), in red oak. Environ. Entomol. 13: 41Ð 44. Galford, J. R. 1983. Life history of the red oak borer, Enaphalodes rufulus (Haldeman), in white oak (Coleoptera: Cerambycidae). Entomol. News. 94: 7Ð10. Hay, C. J. 1969. The life history of a red oak borer and its behavior in red, black and scarlet oak. Proc. North Central Branch, Entomol. Soc. of America. 24: 125Ð128. Hay, C. J. 1974. Survival and mortality of red oak borer larvae on black, scarlet, and northern red oak in eastern Kentucky. Ann. Entomol. Soc. Am. 67: 981Ð986. Kirkpatrick, R. L., and P. J. Pekins. 2002. Nutritional value of acorns for wildlife, pp. 173Ð181. In W. J. McShea and W. M. Healy (eds.), Oak forest ecosystems. Johns Hopkins University Press, Baltimore, MD. Manion, P. D. 1991. Tree disease concepts, 2nd ed. Prentice-Hall, Englewood Cliffs, NJ. Mistretta, P. A., C. E. Affeltranger, D. A. Starkey, S. A. Covington, and Z. M. Wortham. 1981. Evaluation of oak mortality on the Ozark National Forest Arkansas, 1981. USDA Forest Service, Southeastern Area, State and Private Forestry, Atlanta, GA. Nebeker, T. E., O. P. Hackney, R. R. Hocking, M. Paz, and J. H. Lashomb. 1978. Methods for and comparison of sampling schemes for estimating within tree southern pine beetle populations (Coleoptera: Scolytidae). Can. Entomol. 110: 1015Ð1022. Pedigo, L. P. 1996. Entomology and pest management. Prentice-Hall, Upper Saddle River, NJ. Pulley, P. E., J. L. Foltz, A. M. Mayyasi, R. N. Coulson, and W. C. Martin. 1977. Sampling procedures for withintree attacking adult populations of the southern pine
192
ENVIRONMENTAL ENTOMOLOGY
beetle, Dendroctonus frontalis (Coleoptera: Scolytidae). Can. Entomol. 109: 39 Ð 48. SAS Institute. 2004. JMP version 5.1. Cary, NC. Shepherd, R. F. 1965. Distribution of attacks by Dendroctonus ponderosae Hopk. on Pinus contorta Dougl. var. latifolia Engel. Can. Entomol. 97: 207Ð215. Solomon, J. D. 1995. Guide to insect borers in North American broadleaf trees and shrubs. USDA Forest Service Agric. Handbook 706. Southwood, T.R.E., and P. A. Henderson. 2000. Ecological methods, 3rd ed. Blackwell. Blackwell Science, Malden, MA. Starkey, D. S. Mangini, F. Oliveria, S. Clarke, B. Bruce, R. Kertz, and R. Menard. 2000. Forest health evaluation of oak mortality and decline on the Ozark National Forest, 1999. USDA Forest Service, Forest Health Protection, Alexandria, LA. Stephen, F. M., V. B. Salisbury, and F. L. Oliveria. 2001. Red oak borer, Enaphalodes rufulus (Coleoptera: Cerambycidae), in the Ozark Mountains of Arkansas,
Vol. 34, no. 1
U.S.A.: an unexpected and remarkable forest disturbance. Integr. Pest Manag. Rev. 6: 247Ð252. Tainter, F. H., S. W. Fraedrich, and D. M. Benson. 1984. The effect of climate on growth, decline, and death of northern red oaks in the western North Carolina Nantahala Mountains. Castanea. 49: 127Ð137. Tryon, E. H., and R. P. True. 1958. Recent reductions in annual radial increments in dying scarlet oaks related to rainfall deÞciencies. For. Sci. 4: 219 Ð230. U.S. Department of Agriculture, Forest Service [U.S. Dep. Agric. FS]. 1999. Ozark-Ouachita Highlands assessment: terrestrial vegetation and wildlife. U.S. Department of Agriculture, Forest Service, Southern Research Station, Asheville, NC. Yeiser, J. L., and F. Burnett. 1982. Fate of forest trees stressed by heat and drought in southeastern Arkansas. Southern J. Appl. Forestry. 6: 194 Ð195. Received 15 July 2004; accepted 12 November 2004.