Development and User Testing of a Python Interface to the GRAVSOFT Gravity Field Programs
53
J. Nielsen, C.C. Tscherning, T.R.N. Jansson, and R. Forsberg
Abstract
The GRAVSOFT suite of Fortran programs enables gravity field modeling using 3D or 2D Least-Squares Collocation and Fourier techniques, the computation of topographic effects, the evaluation of high-degree spherical harmonic series and several other functions. It has been developed since the early 1970s with a lineoriented DOS-interface. Sponsored by the Geodetic Survey of Malaysia a modern graphical interface has been designed using Python (www.python.org) and the widget toolkit Tk, following the Apple Design Guidelines. A prototype was designed and tested at a geoid workshop in Malaysia. An iteration of this was then tested at the International Geoid School, Como and a third iteration during a graduate course at the University of Copenhagen. The result is two main redesigns; the GRAVSOFT Launcher Interface and the browsing Interface. User evaluation showed high satisfaction with the Interface, but identified the error/help support as dissatisfying. However 1 in 4 found it difficult to learn to use the programs. Difficulties in learning is correlated with participants educational level, showing that when applications – which have been used in research – target other user groups, redesign and user testing is required.
53.1 J. Nielsen Copenhagen Business School, Center for Applied ICT, Howitzvej 60, Frederiksberg, Denmark C.C. Tscherning (*) University of Copenhagen, Juliane Maries Vej 30, Copenhagen Oe, Denmark e-mail:
[email protected] T.R.N. Jansson University of Copenhagen, Juliane Maries Vej 30, Copenhagen Oe, Denmark Schlumberger, Titangade 15, Copenhagen N, Denmark R. Forsberg DTU-Space, Juliane Maries Vej 30, Copenhagen Oe, Denmark
Introduction
As a support for a Height Modernization Project carried out by the Geodetic Survey of Malaysia, a height reference surface (geoid) was computed in the summer of 2008. This was done using the GRAVSOFT suite of FORTRAN programs. These programs have been developed continuously since 1970 by the staff of the National Space Center, Danish Technical University (DTU-Space) [earlier a part of the Danish National Survey and Cadastre (KMS)] in cooperation with the Niels Bohr Institute, University of Copenhagen (UCPH).
S. Kenyon et al. (eds.), Geodesy for Planet Earth, International Association of Geodesy Symposia 136, DOI 10.1007/978-3-642-20338-1_54, # Springer-Verlag Berlin Heidelberg 2012
443
444
J. Nielsen et al.
The program software was constructed with a DOS interface (see e.g. Tscherning et al. 1992). This is difficult to use for users who are accustomed to graphical interfaces. On request by the Geodetic Survey of Malaysia a modern user-friendly system was developed (Sect. 53.3). UCPH had earlier cooperated with the research group on HumanComputer Interaction (HCI) at Copenhagen Business School (CBS) on an EU project on a distributed visualization tool for virtual collaboration (Nielsen et al. 2003). The task of developing GRAVSOFT with a graphical interface became an interdisciplinary undertaking in collaboration with CBS and two design principles were specified; Use and User – Minimize cognitive load on users; Interface – Logically related application programs and functions in program modules must be placed together. As tools to create the new interface the programming language Python and the widget toolkit Tk were selected (Sect. 53.4). These languages permit the creation of cross-platform interfaces (Windows, Linux, Mac) and are open-source products. http:// www.python.org/ http://en.wikipedia.org/wiki/Tk_%28framework%29 In the following we introduce the background of GRAVSOFT, and describe the design process, specifying the four phases in the iterative process. We then turn to the resulting design, the PYTHON/ Tk application, and give guidelines on installation and launch. We show and describe the Launcher interface and an example of the computation of geoid heights in a grid over Denmark based on the EGM96 Earth Gravity Model. In a final paragraph we focus on the empirical data from user testing and evaluation which is presented and discussed.
53.2
GRAVSOFT
The GRAVSOFT programs have been used in the daily work of KMS, DTU-Space and UCPH both for gravity field modeling and teaching. The current suite of programs also contain some useful service programs for example for map-transformations and conversion of GRAVSOFT grid files to files acceptable for mapping software like Surfer (Golden Software 2002) or GMT (http://gmt.soest.hawaii.edu/ ), (see Fig. 53.2).
The programs are written and maintained in FORTRAN77, with one exception which is a FORTRAN 95 version of the program GEOCOL, which use multiprocessing when solving systems of equations or when evaluating a series of spherical harmonics. This was excluded in the redesign because many scientific communities do not have access to Fortran95 and multiCPU computers. Researcher who have access to a FORTRAN compiler, may change the source-codes if errors are found, and re-compile the programs. The programs are copyright by the authors, but distributed freely to non-commercial users, see (Forsberg and Tscherning 2008).
53.3
Interface Design: An Iterative Process
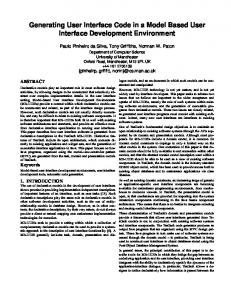
The interface design has been developed following Apple Design Guidelines (1987) and has evolved during an iterative lifecycle process of pre-analysis, conceptual design, product design and test (Preece et al. 2004). The Life Cycle is a dynamic model that combines the progression of an interaction design process over time with the returning activities of each iteration during the process from the initial project start, to the final product deliverance (cf. Fig. 53.1 below). In the Pre-analysis phase focus is on the users. Who are the users, what is their educational background, are they computer experts or novices, are there culture specific aspects to be addressed etc? What exactly does the client mean when requesting a user friendly interface? What kind of computers and software does the client use? Once this data is analyzed and put into a coherent picture the Idea Generation and Conceptual Design work is undertaken. In this phase it is important not to work under restrictions but let ideas flourish. Some ideas are more viable than others and will be conceptualized in designs which may be sketches, a list of needed functionalities, initial interface design (which may be tested with users or experts) etc In the Product Design phase, the actual development begins. This is where the interaction is designed, where a first running version of the program and the graphical interface is constructed, tested and redesigned. Test and evaluation is carried out both on conceptual design, e.g. sketches or interface drafts, and on
53
Development and User Testing of a Python Interface
445
Fig. 53.1 The LifeCycle model of the Interface design process
Fig. 53.2 GRAVSOFT Launcher
the product design and may be both expert tests and user tests. The conceptual design resulted in several interface sketches which were tested by experts. This led to redesign of the GRAVSOFT Launcher Interface (see Fig. 53.2) dividing it into three groups; 3d Applications; 2D Applications and Service Programs with sky blue background color to distinguish the group headings from the specification of the programs which are on grey background. After two iterations a high fidelity prototype of GRAVSOFT with new graphical interface was developed and initially tested by users who participated in the geoid workshop in Malaysia. This led to an iteration and the second version of GRAVSOFT was tested by participants in the
International Geoid School in Como. Finally a third iteration was tested during a graduate course on gravity field modeling at the University of Copenhagen. In the following we describe the resulting PYTHON/Tk interface design. We then focus on the Test and Evaluation which have been part of the launching of the program where data was collected during the geoid workshops.
53.4
Python/Tk Application
The interface design was implemented using Python and Tk. A primary reason is that the two software are under open source license and free to use, and that they
446
J. Nielsen et al.
can run on multiple platforms. This gives a few restrictions, but many other valuable features are implemented, e.g. Python itself finds the relevant Linux or Windows executable. One restriction is that each interface for each module must fit on one screen, no scrolling is possible. Also it was decided to only use GRAVSOFT data formats, i.e. data records on the form id#, latitude, longitude (both in decimal degrees), altitude (m) and a number of data columns and grid data also only in the GRAVSOFT format. Modules are available in the Service Programs section to convert to other grid-formats.
53.4.1 Installation and Launch Windows users must download and install Python from http://www.python.org. The python programs, the FORTRAN executables and the test-data must be extracted from a ZIP-file (provided on the UCPH ftpserver) using Winzip to a directory pyGravsoft which contains source code, binaries and test data. Detailed instructions are found in (Nielsen et al. 2008). The interface can be started up either by clicking on the program launcher.py or by writing launcher.py in a window shell. This will create the initial screen which also gives an overview over the programs (Fig. 53.2). The Launcher window shows the Interface layout and the division of the programs into 3 groups: 3D applications, 2D applications and Service programs. The last group of programs is primarily used for data-manipulation or coordinate transformation as explained above. Nearly all the 2D programs use a planar approximation to the surface of the Earth and makes naturally necessary corrections related to this into account. The 3D programs operate either without any approximations (global calculations) or uses spherical approximations for local or regional calculations.
Fig. 53.3 Python interface to GEOEGM
needed, clicking on the “Write setting” button is sufficient. The files are over-written if the program is run a second time. The file must be renamed if the user wants to save it. In order to use a program, the user must click on the appropriate button with the name of the program, e.g. 3D Application, GEOEGM. This will launch a window with slots where the user must key information, e.g. the values of parameters. File selection can be done graphically. Some default values are provided in order to aid the user in understanding what is asked for, but in most cases clicking on a helpbutton will give detailed information (Fig. 53.3). A link to a general Help (documents on the internet or in the sub-directory doc) is also provided. The example shows the computation of height anomalies in a grid over Denmark based on the EGM96 Earth Gravity Model. The run as shown requires that the user has created a sub-directory called “result”, where the grid file is stored. Note in Fig. 53.3 that default values for non-grid application are dimmed.
53.4.2 Use The program may be run by clicking on the “Run program” button. This will create an ASCII input file named < program name>.inp which is used by the executable. The result of the run will be seen on the screen, and it is also stored automatically in a file < program name>.log. If only the input file is
53.5
User Testing and Evaluation
The questionnaire (see Fig. 53.4) is part of the test and evaluation circle of the Gravsoft software interface. It is designed as an electronic user feed back survey and
53
Development and User Testing of a Python Interface
the survey is anonymous. It is accessible from http:// www.cctscherning.dk/survey . There are 25 questions divided into the following four themes • General aspects of usability satisfaction • Interface design, subdivided into: screen, terminology and system information, system capabilities and learning (to use) • Usefulness and ease of use • Background information The questionnaire is designed with a feedback in percentage so the users know how far they are in the survey. The themes are constructed using the Likert scale (Likert 1932) and most themes need to be answered before the user can move on to the next theme. Prior to the test all participants took part in a workshop/course in geoid determination and the data was gathered during three workshops taking place in Malaysia, in Como and in Copenhagen with participants coming from Malaysia, Europe mainly and Denmark.
Fig. 53.4 Example page from survey
447
53.5.1 Age and Education of Users Approximately 28% are between 40–50 years old, 32% are between 30–40 years and a little more than 39% are between 20–30 years old. Around 80% are males and 20% are females. Most are university graduates, typically in engineering, surveying, geodesy, mathematics and geophysics, a few have a bachelor, some have other education.
53.5.2 Knowledge and Competence As part of background information we asked about participants’ knowledge of English, understanding of mathematics, work experience and knowledge of physical geodesy. The picture is very homogenous, participants primarily rate themselves as proficient or competent (score 4 and 5) in English, in knowledge of computers, and in mathematics. However, their work experience with GPS positioning, remote sensing, digital mapping and precise levelling showed a
448
J. Nielsen et al.
the needed file. However a new user test showed that this did not fully solve the problem, as it created another problem. Sometimes the file names would have too many letters for the browser to function optimal. In the third iteration of the design we rewrote the programs to permit file names up to 128 characters and the problem was solved.
more diverse pattern as did the pattern concerning their background knowledge and familiarity with physical geodesy (gravity field, – potential, – anomaly etc). Knowledge level of physical geodesy shows that 75% are proficient or competent whereas only 25% see themselves as advanced beginners.
53.5.3 Error Message and Browsing Functionality
53.5.4 Usability Satisfaction
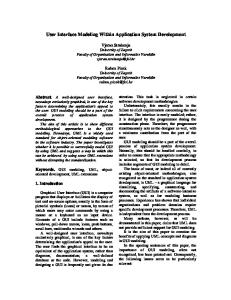
The user evaluation and testing showed a general satisfaction with the software, with two important exception, see Fig. 53.5a–f. The error-messages were often considered confusing and not informative. The main reason for this is related to the user writing erroneous file-names or using wrong input values. Also the browsing functionality created problems. The user was required to know and remember the file names. These names were long and often a confusing mix of letters, numbers and signs and users asked for a more user friendly solution. A solution was to change the design allowing the user to browse in order to find
The evaluation showed that users found the interface easy and quick to use, screen layout, characters and colors easy to understand, interaction flexible and easy, but error/ help messages were found dissatisfying. However 1 in 4 found it difficult to learn to use the programs These difficulties in learning showed a correlation with participants’ educational level, pointing to the need for addressing this in the learning design of the schools or workshops. There is a limit to how far design can take us, new users also have to engage in a learning process.
Frequency
Use is easy, simple, quick
Interaction is understandable, flexible, easy
Screen characters, colors, layout
14
14
14
12
12
12
10
10
10
8
8
8
6
6
6
4
4
4
2
2
2
0
0 1
2
3
4
5
6
0 1
1: strongly disagree, 6: strongly agree
2
3
4
5
6
1
Learning to use, operate, explore
3
4
5
6
Terminology in prompts, error messages and correction of mistakes
Clear error and help messages, recovery quick
12
2
1: unlikely, 6:likely
1: difficult, 6:easy
20
10 Frequency
12
8
10
15
6
8 10
4 2
5
0
0 1
2
3
4
5
1: difficult, 6: easy
Fig. 53.5 (a–f) Usability satisfaction
6
6 4 2 0 1
2
3
4
5
6
1: strongly disagree, 6:strongly agree
1
2
3
4
5
1: confusing, 6: clear
6
53
Development and User Testing of a Python Interface
53.6
Concluding Remarks
We ascribe the high score on user satisfaction with the design to the iterative user centered design process applied. However, the problem which remains is that 1 in 4 found it difficult to learn to use the GRAVSOFT programs despite the redesign. This shows that when research software is being made available to users outside the research community then usability, redesign and user testing have to be addressed. This is a challenge to the geodetic community.
References Apple Human Interface Guidelines (1987) The Apple Desktop Interface by Inc. Apple Computer Forsberg R, Tscherning CC (2008) An overview manual for the GRAVSOFT Geodetic Gravity Field Modelling Programs. 2 edn. Contract report for JUPEM
449 Golden Software: Surfer User’s Guide (2002) http://www. goldensoftware.com Likert R (1932) A technique for the measurement of attitudes. Archives of Psychology 140: 1–55 Nielsen Janni, Lone Dirckinck-Holmfeld, Oluf Danielsen (2003) Dialogue Design-with mutual learning as guiding principle. International Journal of Human-Computer Interaction Nielsen J, Jansson TRN, Tscherning CC (2008) Creating a user interface to GRAVSOFT. Report prepared for Geodesy Section Dep. of Surveying and Mapping Malaysia, 2008. Available cct.gfy.ku.dk/publ_cct/cct1932.pdf Preece J, Rogers Y, Sharp H (2004) Interaction design, Apogeo Editore Tscherning CC, Forsberg R, Knudsen P (1992) The GRAVSOFT package for geoid determination. Proc. 1. Continental Workshop on the Geoid in Europe, Prague, May 1992, pp 327–334, Research Institute of Geodesy, Topography and Cartography, Prague