British Journal of Pharmaceutical Research 4(1): 79-92, 2014
SCIENCEDOMAIN international www.sciencedomain.org
Development and Validation of Densitometry TLC Stability Indicating Method for Quantitative Determination of Azelastine Hydrochloride and Emedastine Difumarate in Their Drug Products Nahla N. Salama1*, Sawsan A. Abdel-Razeq2, Shimaa Abdel-Atty1 and Naglaa El-Kosy1 1
Pharmaceutical Chemistry Department, National Organization for Drug Control and Research (NODCAR), Giza, Egypt. 2 Analytical Chemistry Department, Faculty of Pharmacy, Al-Azhar University, Cairo, Egypt. Authors’ contributions This work was carried out in collaboration between all authors. All authors read and approved the final manuscript.
th
Research Article
Received 12 March 2013 th Accepted 6 June 2013 th Published 5 October 2013
ABSTRACT Aims: Stability indicating densitometry-TLC assay was established and validated for determination of azelastine hydrochloride (AZT) and emedastine difumarate (ETD) in the presence of their acid and oxidative degradants. Methodology: Forced degradation was performed using 30% H2O2 and 5 M HCl. The method was based on thin-layer chromatographic separation of the two drugs from their degradants, using methanol- 10% ammonia (9.5:0.5, v/v) as developing system, followed by densitometric measurements of the intact drug spots at 292 and 283 nm, for azelastine hydrochloride and emedastine difumarate respectively. Results: The linear range was 0.5 - 10.0 μg/spot, with mean recoveries of 100.09 ± 0.53% and 100.36 ± 0.40% for azelastine hydrochloride and emedastine difumarate respectively. Conclusion: The proposed method was successfully applied for the routine quality control analysis of both drugs in laboratory prepared mixtures and commercially available preparations. The degradation products were identified by IR and MS and the pathways were illustrated. The method was validated according to ICH. ____________________________________________________________________________________________ *Corresponding author: Email:
[email protected];
British Journal of Pharmaceutical Research, 4(1): 79-92, 2014
Keywords: Azelastine hydrochloride; emedastine difumarate; densitometry-TLC; stability; validation.
1. INTRODUCTION Azelastine-HCl (AZT) is 4-(4-chlorobenzyl)-2-[(4RS)-1-methylhexahydro-1H-azepin-4-yl] phthalazin-1(2H)-one hydrochloride [1]. It is an intranasal antihistamine indicated for use in patients with seasonal allergic rhinitis and non-allergic vasomotor rhinitis. It is also used topically in the symptomatic relief of allergic conditions including rhinitis and conjunctivitis [2,3]. Emedastine difumarate (ETD) is 1H-benzimidazole, 1-(2-ethoxyethyl)-2-(hexahydro-4methyl-1H-1, 4- diazepin-1-yl), (E)-2-butenedioate (1:2) [4]. It is a second generation antihistamine used in eye drops to treat allergic conjunctivitis [5]. The available methods for analysis of azelastine-HCl in pharmaceutical dosage forms and biological fluids are volumetric [6], spectrophotometry[7,8], TLC[9], HPLC[10-12], and capillary electrophoresis [13]. Few methods were reported for analysis of emedastine difumarate include only HPLC with tandem MS [14,15] or radioreceptor assay[16]. Moreover voltammetry and thermal analysis were reported for determination of both drugs[17,18]. The international Conference on Harmonization (ICH) guidelines recommended stress testing to elucidate the inherent stability of active substances [19]. In the literature, no method is available so far for separation and structure elucidation of the hydrolytic and oxidative degradants of the selected drugs. Therefore, the aim of the present work is to establish densitometry-TLC method for the selective determination of both drugs.
2. EXPERIMENTAL 2.1 Instrumentation
Shimadzu dual wavelength flying spot densitometer Model CS - 9301 PC (Tokyo – Japan). Hamilton micro syringe (25µL). Aluminum plates (20 cm x 20 cm), coated with 0.2 mm layers of nano-silica gel 60 with fluorescence indicator, (Macherey – Nagel, Germany). UV short wavelength (254 nm) Lamp, (Desaga, Germany). A Bruker Vector 22 spectrometer (Bruker Instruments Ltd, Rheinstetten/ Karlsruhe, Germany) was used for recording IR spectra using KBr pellets in the range (4000 -1 400 cm ). A Shimadzu GCMS-QP1000 EX quadrupole spectrometer. EI ionization was performed with electron energy of 70 eV. The ion source temperature was 200 ºC, -1 scan mode was ACQ, and scan speed was 769 U s .
2.2 Materials and Reagents Azelastine-HCl was kindly supplied from European Egyptian Pharm Co., Egypt, with certified purity of 99.0 %. Zalastine® Nasal Spray labeled to contain 1 mg azelastine-HCl per mL (BN 7579001, European Pharm Co., Egypt) and Azelast® Eye Drops, labeled to contain 0.5 mg azelastine-HCl per mL (BN 86872, product of El-Kahira Pharm and Chem Ind Co., EPCI, Egypt) were purchased from the local market. Emedastine difumarate was kindly supplied from Chem Swiss, SIGMA Co., Egypt with purity 99.0 % [4]. Emedastine 0.05% Ophthalmic 80
British Journal of Pharmaceutical Research, 4(1): 79-92, 2014
Solution® labeled to contain 0.5 mg Emedastine difumarate per 1 mL (Batch no., 190409-F1, manufactured by SIGMA Co., Egypt) was purchased from the local market. Hydrochloric acid (Fischer Scientific, UK), ammonia (10% aqueous, Adwic Co., Egypt), hydrogen peroxide (30%, Adwic Co., Egypt) and NaOH (Adwic Co., Egypt) and methanol (Lab. Scan, Ireland) were used. 2.3 Standard Solutions -1
Standard stock solutions of AZE and ETD (1 mg mL ) were prepared by dissolving appropriate amount of each drug in methanol and diluted with methanol to obtain working -1 solutions of, 50 - 1000 μg mL for each drug. The stock solutions were stable for one week at 4 ºC.
2.4 Preparation of Degradants 2.4.1 Acid degradants About 50 mg of azelastine-HCl or emedastine difumarate were refluxed with 50 mL 5 M HCl at 100 ºC for 36 hours or 7 hours respectively, then neutralized with 5 M NaOH and evaporated to dryness under vacuum. The residue of each drug was extracted with 3x10 mL methanol, filtered into 50 mL volumetric flasks and the volume was completed with methanol. The obtained solutions were labeled to contain the acid degradants derived from 1 –1 mg mL of each drug. 2.4.2 Oxidative degradants About 50 mg of each drug were weighed in 50 mL volumetric flask, completed to the mark with 30% H2O2, and left in the dark for 24 hours for azelastine-HCl and 6 hours for emedastine difumarate. Both solutions were evaporated to dryness under vacuum. The residues were dissolved in 40 mL methanol and quantitatively transferred to 50 mL volumetric flasks. The volume was completed with methanol to obtain a solution labeled to –1 contain the oxidative degradants derived from 1 mg mL of each drug.
2.5 Densitometry-TLC Method TLC was performed on 20 x 20 cm aluminum plates precoated with silica gel F254, 10 µL of each; azelastine-HCl or emedastine difumarate were applied to the plates with 25 µL Hamilton microsyringe. Ascending development of the plates, with methanol-10% ammonia (9.5:0.5, v/v) as mobile phase, was performed. After development, the plates were air-dried and scanned at 292 nm and 283 nm for AZT and ETD respectively in reflection photo mode and zigzag scan, with swing width=10.
2.6 Laboratory Prepared Mixtures -1
Aliquots of each standard drug solution (1 mg mL ) equivalent to 0.9 – 0.1 mg were transferred into a series of 10 mL volumetric flasks. Then mixed with volumes of the corresponding drug – acid or oxidative degradants (prepared as mentioned under 2.4) derived from 0.1 – 0.9 mg azelastine-HCl or emedastine difumarate. Volumes were completed with methanol and the detailed under, "2.5 Densitometry-TLC Method" were
81
British Journal of Pharmaceutical Research, 4(1): 79-92, 2014
followed. Intact drug concentrations were calculated from the corresponding regression equation.
2.7 Application to Pharmaceutical Formulations The content of five bottles of Zalastine nasal spray or twelve bottles of Azelast eye drops were mixed and a volume equivalent to 25 mg azelastine-HCl was evaporated under vacuum. The residue was extracted with 2 x 10 mL methanol and filtered into 25 mL volumetric flask, and completed with methanol. The contents of eighteen Emedastine 0.05% ophthalmic bottles were mixed and volume equivalent to 25 mg emedastine base was evaporated under vacuum and above details -1 were followed. The obtained methanolic solutions labeled to contain 1 mg mL of the each drug were analyzed by the proposed densitometric-TLC method as described under " Densitometry-TLC Method". The concentration of each drug was calculated from the corresponding regression equation.
3. RESULTS AND DISCUSSION Forced degradation of both azelastine-HCl and emedastine difumarate has been studied through acid and oxidative stress conditions. Partial hydrolysis (about 50% as measured by the proposed densitometry TLC method) of azelastine-HCl was achieved after reflux with 5 M HCl for 36 hours or about 65% of emedastine difumarate after reflux with 5 M HCl for 7 hours. Also partial oxidative degradation (about 50%) of azelastine-HCl was obtained by -1 keeping 1 mg mL solution in 30% H2O2 for 24 hours. While complete oxidative degradation -1 of emedastine difumarate was obtained by keeping 1 mg mL solution in 30% H2O2 for 6 hours.
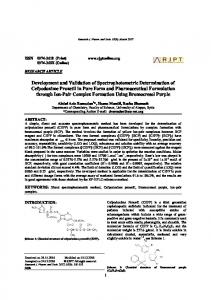
3.1 Separation and Identification of Degradants The methanolic extracts of acid-hydrolysis and oxidative degradation products of each drug was tested by TLC on silica gel 60 F254 plates. Different developing systems were tried such as mixtures of toluene–methanol–chloroform- 10% ammonia, and dichloromethane – methanol - triethylamine in different ratios no separation was achieved. Complete resolution of each drug from its degradants was achieved upon using a mixture of methanol – 10% ammonia (9.5: 0.5 v/v) with detection under UV lamp at 254 nm. For acid hydrolyzed azelastine-HCl, two spots with Rf 0.66 and Rf 0.84 were appeared and two spots at Rf 0.73 and Rf 0.86 for its oxidative degradation products. Whereas the intact drug (AZT) spot was at Rf 0.59, (Fig. 1). However, for emedastine difumarate one spot at Rf 0.73 for acid hydrolyzed solution and one spot at Rf 0.4 for its oxidative degradant. Intact emedastine base spot appeared at Rf 0.6 and difumarate spot appeared at Rf 0.79 as shown in Fig. 1.
82
British Journal of Pharmaceutical Research, 4(1): 79-92, 2014
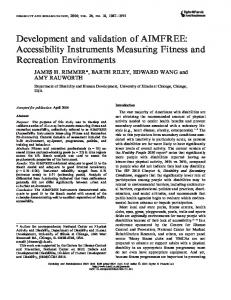
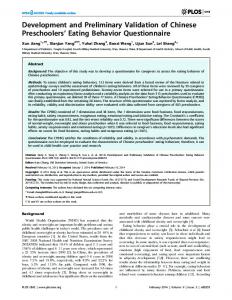
Fig. 1. Thin layer chromatograms of (a) azelastine-HCl or emedastine and their (b) oxidative degradant (c) acid degradants (d) mixture of pure and degraded drugs, developing system: methanol-10% aqueous ammonia (9.5: 0.5 v/v) The degradants of each drug was subsequently separated on preparative TLC plates using the same developing solvents and extracted with methanol. The methanolic solutions were evaporated under vacuum, the residues were subjected to IR on KBr discs and mass spectroscopy, as shown in Figs. (2–4), and the results are given in Table 1. The suggested pathway of azelastine HCl and emedastine difumarate degradation are shown in Scheme (1 & 2).
3.2 Method Validation 3.2.1 Linearity range Good correlation was found to exist between the peak areas of the separated spots and drug concentration over the range of, 0.5-10 g/spot for azelastine-HCl and emedastine difumarate ( Fig. 5) as indicated by correlation coefficient ( r= 0.9993 - 0.9997), Table 2. 3.2.2 The limits of detection (LOD) and quantification (LOQ) The LOD is the lowest amount of analyte in a sample which can be detected but not necessarily quantitated as an exactvalue. The detection limit (LOD) was calculated according to the equation: LOD = 3.3 σ/ S, Where σ = the standard deviation of the intercepts of regression lines, S = the slope of the calibration curve. LOD was calculated to be 0.031 and 0.042 g/spot for azelastine-HCl and emedastine base, respectively. LOQ was the lowest concentration of calibration curve, Table 2.
83
British Journal of Pharmaceutical Research, 4(1): 79-92, 2014
Fig. 2. Infra red and mass spectra of azelastine-HCl (a), acid degradant I (b) and acid degradant II (c)
84
British Journal of Pharmaceutical Research, 4(1): 79-92, 2014
Fig. 3. Infra red and mass spectra of azelastine-HCl oxidadive degradants III (a), and oxidative degradant IV (b).
Fig. 4. Infra red and mass spectra of pure emedastine difumarate (a), its acid degradant (b) and oxidative degradant (c) 85
British Journal of Pharmaceutical Research, 4(1): 79-92, 2014
Table 1. Assignment of IR and mass data of azelastine-HCl and emedastine base and their degradants Drugs Azelastine-HCl
Mass data m/z=381.3 (M) corresponding to C22H24 ClN3O m/z=356 (M-2) corresponding to C21H24 ClN2O
Acid degradant (I) Acid degradant (II)
m/z =397 (M-2) corresponding to C22H24 ClN3O2
Oxidative degradant (III)
m/z =323 (M - 1) corresponding to C19H18 ClN2O m/z =308 (M - 2) corresponding to C18H17ClN2O m/z=534.6 (M) corresponding to C25H34N4O9
Oxidative degradant (IV) Emedastine difumarate
Acid degradant (I)
m/z=380 (M) corresponding to C22H28N4O2 m/z= 185(M-1) corresponding to C11H10N2O
Oxidative degradant (II)
O
N
OH CO
O
N
N H
N
Reflux 36 hr
Cl
HN N
Cl
Cl
2-[1-Amino-2-(4-chloro-phenyl)ethyl]-N-(1-ethyl-butyl)-benzamide
Azelastine
H
2
hr
O
2
30 %
2-{2-(4-Chloro-phenyl)1-[(1-methyl-azepan -4-yl)-hydrazono]-ethyl}benzoic acid Deg II, MW =399, Rf=0.84
Deg I, MW=358, Rf=0.66
MW=381.9, Rf=0.59
N
+
NH2
5 M HCl
24
IR data -1 Band at 1330 cm (ν C-N) of seven ring -1 Band at 1628 cm (ν C=O) of CO-NH. -1 Band at 3417 cm of NH2 -1 Band at 1734 cm (ν C=O) of COOH. -1 Band at 3433 cm (ν O-H) of COOH -1 Band at 1731 cm (ν C=O) of CHO. -1 Band at 1732 cm (ν C=O) of COOH. -1 Band at 1719 cm (ν C=O) of COOH. -1 Band at 1016.3 cm (ν –O-) of aliphatic ether -1 , Band at 1654 cm ν double bond of dimmer -1 Band at 1103 cm (ν –O-) of aromatic ether
O
COOH
CH
N
HN N
Cl
2-[1-(Butyl-hydrazono)-2-(4-chlorophenyl)-ethyl]-benzaldehyde Deg III, MW=324, Rf =0.73
N
+ Cl
2-[2-(4-Chloro-phenyl)-1-(ethylidenehydrazono)-ethyl]-benzoic acid Deg IV, MW=310, Rf = 0.86
Scheme 1. Suggested pathway for the acid and oxidative degradation of azelastineHCl
86
British Journal of Pharmaceutical Research, 4(1): 79-92, 2014
Scheme 2. Suggested pathway for acid and oxidative degradation of emedastine difumarate
AZE
ETD
Fig. 5. Densitometric scanning profile for TLC-chromatogram of different concentrations (0.5 - 10 µg/spot) at 290 and 283 nm for azelastine- HCl and emedastine respectively 3.2.3 Accuracy The previously mentioned procedure under linearity was repeated three times for five different concentrations within the linearity range. The mean percentage recoveries were ranged between 100.09% and 100.36% for the two drugs respectively, Table 2.
87
British Journal of Pharmaceutical Research, 4(1): 79-92, 2014
Table 2. Assay validation parameters of the proposed densitometric-TLC method Parameters Linearity (µg/spot) LOD (µg/spot) LOQ (µg/spot) a Accuracy (mean±RSD%) Intraday Interday b Precision (RSD%) Intraday Interday Regression parameters Slope SE of the slope Intercept SE of the intercept Correlation coefficient (r)
Azelastine-HCl 0.5 - 10.0 0.03 0.50
Emedastine difumarate 0.5 - 10.0 0.04 0.50
98.00 - 100.88 98.63 - 101.60
99.58 - 100.41 98.50 - 101.02
0.64 - 1.27 0.89 - 1.42
0.37 - 1.09 0.44 - 1.31
2
a
9.77 x10 -2 1 x10 2 2.99 x10 -2 0.9 x10 0.9993 b
n=6; n=9.
2
9.36 x10 -2 0.81 x10 2 10.45 x 10 -2 0.78 x10 0.9997
3.2.4 Precision The precision of the assay (within assay and between assays) was determined for both drugs in triplicate at five concentration levels for each drug using the previous mentioned procedure under linearity in the same day (Table 2). The intra day, RSD was 0.64 -1.27% and 0.37 -1.09% while intermediate RSD was 0.89 – 1.42% and 0.44 – 1.31%, for AZT and EDT respectively, Table 2. 3.2.5 Selectivity The selectivity of the proposed method was revealed by analyzing laboratory prepared mixtures of intact drugs (AZT and EDT) each with its degradants. The method was applicable for the selective determination of intact AZT in presence of, 10.0 – 45.0 % of its acid or oxidative degradants (Table 3) with mean recoveries of 99.42 ±1.59 % and 100.20 ± 1.44 % respectively. Table 4 shows that EDT could be determined in presence of up to 59.0 % of its acid degradant or up to 80.0 % of oxidative degradant with mean recoveries of 99.34 ± 1.55 and 99.58 ± 1.16%, respectively. Table 3. Determination of azelastine-HCl in laboratory prepared mixtures with its acid or oxidative degradation products by the proposed densitometric-TLC method a
b
Intact (µg/spot) 5.5 6.0 7.0 8.0 9.0 Mean ± RSD% a
Acid Recovery % degradants of intact* (µg/spot ) 4.5 98.00 4.0 98.21 3.0 101.10 2.0 98.60 1.0 101.20 99.42 ±1.59
Oxidative degradants (µg/spot ) 4.5 4.0 3.0 2.0 1.0 100.20 ± 1.44
b
Recovery % a of intact 101.32 98.73 98.55 101.50 100.90
b
Added + remained in degraded solution. Intact drug (AZT-HCl).; n=3.
88
British Journal of Pharmaceutical Research, 4(1): 79-92, 2014
Table 4. Determination of emedastine base in laboratory prepared mixtures with its acid or oxidative degradation products by the proposed densitometric- TLC method a
Intact (µg/spot) 4.15 4.80 6.10 7.40 8.70 Mean ± RSD%
b
Acid degradants (µg/spot ) 5.85 5.20 3.90 2.60 1.30 a
Recovery % a of intact 98.08 101.03 98.03 101.02 98.55 99.34 ± 1.55
Intact (µg/spot) 1.0 2.0 4.0 6.0 8.0 99.58 ± 1.16
Oxidative degradants (µg/spot ) 9.0 8.0 6.0 4.0 2.0
b
Recovery % of a intact 98.90 100.50 101.10 99.00 98.40
Added + remained in degraded solution, Intact drug (ETD); b n=3.
3.2.6 Robustness Robustness was assessed by evaluating the influence of small variation of experimental variables as developing system composition, saturation time and temperature on reliability of the method. For mobile phase, methanol: 10% ammonia, 9.5:0.4 or 9.5:0.3 gave RSD% not exceeding 1.52% for azelastine-HCl and 1.44% for emedastine. The small change in temperature 23, 25, 27 ºC or saturation time (10±2 min) did not significantly affect the results.
3.3 Application of the Proposed Densitometric-TLC Method The proposed method was applied for the determination of the two drugs in their pharmaceutical preparations. The results revealed good recoveries ± RSD of 99.33 ±1.21%, 99.25 ± 1.18% for azelastine-HCl in Zalastine nasal spray or Azelast eye drops and 99.37 ±1.41 % for emedastine base in Emedastine ophthalmic solution (Table 5). Statistical analysis of the results obtained by the suggested method compared with the manufacturer [20] or official method for azelastine-HCl and emedastine difumarate revealed no significant difference within a probability of 95% [21]; Table 6. However, the proposed densitometricTLC method is more sensitive and more selective than the manufacturer or reported methods in being stability indicating one. Table 5. Application of standard addition technique for the determination of azelastine HCl and emedastine by the proposed densitometric-TLC method Conc.(µg/spot ) Claimed Pure added taken 2.0 1.0 2.0 2.0 2.0 4.0 2.0 6.0 2.0 8.0 Mean recovery ±RSD%
Zalastine nasal spray a Recovery % of pure added 98.63 98.84 101.55 100.91 98.77 99.74 ± 1.38
a
Azalast eye drop a Recovery % of pure added 98.44 101.11 100.34 98.82 99.10 99.56 ± 1.12
Average of three determinations.
Emedastine ophthalmic soln. a Recovery % of pure added 99.32 101.21 98.97 98.56 101.71 99.95 ± 1.41
89
British Journal of Pharmaceutical Research, 4(1): 79-92, 2014
Table 6. Statistical analysis of the results obtained by the proposed densitometric-TLC and manufacturer or official methods for the determination of azelastine-HCl and emedastine base Paramet ers
Mean % SD Variance n t-test d (2.306) F-test d (6.400)
Drug substances Azelastine-HCl Proposed TLC method 100.09 0.53 0.28 5 0.620 1.06
a
Official method 100.30 0.54 0.30 5
b
Proposed TLC method 100.36 0.40 0.16 5 0.147
Official method 100.30 0.82 0.67 5
4.30 a
Drug products Zalastine nasal spray
Emedastine base
Proposed TLC method 99.33 1.21 1.46 5 0.201
Manufac. method 99.52 1.02 1.04 5
1.41 b
Azalast eye drop c
Proposed TLC method 99.25 1.18 1.38 5 0.014 1.12
Manufac. method 99.26 1.110 1.230 5
c
Emedastine ophthalmic solution b Proposed Offical TLC method method 99.37 1.410 1.988 5 1.625
100.6 0.938 0.879 5
2.26
c
Official HPLC method (BP 2013). Official HPLC method (USP 2013). Manufacturer's UV spectrophotometric method. d The values between parenthesis are the theoretical values of t and F at (p= .05).
90
British Journal of Pharmaceutical Research, 4(1): 79-92, 2014
The validity of the proposed method was further assured by applying the standard addition technique. The mean percentage recoveries ± RSD% were 99.74 ± 1.38 and 99.56 ± 1.12 for azelastine-HCl and 99.95 ±1.41 for emedastine base; (Table 5).
4. CONCLUSION The developed densitometric-TLC method is economic and selective for the determination of both drugs and their degradants in one run with short analysis time. The method complied with the validation guidelines of the International Conference on Harmonization and could be used for purity testing, stability studies, and quality control of both drugs, in their drug substances, drug products and in the presence of their degradants.
CONSENT Not applicable.
ETHICAL APPROVAL Not applicable.
COMPETING INTERESTS Authors have declared that no competing interests exist. REFERENCES 1. 2. 3. 4. 5. 6. 7. 8. 9. 10.
British Pharmacopoeia. Vol I and II, Majestys Her’ Stationery Office, London; 2013. Horbal JM, Bernstein JA, Azelastine HCl. A review of the old and new formulations. Clin Med Insights Ther. 2010;2:427-437. The United States Pharmacopeia 36, The National Formulary 31, The United States Pharmacopeial Convention, Twinbrook Parkway, Rockville. MD Inc.; 2013. Lowry GM, Abelson M, Rubin JM. Emedastine ophthalmic solution alleviates ocular itching and redness associated with allergic conjunctivitis. Invest Ophthalmol Vis Sci. 1996;37:S593. Haraguchi T, Nothenberg MS, Volumetric and spectrophotometric assays of azelastine hydrochloride. Rev Bras Cienc Farm. 1999;35:127–131. Sane RT, Joshi SG, Francis M, Khatri AR, Hijli PS. Extractive colorimetric determination of azelastine hydrochloride from its pharmaceutical preparations. Indian Drugs. 1999;36:317–320. Sane RT, Joshi SG, Francis M, Khatri AR, Hijli PS. High-performance yhin layer chromatographic determination of azelastine hydrochloride. JPC-modern TLC. 1999;12 :158–160. Salama NN, Abdel-Razeq SA, Abdel-Atty S, El-Kosy N. Spectrophotometric determination and thermodynamic studies of the charge transfer complexes of azelastine-HCl. Bull Fac Pharm Cairo Uni. 2011;49:13 –18. Pivonka J, Segelman FH, Hartman CA, Segl WE, Kucharczyk N, Sofia RD. Determination of azelastine and desmethylazelastine in human plasma by highperformance liquid chromatography. J. Chromatogr Biomed Appl. 1987;64:89-98. Heinemann U, Blaschke G, Knebel N. Simultaneous enantitioselective separation of azelastine and three of its metabolites for the investigation of the enantiomeric 91
British Journal of Pharmaceutical Research, 4(1): 79-92, 2014
metabolism in rats. Liquid Chromatography-ionspray tandem mass spectrometry and electrokinetic capillary chromatography. J Chromatogr B Anal Technol Biomed Life Sci. 2003;793:389-404. 11. Kajima T, Asakawa N, Hattori T, Sato T, Miyake Y. Optical resolution by high performance liquid chromatography, separation of enantiomeric azelastine hydrochloride by ion pair chromatography. Yakugaku-Zasshi. 1989;109:570–573. 12. Koppenhoefer B, Jakob A, Zhu XF, Lin BC. Separation of enantiomers of drugs by capillary electrophoresis with permethyl-gama-cyclodextrin as chiral solvating agent. J High Resol Chromatogr. 2000;23:413–429. 13. Takaya R, Ishida M, Sakamoto F. Simultaneous determination method of emedastine and its metabolites in human plasma using high – performance liquid chromatographytandam mass spectrometry. J Mass Spectrom Soc Jpn. 2000;48:155-159. 14. Nihashi Y, Ishida M. Determination of emedastine in plasma by the MALDI-TOF MS. J Mass Spectrom Soc Jpn. 2000;48:150-154. 15. Hamada T, Kawashima T, Awata N. Selective and sensitive determination of an antiallergic agent, emedastine difumarate, in human plasma by the radioreceptor assay combined with a high – performance liquid chromatography. Yakugaku-Zasshi. 1989;109:749-754. 16. Carstensen JT, Rhodes CT. Drug stability, principles and practices, 3rd ed.; Marcel Dekker Inc., USA, 2000;331. 17. Abdel-Razeq SA, Foaud MM, Salama NN, Abdel-Atty S, El- Kosy N. Voltammetric determination of azelastine-HCl and emedastine difumarate in micellar solution at glassy carbon and carbon paste electrodes. Sensing in Electroanalysis. 2011;6:289 305. 18. Abdel-Razeq SA, Salama NN, Abdel-Atty S, El- Kosy N. Thermoanalytical study and purity determination of azelastine hydrochloride and emedastine difumarate. Pharmaceut Anal Acta. 2012;3(8):1000176. 19. International Conference on Harmonization (ICH). Harmonized tripartite guideline Validation of analytical procedures text and methodology Q2 (R1), ICH, Geneva; 2005. 20. Manufacturer UV. Spectrophotometric method supplied by personal communication from European Pharm Co, Egypt; 2009. 21. Meier PC, Zund RE. Statistical Methods in Analytical Chemistry; 1995. _________________________________________________________________________ © 2014 Salama et al.; This is an Open Access article distributed under the terms of the Creative Commons Attribution License (http://creativecommons.org/licenses/by/3.0), which permits unrestricted use, distribution, and reproduction in any medium, provided the original work is properly cited.
Peer-review history: The peer review history for this paper can be accessed here: http://www.sciencedomain.org/review-history.php?iid=280&id=14&aid=2167
92