Development Infrastructure Characteristics and Process Capability Ravi Patnayakuni and Arun Rai A substantial portion of most organizational budgets goes toward developing IT applications.1 Despite the existence of many tools and methodologies, Information Systems Departments (ISDs) continue to face burgeoning costs and delays. In this article, we explore methods of improving the productivity and effectiveness of the application development process using the Capability Maturity Model (CMM)2 by the Software Engineering Institute (SEI) at Carnegie Mellon University as a benchmark for process maturity levels. Although most research based on CMM focuses on software development practices, we focus here on the infrastructure supporting the development process. The importance of development infrastructure is receiving increasing attention.3 For example, reusability practices depend on the establishment of a repository. An integrated and interoperable development infrastructure allows developers to share design-related information. Using data from our nationwide survey of systems development managers, we examine the relationships between the systems development infrastructure, process maturity, and performance, as assessed by customer satisfaction, product quality, and process efficiency.
Inside Development Infrastructure We focus on two aspects of development infrastructure in this study: the technology infrastructure, and measurement systems. We analyze these two aspects, along with performance of the systems development process, across levels of process maturity. As
Ravi Patnayakuni (
[email protected]) is an assistant professor in the Department of Management Information Systems at Fox School of Business and Management, Temple University in Philadelphia, PA.
Arun Rai (
[email protected]) is professor in the eCommerce Institute at the J. Mack Robinson College of Business, Georgia State University, Atlanta, GA. In 1994 alone the sum was in excess of 250 billion dollars [7]. CMM and Capability Maturity Model are service marks of Carnegie Mellon University. A similar approach to defining infrastructure is used by Broadbent and Weill [3] when they define IT infrastructure for an entire organization. 1 2 3
Permission to make digital or hard copies of all or part of this work for personal or classroom use is granted without fee provided that copies are not made or distributed for profit or commercial advantage and that copies bear this notice and the full citation on the first page. To copy otherwise, to republish, to post on servers or to redistribute to lists, requires prior specific permission and/or a fee. © 2002 ACM
COMMUNICATIONS OF THE ACM April 2002/Vol. 45, No. 4ve
201
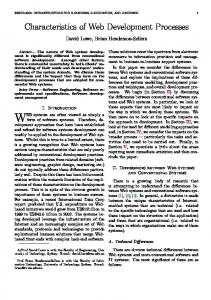
shown in Figure 1, development infrastructure can impact performance directly, or by its influence on process maturity. Organizations at higher levels of process maturity are known to have more comprehensive technology support for their systems development process, and higher levels of tool integration and object integration. Higher levels of process maturity are also associated with well-established measurement systems and use of metrics in management practices. Technology infrastructure. This aspect of the development of infrastructure is defined in terms of: domain of support, infrastructure integration, and infrastructure flexibility. We define domain of support as the extent to which tools support the process. A development tool with comprehensive support covers all system development functions, ranging from requirement determination to code generation and testing. Infrastructure integration is characterized in terms of tool integration and object integration [8]. We define tool integration as the degree to which different tools interface with each other to exchange development-related data. Typically, tools for modeling, testing, maintenance, project management, and quality assurance are not well integrated with generic analysis, design, and construction tools [5]. Well integrated tools reduce technical barriers for the logical integration of development tasks. We define object integration as the degree to which a consistent view of development artifacts exists, along with easy-to-use interfaces for generation, access, and control of these artifacts [8]. Such integration should ensure the semantic content of information collected and generated in the early stages is not lost during downstream systems development activities. We define infrastructure flexibility as the degree to which the tools do not limit development activities undertaken by developers. The technology infrastructure to support the development process should be adaptive to the changing needs of developers. To assess flexibility, we examine the extent to which the infrastructure restricts
Figure 1. Framework for the study. 202
April 2002/Vol. 45, No. 4ve COMMUNICATIONS OF THE ACM
developers. Our definition of infrastructure restrictiveness is based on the concept of system restrictiveness suggested by Silver [9]. Measurement Systems. We define measurement system as the adoption of metricsbased management practices where metrics are defined, collected and used to manage the process and improve its performance. This notion of management-by-fact is quintessential to Total Quality Management and continuous process improvement. Performance. We define performance of the development process in terms of customer satisfaction, product quality, and process efficiency. We examine variations in performance of the development process across levels of process maturity and with variations in development infrastructure. Ideally, the development infrastructure should increase development efficiency, raise reliability of developed systems, and ensure conformity to user requirements [10] Some studies report productivity gains from use of development technologies like CASE [1, 4], while others found the expected gains to be elusive [11]. Other empirical studies suggest development technologies have only had a marginal effect on development outcomes, such as quality [11]. To assess process maturity levels, we used the CMM of SEI. The CMM is a normative reference model to appraise the process capabilities of organizations developing systems. The model is organized into five maturity levels: initial, repeatable, defined, managed, and optimizing. The improvement path for process capability progresses from the first level (initial), where base practices are performed even though the process is considered ad hoc, to level 5, where the development process is in a continuous improvement mode. A brief description of each level is presented in Sidebar 1. Data was collected by a survey questionnaire4 (see Sidebar 2). After an initial pilot test with senior IS managers and development personnel in five organizations, the survey was mailed to systems development managers drawn from a directory of senior IS executives5 compiled by a market research firm. The survey was mailed to 708 manufacturing and service organizations. We asked respondents to assess their current systems development process in terms of the questions we posed. Respondents indicated their impressions of their development environment using a 7-point scale ranging from strongly agree to strongly disagree. The responses were grouped by the perceptions of level of process maturity of the respondents, enabling us to contrast infrastructure characteristics across levels of process maturity. A total of 123 responses were received after two mailings, giving us a response rate of 18.14%. Of these, 110 questionnaires were usable for analysis. No significant differences were detected between levels of maturity and organization size, IS budget, and ISD size.6 Our findings are consistent with Herbsleb et al. who found no differences in process capability related to organizational size [6]. Demographic characteristics of our sample include: • • •
Average revenues of 1.4 billion dollars; Average IS Budget of 9.34 million dollars; and Average IS department size of 60 full time employees, with half directly associated with systems development activities.
The survey consisted of several other questions and was part of a study larger in scope. Directory of Top Computer Executives, Applied Computer Research, Phoenix, AZ, 1996. 6 One-Way ANOVA was used to test for difference between groups. Results should be interpreted with caution because number of organizations at level 4 and 5 is 8 and 12 respectively which is considered low for statistical inference. 4 5
COMMUNICATIONS OF THE ACM April 2002/Vol. 45, No. 4ve
203
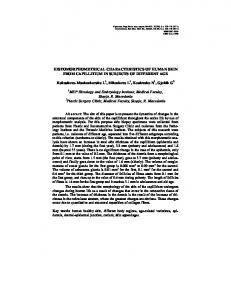
Study Results Technology infrastructure. We found most organizations use a variety of development tools, but tools produced by any single vendor are not used by more than 25% of the organizations in the sample. About 46% of the respondents indicated their development tools support the entire development life cycle, either through an integrated CASE tool solution or more commonly by a multi-tool, multi-vendor solution. How does the domain of activities supported by the tool portfolio change with the level of process maturity? The proportion of organizations using development tools supporting the entire life cycle increases as we move from level 1 to level 3, and then marginally drops as we move to levels 4 and 5. This drop is not statistically significant. Thus, increasing the level of automation support to encompass a larger span of life cycle activities appears to support the transition from level 1 to levels 2 and 3, but may not be an important element in transitions to highest levels of process maturity (see Figure 2). We compared integration in the technology infrastructure in terms of tool integration and object integration across different levels of maturity. We computed an average score for the items used to measure these integration items and then contrasted the average scores across the levels of process maturity (see Figure 3). Both tool integration and object integration increase as process maturity increases to level 4.7 While a drop in the level of integration is observed as we move from level 4 to level 5, the small number of level 5 organizations make it untenable to statistically assess the significance of this drop. The most substantial increases occur as we move from level 1 to level 2. The observed trends suggest enhancing integration of development technology infrastructure promotes a transition to higher levels of process maturity. An environment of enhanced integration where support tools communicate with
Figure 2. Domain of support across levels of maturity.
One-way ANOVA was used to compare means across groups. Contrasts between each level and the next level were also done to do a pair wise comparison of means. Levene’s test for homogeneity of variance indicated that variance was homogenous across groups for tool integration but borderline at p=0.05 for object integration. Accordingly, in the case of contrasts for object integration, unequal variance was assumed.
7
204
April 2002/Vol. 45, No. 4ve COMMUNICATIONS OF THE ACM
Figure 3. Tool and object integration across levels of maturity.
each other, and the integrity and inter-relatedness of development objects is maintained, helps attain higher maturity levels. We assessed process restrictiveness in terms of choice of techniques available to developers, checks and controls embedded in the process, and sequences of activities enforced by the process. To assess flexibility, each response was subtracted from 8 as all items in this scale were reverse coded; thus, a value of 1 means high restrictiveness and low flexibility, while a score of 7 means low restrictiveness and high flexibility. The average score on the four items was used as a measure of flexibility. Interestingly, no statistically significant differences were detected in flexibility across levels of maturity. Thus, organizations at higher levels of maturity are not characterized by a higher level of process flexibility than organizations at lower levels of maturity. Measurement system characteristics. We used four items to assess the degree to which measurement systems are used in the development process and how such usage characteristics differ across levels of process maturity. These items pertain to metrics definition, automatic collection of metrics, information generation and distribution about project status, and deployment of metrics for management of the development process. The average score on each of these dimensions at different maturity levels is shown in Figure 4. Systems development managers in organizations at levels 1 and 2 of the process maturity scale reported metrics-based management was not used in their organizations. For each of the four items, a statistically significant difference was detected between organizations at low process maturity levels 1 and 2, and organizations at level 3. In general, managers of organizations at high levels of process maturity agreed that information on project status was available, and that metrics were used to manage development projects in their organizations. Performance. The bottom line for any organizational initiative is the impact on key outcomes. Managers are interested in knowing the impacts of their process improvement initiatives on product quality, productivity, and customer satisfaction. We found improvements in each of the three dimensions of performance, namely productivity, quality, and customer satisfaction, to be associated with higher levels of process maturity (see Figure 5). Our results suggest process maturity enhances system reliability, reduces system errors, and enhances adherence to schedules and budgets. COMMUNICATIONS OF THE ACM April 2002/Vol. 45, No. 4ve
205
Figure 4. Metric-based management.
Figure 5. Performance of the development process.
Our results also suggest that development productivity and customer satisfaction are both enhanced as organizations move to higher levels of maturity. Table 1 shows the correlation between infrastructure characteristics and the three aspects of performance we examined. No significant associations were detected between IS department size, as assessed by the number of full time employees, and aspects of performance. Nor was there a significant correlation detected between process flexibility and performance. This is not surprising, as we did not detect significant variations in flexibility across levels of maturity. Each of the other infrastructure characteristics examined here correlated significantly with the three facets of performance. 206
April 2002/Vol. 45, No. 4ve COMMUNICATIONS OF THE ACM
Table 1. Correlation analysis of development infrastructure characteristics with performance.
Improving Performance Outcomes How can IS managers improve their development performance? IS managers should direct their attention to specific elements of the technology infrastructure and measurement systems which, in turn, should enable transitions to higher levels of process maturity and improved performance outcomes. Organizations at higher levels of process maturity have significantly higher levels of product quality, customer satisfaction, and process efficiency. They also have more sophisticated development infrastructure capabilities. Our results indicate that: •
•
•
•
As more development tools are used to support development tasks, the development process improves. When tools support a greater proportion of tasks, inputs and outputs become relatively standardized, enhancing the predictability and manageability of the overall development process. The development infrastructure should be integrated across different stages of the development process. Tool and object integration make it easier for early development activities to be compatible with associated downstream technologies and activities. Emphasis on technical integration and semantic integration across the development process reduces the nature and scope for errors, promotes reusability, and enhances productivity. Flexibility of the development infrastructure, as assessed in our study, does not relate to process maturity. However, rigid infrastructures restrict the development process from adapting to shifting development needs. Such misalignment between the development infrastructure and shifting development needs may negatively impact performance consequences. The collection, distribution, and use of development process metrics positively impact performance. The management-by-fact approach to improvement espoused in programs such as Total Quality Management enhances awareness of shortcomings during the development process. For an organization to move to a higher level of process maturity, problems with the process need to be detected, and their underlying causes need to be understood. Such knowledge can be generated by systematically measuring process activities and outcomes, and analyzing collected data. COMMUNICATIONS OF THE ACM April 2002/Vol. 45, No. 4ve
207
References
1. Banker, R.D. and Kauffman, R.J. Reuse and productivity in integrated computer-aided software engineering: an empirical study. MIS Quarterly 15, 3 (1991), 375–401. 2. Bate, R., Garcia, S., Armitage, J., Cusick, K., Jones, R., Kuhn, D., Minnich, I., Pierson, H., Powell, T., and Reichner, A. A Systems Engineering Capability Maturity Model, Version 1.0. Software Engineering Institute, Carnegie Mellon University, Pittsburgh, PA CMU/SEI-94HB-4 1994. 3. Broadbent, M. and Weill, P. Management by maxim: how businesses and IT managers can create IT infrastructure. Sloan Management Review 38, 3 (1997), 77–92. 4. Finlay, P.N. and Mitchell, A.C. 1994. Perceptions of benefits from the introduction of CASE: an empirical study. MIS Quarterly 18, 4 (1994), 353–370. 5. Forte, G. and Norman, R.J. A self-assessment by the software engineering community. Commun. ACM 35, 4 (1992), 28–32. 6. Herbsleb, J., Zubrow, D., Goldenson, D., Hayes, W., and Paulk, M. Software quality and the Capability Maturity Model. Commun. ACM 40, 6 (June 1997), 30–40. 7. Johnson, J. Chaos: the dollar drain of IT project failures, Application Development Trends 2,1 (1995), 41–47. 8. Mi, P. and Scacchi, W. Process Integration in CASE Environments. IEEE Software. (March 1992), 45–53. 9. Silver, M.S. Systems that Support Decision Makers: Description and Analysis. John Wiley and Sons, New York, 1991. 10. Stobart, C., Thompson, J.B., and Smith, P. Use, problems, benefits, and future direction of Computer-Aided Software Engineering in United Kingdom. Information and Software Technology 33, 9. (1991), 629–637. 11. Yellen, R.E. System Analysts Peformance Using CASE versus Manual Methods. Proceedings of the Twenty-third Annual Hawaii International Conference on System Sciences (1990), 497–501.
Sidebar I. Software Engineering Institute’s Capability Maturity Model The Capability Maturity Model (CMM) developed by Software Engineering Institute at Carnegie Mellon is a framework for appraising the process capabilities for software development. It serves as a normative model for helping organizations chart their progress from ad hoc, chaotic processes to more mature, disciplined processes. For more details on CMM and appraisal techniques visit the Software Engineering Institutes Website at www.sei.cmu.edu/. CMM consists of five maturity levels, as shown below. 1. Initial. Informally performed development process largely dependent on individual effort and skills for success. Few base practices exist and the process is often characterized as ad hoc or chaotic. 208
April 2002/Vol. 45, No. 4ve COMMUNICATIONS OF THE ACM
2. Repeatable. More planning and tracking of the development process. Enough process discipline and project management to repeat earlier success in similar contexts. 3. Defined. Standard processes for development are defined, documented, and performed 4. Managed. A quantitatively controlled process with objectively managed performance. Detailed measures of the development process and system quality are collected. Measurable quality and process goals are established 5. Optimizing. Continuous improvement in process capability and effectiveness.
Sidebar II: Survey Questions. Domain of Support Our portfolio of development tools is mainly Full-life cycle Front-end analysis and design GUI client development Back-end construction Other (please specify)__________ Respondents were asked to use the following 7 point scale to respond to each of the statements SD=Strongly Disagree D=Disagree DS=Strongly Disagree N=Neutral AS=Agree Slightly A=Agree SA= Strongly Agree Object Integration • Modifications made to development information (such as logical models, requirements data etc.) in a particular task/phase are communicated to related tasks/phases. • Logical models remain consistent across different development tasks/phases. • No semantic information (such as entity definitions) is lost in moving from one task/phase of development to another. • Development information is easily portable from one development task/phase to other tasks/phases. Tool Integration • Data generated during a particular task/phase of systems development is easily accessed by related tasks/phases. • Same formats and operating conventions are used by development tools across different tasks/phases.
COMMUNICATIONS OF THE ACM April 2002/Vol. 45, No. 4ve
209
Flexibility • Our development tools allow us to use any development technique. • Checks and controls embedded in development can be overridden. • Development can only be done in a predetermined sequence that is defined by the portfolio of development tools. • Checks and controls embedded in development tools constrain our development process. Metrics-based management • Collection of project metrics is automated. • Project metrics have been defined. • Information on project status is always available. • Metrics were used to manage development projects Customer satisfaction • Users are satisfied with developed systems. • Users are satisfied with the overall quality of developed systems. • Users are dissatisfied with the lead time for systems delivery. Product quality • Systems that have been developed have high reliability. • Fixing bugs and other rework account for a significant proportion of our development effort. Process Performance • Projects finish within budgets. • Projects finish on schedule. • Productivity of our development staff is high compared to other IS organizations in similar environments. Process Maturity Please indicate the level (from 1 to 5) that best characterizes the development process for the projects using your portfolio of development tools as per Software Engineering Institute’s Capability Maturity framework. Brief descriptions of each of the levels is given below. 1. Ad-hoc, without formalized procedures, cost estimates and project plans. 2. Stable and repeatable process based on accumulated experience of individuals, some project controls and metrics, but no process framework used. 3. A defined process that is consistently implemented across projects. Sufficient data is collected to analyze process efficiency 4. A managed process with comprehensive and defined process measurements. Systematic record of process performance measures is maintained. 5. In a continuous improvement mode for optimizing the process.
This research project was partially supported by a research grant received from the Pontikes Center for the Management of Information at Southern Illinois University at Carbondale.
210
April 2002/Vol. 45, No. 4ve COMMUNICATIONS OF THE ACM