applied sciences Article
Development of a High-Precision Touch-Trigger Probe Using a Single Sensor † Rui-Jun Li 1,2, *, Meng Xiang 1 , Ya-Xiong He 1 , Kuang-Chao Fan 1,3 , Zhen-Ying Cheng 1 , Qiang-Xian Huang 1 and Bin Zhou 1,2 1
2 3
* †
School of Instrument Science and Opto-electric Engineering, Hefei University of Technology, Hefei 230009, China;
[email protected] (M.X.);
[email protected] (Y.-X.H.);
[email protected] (K.-C.F.);
[email protected] (Z.-Y.C.);
[email protected] (Q.-X.H.);
[email protected] (B.Z.) Anhui Electrical Engineering Professional Technique College, Hefei 230051, China Department of Mechanical Engineering, National Taiwan University, Taipei 10617, Taiwan Correspondence:
[email protected]; Tel./Fax: +86-551-6290-3823 This paper is an extended version of paper published in the 9th International Symposium on Precision Engineering, Measurements and Instrumentation conference (ISPEMI9), Changsha, China, 8–11 August 2014.
Academic Editor: Chien-Hung Liu Received: 30 January 2016; Accepted: 14 March 2016; Published: 18 March 2016
Abstract: To measure various components with nano-scale precision, a new high-precision touch-trigger probe using a single low-cost sensor for a micro-coordinate measuring machine (CMM) is presented in this paper. The sensor is composed of a laser diode, a plane mirror, a focusing lens, and a quadrant photo detector (QPD). The laser beam from the laser diode with an incident angle is reflected by the plane mirror and then projected onto the quadrant photo detector (QPD) via the focusing lens. The plane mirror is adhered to the upper surface of the floating plate supported by an elastic mechanism, which can transfer the displacement of the stylus’s ball tip in 3D to the plane mirror’s vertical and tilt movement. Both motions of the plane mirror can be detected by respective QPDs. The probe mechanism was analyzed, and its structural parameters that conform to the principle of uniform sensitivity and uniform stiffness were obtained. The simulation result showed that the stiffness was equal in 3D and less than 1 mN/µm. Some experiments were performed to investigate the probe’s characteristics. It was found that the probe could detect the trigger point with uniform sensitivity, a resolution of less than 5 nm, and a repeatability of less than 4 nm. It can be used as a touch-trigger probe on a micro/nano-CMM. Keywords: touch-trigger probe; stiffness; quadrant photo detector; coordinate measuring machine
1. Introduction With the development of various micro-fabrication technologies, many miniaturized structures and components with nano-scale precision have been produced in recent twenty years. Accordingly, many micro-/nano-coordinate measuring machines (micro-/nano-CMMs) have been proposed to satisfy the urgent demand for the dimensional measurement of micro parts [1–4]. Many touch probing systems that can be equipped onto micro-/nano-CMMs have also been developed, such as (a) the capacitive probe that uses at least three high-precision capacitive sensors to detect the arm’s displacement of the floating plate of the probe [5,6], (b) the strain gauge probe that adheres strain gauges on the membrane or cantilevers symmetrically to detect the ball tip’s motion using the piezo-resistive effect [7–10], (c) the inductive probe that uses three high-precision inductive sensors and a complicated flexure hinges to construct the probe head [11], (d) the fiber probe that uses the imaging system to detect the ball tip’s motion [12–14] or uses long Bragg gratings to detect the axial
Appl. Sci. 2016, 6, 86; doi:10.3390/app6030086
www.mdpi.com/journal/applsci
Appl. Sci. 2016, 6, 86
2 of 11
motion of the probe tip [15] or its 3D motion [16,17], and (e) the optical sensing probe that uses different Appl. Sci. 2016, 6, 86 2 of 11 optical principles to detect the probe motion, such as position detector, focus sensor, interferometer, auto-collimator, etc. [18–26]. Although allthe theprobe abovemotion, probes such haveas good sensitivity, accuracy, resolution, different optical principles to detect position detector, focus sensor, interferometer, auto‐collimator, etc. [18–26]. Although all the ranges above probes have good repeatability, and stiffness, their permissible measurement are limited sincesensitivity, their adopted accuracy, resolution, repeatability, and stiffness, their permissible measurement ranges are limited sensors do not tolerate a large tilt or a large translation of the probe tip. In addition, due to the use of since their adopted sensors 3D do motions not tolerate a large tilt their or a costs large are translation of the probe tip. In multiple sensors for detecting of the probe, still high. addition, due to the use of multiple sensors for detecting 3D motions of the probe, their costs are The QPD (quadrant photo detector)-based angle sensor has high accuracy and high sensitivity, still high. which has been verified in some probes [20,25,26], especially in Atomic Force Microscope (AFM) [23]. The QPD (quadrant photo detector)‐based angle sensor has high accuracy and high sensitivity, A new touch-trigger probe with a simple structure, small size, and low cost is proposed in this paper. which has been verified in some probes [20,25,26], especially in Atomic Force Microscope (AFM) Only [23]. A new touch‐trigger probe with a simple structure, small size, and low cost is proposed in this one QPD-based two-dimensional angle sensor is used in this probe, which can simultaneously detectpaper. the trigger signals of the probe tip in 3D. Targets of theis probe’s include: (1) can that the Only one QPD‐based two‐dimensional angle sensor used in design this probe, which permissible range ofdetect the probe is moresignals than ˘6 (2) that the has equal sensitivity and equal simultaneously the trigger of µm; the probe tip in probe 3D. Targets of the probe′s design include: (1) that the permissible range of the probe is more than ±6 μm; (2) that the probe has equal stiffness in three dimensions; (3) that the stiffness is less than 1 mN/µm; (4) that the repeatability sensitivity and equal stiffness in three dimensions; (3) that the stiffness is less than 1 mN/μm; (4) that of trigger measurement is less than 5 nm (K = 2); and (5) that the cross-sectional diameter is less the mm. repeatability of trigger measurement is less than 5 nm of (K = and (5) that the cross‐sectional than 40 The design principle and optimal parameters the2); innovative touch-trigger probe are diameter is less than 40 mm. The design principle and optimal parameters of the innovative addressed in this paper. Experimental results also show the characteristics of the probe. touch‐trigger probe are addressed in this paper. Experimental results also show the characteristics of
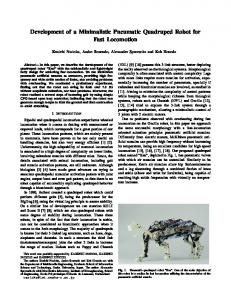
the probe. 2. Structure and Principle 2. Structure and Principle This touch trigger probe, shown in Figure 1, mainly consists of three components: a QPD-based sensor, a floating plate, and a tungsten stylus with a ruby ball tip. A plane mirror is adhered to the This touch trigger probe, shown in Figure 1, mainly consists of three components: a QPD‐based uppersensor, a floating plate, and a tungsten stylus with a ruby ball tip. A plane mirror is adhered to the surface of the floating plate. The stylus is mounted on the center position on the lower surface of theupper surface of the floating plate. The stylus is mounted on the center position on the lower surface floating plate. Four V-shaped leaf springs, fixed to the probe housing, are designed to connect of the floating plate. Four V‐shaped leaf springs, fixed to the probe housing, are designed to connect the floating plate. When a contact force is applied to the ball tip of the stylus, the floating plate and the floating plate. When a contact force is applied to the ball tip of the stylus, the floating plate and the stylus perform a rigid body motion. Simultaneously, the four leaf springs yield corresponding the stylus perform a rigid body motion. Simultaneously, the four leaf springs yield corresponding elastic deformations by the floating plate, and the plane mirror on the floating plate tilts along elastic deformations by the floating plate, and the probe plane housing mirror on floating tilts along horizontal axes or displaced in the vertical axis. The is the made of an plate aluminum cylinder. horizontal axes or displaced in the vertical axis. The probe housing is made of an aluminum The QPD, the focus lens, and the circuit board are imbedded in the probe. A laser diode is placed on cylinder. The QPD, the focus lens, and the circuit board are imbedded in the probe. A laser diode is an adjusting mechanism whose elastic component is formed by folding a beryllium–copper alloy sheet. placed on an adjusting mechanism whose elastic component is formed by folding a The adjusting mechanism is applied to assure the reflected laser beam being focused onto the centre of beryllium–copper alloy sheet. The adjusting mechanism is applied to assure the reflected laser beam the QPD in the initial state. being focused onto the centre of the QPD in the initial state. Փ 40
Circuit board
Laser diode and adjusting mechanism QPD Focus lens
Mirror Leaf springs Floating plate
Stylus
Figure 1. The sketch map of the probe.
Figure 1. The sketch map of the probe.
Figure 2 shows the optical path of the sensor system, which is composed of a laser diode, a plane mirror, a focusing lens, and a QPD. The laser beam from the laser diode with an incident angle Figure 2 shows the optical path of the sensor system, which is composed of a laser diode, a plane is reflected by the plane mirror and then projected onto the QPD via the focusing lens. A tilt angle or mirror, a focusing lens, and a QPD. The laser beam from the laser diode with an incident angle is a vertical displacement of the plane mirror causes a lateral shift of the focused light spot on the QPD. reflected by the plane mirror and then projected onto the QPD via the focusing lens. A tilt angle or a vertical displacement of the plane mirror causes a lateral shift of the focused light spot on the QPD.
Appl. Sci. 2016, 6, 86 Appl. Sci. 2016, 6, 86
3 of 11 3 of 11
The QPD outputs the light energy of each quadrant photo detector into an electrical current signal. The QPD outputs the light energy of each quadrant photo detector into an electrical current signal. By applying an appropriate resistance to these current signals, four output voltage signals (VA, VB, By applying an appropriate resistance to these current signals, four output voltage signals (V A , V B , VC, and VD) can be obtained. Two‐dimensional shifts of the focused light spot caused by the motion V C , and V D ) can be obtained. Two-dimensional shifts of the focused light spot caused by the motion of the plane mirror can be expressed by Equations (1) and (2), in which k1 and k2 are constants [26]. of the plane mirror can be expressed by Equations (1) and (2), in which k1 and k2 are constants [26]. When the ball tip is contacted in any direction by the workpiece, the probe generates a trigger signal When the ball tip is contacted in any direction by the workpiece, the probe generates a trigger signal at at the same time. the same time. xx“ kk11 rpV `C VC qs BV q´VpV (1) (1) DD B VAA `VV y “ k2 rpVA ` VB q ´ pVC ` VD qs y k2 VA VB VC VD
(2) (2)
Laser Diode
Laser Diode QPD
QPD
Focusing Lens
Z
Plane Mirror
X
Focusing Lens
Z
Plane Mirror
X
(a)
(b)
Figure 2. Optical paths of the sensor. (a) Mirror in vertical displacement and (b) mirror in tilt motion. Figure 2. Optical paths of the sensor. (a) Mirror in vertical displacement and (b) mirror in tilt motion.
3. Analysis and Design of the Probe 3. Analysis and Design of the Probe 3.1. The Sensitivity Analysis 3.1. The Sensitivity Analysis The Theprinciple principleof ofdetecting the detecting theZ‐motion Z-motionof ofthe theprobe, probe,when whenthe theball balltip is tip istouched touchedalong alongthis this direction, is shown in Figure 3. The optical beam with an incidence angle of α is reflected by plane the direction, is shown in Figure 3. The optical beam with an incidence angle of α is reflected by the plane mirror and focused onto the QPD. The reflected beam is shifted from point D to point E on the mirror and focused onto the QPD. The reflected beam is shifted from point D to point E on the focusing focusing lens, and the focused spot is shifted from point B to point C on the QPD if the QPD is placed lens, and the focused spot is shifted from point B to point C on the QPD if the QPD is placed in front of in front the of focal of the lens. From the geometrical Figure have the focalof point the point lens. From the geometrical relationship inrelationship Figure 3, wein have sin α3, “we pFG{FHq (δv is the vertical displacement of the probe tip). The line of FI is and “ δ/ vFH (δv) isand the vertical sin FG ( FG FG = v displacement of the probe tip). The line of FI is perpendicular to the line of AH so that perpendicular to the line of AH so that sin=FH I “ sinpπ ´ 2αq “ sin p2αq “ FI{FH (3) sin FHI sin( 2 ) sin 2 FI / FH (3) Therefore, DE “ FI “ 2 ¨ δv ¨ cos α (4) Therefore, Because pAD{ABq “ pDE{BCq, and AD (the focal length of the focusing lens) and BD are donated (4) DE FI 2 v cos by f and m, respectively, we have “ 2 ¨AD δv ¨ p1(the ´ m{ f q ¨ cos α of the focusing lens) and BD(5) Because ( AD / AB) = ( DE / BC )BC , and focal length
are donated by f and m, respectively, we have The output voltage (Uv ) from QPD is proportional to the displacement of the focused spot (BC), namely, Uv “ k ¨ BC and k is a constant. in the vertical direction can (5) be BC 2 Therefore, v (1 m /the f ) sensitivity cos obtained as: Sv “ Uv {S ¨ cosdisplacement α (6) The output voltage ( U v ) from QPD is proportional to of the focused spot v “ 2k ¨ p1 ´ m{ f q the ( BC ), namely, U v k BC and k is a constant. Therefore, the sensitivity in the vertical direction can be obtained as: Sv
Uv
Sv
2k 1 m
cos f
(6)
Appl. Sci. 2016, 6, 86 Appl. Sci. 2016, 6, 86
4 of 11 4 of 11
Z X
Figure 3. Detecting principle of the probe in Z‐motion.
In the same way, the principle of the detecting probe in a horizontal tilt motion, when the probe Z
tip is touched in the horizontal direction and results in a h displacement is shown in Figure 4. X The rotated angle and the length of the stylus are denoted as θ and l, respectively. From the geometrical relationship of the optical path, we have MN DE and ON OD n . Because, in Figure 3. Detecting principle of the probe in Z‐motion. Figure 3. Detecting principle of the probe in Z-motion.
practice, θ is very small, it is assumed sin ( h / l ) . The stylus and the floating plate can be In the same way, the principle of the detecting probe in a horizontal tilt motion, when the probe NOM 2 , so that regarded as a rigid body and In the same way, the principle of thedetecting probe in a horizontal tilt motion, when the probe tip tip is touched in the horizontal direction and results in a h displacement is shown in Figure 4. is touched in the horizontal direction and results in a δh displacement is shown in Figure 4. The rotated The rotated angle and the length of the stylus are denoted as θ respectively. From (7) the ( MNas/θON ( DE / n ) 2From and thel, geometrical angle and the length of the stylustan are2denoted and) l,respectively. relationship of the opticalrelationship path, we have MNoptical « DE and ON OD “MN n. Because, in ON practice, small, in it . Because, geometrical of the path, we «have DE and ODθisn very (8) is assumed sin θ “ pδh {lq « θ. The stylus and the floating plate can be regarded as a rigid body and DE 2n / l practice, θ is very small, it is assumed sin ( h / lh) . The stylus and the floating plate can be =NOM “ 2θ, so that tan NOM 2) /, so that regarded as a rigid body and pMN{ONq « 2θ, the horizontal sensitivity can be (7) Because AB / AD BC / DE 2θ (f “ m f and “UpDE{nq h k BC obtained:
DE/ ON “ 2nδ tan 2 ( MN ) h {l( DE / n ) 2
(8) (7)
U Because AB{AD “ BC{DE “ the horizontal sensitivity can nk Uh(1“ Sh pf ´h mq{f 2and mk ¨ )BC, (9) l f (8) DE 2 n / l h be obtained: h Sh “ Uh {δh “ p2nk{lq ¨ p1 ´ m{ f q (9) In order to have the characteristic of uniform sensitivity, we can let Equation (6) be equal to Because AB / AD BC / DE ( f m) / f and U h k BC , the horizontal sensitivity can be Equation (9), yielding: In order to have the characteristic of uniform sensitivity, we can let Equation (6) be equal to obtained: Equation (9), yielding: n cos n{l (10) (10) l U h cos α2“ nk Sh (1 m ) (9) l f h
In order to have the characteristic of uniform sensitivity, we can let Equation (6) be equal to Equation (9), yielding:
cos n
(10)
l
Z X
Figure 4. Detecting principle of the probe in horizontal tilt motion. Figure 4. Detecting principle of the probe in horizontal tilt motion.
3.2. The Stiffness Analysis
Z
The free-body diagram of the floating plate is illustrated in Figure 5. T, P, M, F are torque, shear X force, bending moment, and contact force, respectively. The characteristics of this probe between Figure 4. Detecting principle of the probe in horizontal tilt motion.
Appl. Sci. 2016, 6, 86
5 of 11
3.2. The Stiffness Analysis The free‐body diagram of the floating plate is illustrated in Figure 5. T, P, M, F are torque, shear Appl. Sci. 2016, 6, 86 5 of 11 force, bending moment, and contact force, respectively. The characteristics of this probe between the contact force and the ball tip′s motion were analyzed, and the stiffness models in horizontal and vertical directions are as follows [26,27]. the contact force and the ball tip’s motion were analyzed, and the stiffness models in horizontal and vertical directions are F 4 as follows [26,27]. Ky y 3 2 GJL2 +2 EI 6r 2 +3r sin +3rL sin +L +2 EI 6a 2 +3a cos +3aL cos +L (11) b,y L l ` ˘ ` ˘‰ 4 “ Ky “ Fy {δb,y “ 3 2 GJL2 ` 2EI 6r2 ` 3r sin β ` 3rL sin β ` L ` 2EI 6a2 ` 3a cos β ` 3aL cos β ` L (11) L l
KZ
Z
96EI L3 96EI
(12)
(12) “ δb,Z L3 E wt wt 16 t ; t, w, and L are the thickness, width, and where I wt3 , J wt3 16 ( 3.36 t ) , and G E 2(1 ) where I “ 12 , J “ 16p 3´ 3.36 wq, and G “ ; t, w, and L are the thickness, width, and 12 16 3 w 2p1 ` νq length of the leaf springs, respectively; E and ν are Youngʹs modulus and Poisson′s ratio of the leaf length of the leaf springs, respectively; E and ν are Young’s modulus and Poisson’s ratio of the leaf springs, respectively; l is the length of the stylus; r is the arm length of the floating plate; and a is springs, respectively; l is the length of the stylus; r is the arm length of the floating plate; and a is one‐half of the arm width. one-half of the arm width. 3
KZ “
FZ
Fb, Z
3
2T1X 2M1X 2PZ2a
2M2X
r
2PZ1 2PZ2a
2T2X 2PZ1
2T2X
l FY
z
2M1X 2T1X
2M2X
Y
x
Figure 5. Free‐body diagram of the floating plate. Figure 5. Free-body diagram of the floating plate.
3.3. Optimal Design for the Probe 3.3. Optimal Design for the Probe The optimal parameters parameters of the probe (see Table have been evaluated to the The optimal of the probe (see Table 1) have1) been evaluated according according to the constrained constrained conditions that the limited stiffness should be less than 1 mN/μm, conditions that the limited stiffness should be less than 1 mN/µm, i.e., Kv = Kh ď 1 mN/µm, and i.e., the the maximum cross‐sectional diameter of than the probe Kv Kh 1cross-sectional mN / μm , and diameter maximum of the probe head should be smaller 40 mm.head should be smaller than 40 mm. Table 1. The parameters of the probe.
Table 1. The parameters of the probe. Parameter
Value
Parameter Value Material of the leaf springs beryllium-copper alloy Material of the leaf springs beryllium‐copper alloy Young’s modulus of the leaf springs (GPa) 130 Young′s modulus of the leaf springs (GPa) Leaf thickness ˆ width ˆ length (mm) 0.1 ˆ 2130 ˆ 13 Material of the floating plate aluminum alloy Leaf thickness × width × length (mm) 0.1 × 2 × 13 Young’s modulus of the floating plate (GPa) 71 Material of the floating plate aluminum alloy floating plate arm thickness ˆ width ˆ length (mm) 1.5 ˆ 2 ˆ 5.5 Young′s modulus of the floating plate (GPa) 71 Weight of the floating plate (g) 0.2 floating plate arm thickness × width × length (mm) 1.5 × 2 × 5.5 Material of the stylus tungsten stylus with a ruby ball tip Young’s modulus of the stylus (GPa) 1930.2 Weight of the floating plate (g) Length of the stylus (mm) 10 Material of the stylus tungsten stylus with a ruby ball tip Diameter of the ball tip (mm) 0.5 Young′s modulus of the stylus (GPa) 193 Length of the stylus (mm) 10 Moreover, based on the constrained conditions of uniform sensitivity0.5 (Equation 10) and the Diameter of the ball tip (mm) measurement range being at least ˘6 µm, the other optimal parameters have also been obtained as: α = 53˝ , f = 9.8 mm, n = 6 mm, and m = 4.9 mm. A finite element analysis for the probe was also performed using ANSYS V15 software (Ansys Inc, Canonsburg, PA, USA, 2014) so as to verify the stiffness model. The parameters listed in Table 1 were used. Structural deformations are shown in Figure 6a,b when 1 mN of force is applied in the
Moreover, based on the constrained conditions of uniform sensitivity (Equation 10) and the measurement range being at least ±6 μm, the other optimal parameters have also been obtained as: α = 53°, f = 9.8 mm, n = 6 mm, and m = 4.9 mm. A finite element analysis for the probe was also performed using ANSYS V15 software (Ansys Inc, Canonsburg, PA, USA, 2014) so as to verify the stiffness model. The parameters listed in Table 1 Appl. Sci. 2016, 6, 86 6 of 11 were used. Structural deformations are shown in Figure 6a,b when 1 mN of force is applied in the vertical and horizontal directions, respectively. The resulting tip displacement of nearly 1 μm is vertical the and same horizontal directions, respectively. The resulting tip displacement 1 µmFigure is almost almost in both directions, corresponding to a uniform stiffness of of nearly 0.926 μm. 6c the same in both directions, corresponding to a uniform stiffness of 0.926 µm. Figure 6c illustrates the illustrates the uniformity of the probe′s stiffness along the X‐Y plane. In addition, the experimental uniformity of the probe’s stiffness along the X-Y plane. In addition, the experimental verification for verification for the stiffness of the floating mechanism was also conducted using a high sensitivity the stiffness of the floating mechanism was also conducted using a high sensitivity force sensor [26]. force sensor [26]. The stiffness measurements were 0.954 N/mm in the Z‐direction and 0.927 N/mm The stiffness measurements were 0.954 N/mm in the Z-direction and 0.927 N/mm in the horizontal in the horizontal direction, which is quite consistent with the finite element analysis and analytical direction, which is quite consistent with the finite element analysis and analytical results [27]. results [27].
(a)
(b)
(c) Figure 6. The tip′s displacements when being touched by 1 mN force. (a) Touched in Z direction; (b) Figure 6. The tip’s displacements when being touched by 1 mN force. (a) Touched in Z direction; touched in Y direction and (c) touched with a different angle in XY plane. (b) touched in Y direction and (c) touched with a different angle in XY plane.
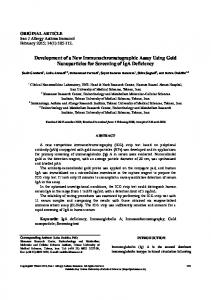
4. Experimental Results and Discussion 4. Experimental Results and Discussion In order to test the performance of the designed probe, an experimental setup was carried out. As shown in Figure 7, a stable stand frame was used to hold the probe. Four high accuracy gauge blocks were used to form a 2 mm ˆ 2 mm square hole, which was able to contact the ball tip from different horizontal directions. A ball tip of 1 mm diameter was adopted. The clamped set of gauge blocks were mounted on a high-precision 3D nano-positioning stage made by Physik Instrumente (PI,
Appl. Sci. 2016, 6, 86
7 of 11
In order to test the performance of the designed probe, an experimental setup was carried out. In order to test the performance of the designed probe, an experimental setup was carried out. As shown in Figure 7, a stable stand frame was used to hold the probe. Four high accuracy gauge As shown in Figure 7, a stable stand frame was used to hold the probe. Four high accuracy gauge blocks were used to form a 2 mm × 2 mm square hole, which was able to contact the ball tip from blocks were used to form a 2 mm × 2 mm square hole, which was able to contact the ball tip from Appl. Sci. 2016, 6, 86 7 of 11 different horizontal directions. A ball tip of 1 mm diameter was adopted. The clamped set of gauge different horizontal directions. A ball tip of 1 mm diameter was adopted. The clamped set of gauge blocks were mounted on a high‐precision 3D nano‐positioning stage made by Physik Instrumente blocks were mounted on a high‐precision 3D nano‐positioning stage made by Physik Instrumente (PI, model P‐561.3CD with a repeatability of 2 nm and a distance of travel of 100 μm in each model P-561.3CD with with a repeatability of 2 nm a distance of travel 100 µm each (PI, model P‐561.3CD a repeatability of and 2 nm and a distance of oftravel of in 100 μm direction, in each direction, Physik Instrumente Co. Ltd., Karlsruhe, Germany). A normal 2D high‐precision stage was Physik Instrumente Co. Ltd., Karlsruhe, Germany). A normal 2D high-precision stage was used to direction, Physik Instrumente Co. Ltd., Karlsruhe, Germany). A normal 2D high‐precision stage was used to manually adjust the initial position of the square hole. A Data Acquisition (DAQ) card from manually adjust the initial position of the square hole. A Data Acquisition (DAQ) card from National used to manually adjust the initial position of the square hole. A Data Acquisition (DAQ) card from National Instruments (PCI‐6251, National Instruments Co. Ltd., Austin, TX, USA) was use to Instruments (PCI-6251,(PCI‐6251, National Instruments Co. Ltd., Austin, TX,Austin, USA) was to recorded National Instruments National Instruments Co. Ltd., TX, use USA) was use the to recorded the voltage signals from the angle sensor. recorded the voltage signals from the angle sensor. voltage signals from the angle sensor.
Probe Probe
40 mm 40 mm 10 mm mm 10
Square hole hole Square PI PIStage Stage
Figure 7. Photo of the experimental setup. Figure 7. Photo of the experimental setup. Figure 7. Photo of the experimental setup.
4.1. Probe Drift 4.1. Probe Drift 4.1. Probe Drift In order to reduce the influence of environmental temperature temperature fluctuation, fluctuation, a aa low‐cost low‐cost In order order to to reduce reduce the the influence of the the environmental environmental In temperature fluctuation, low-cost vibration‐free constant‐temperature mini chamber was developed by our group [28,29]. The vibration‐free constant‐temperature chamber was developed by our group [28,29]. The vibration-free constant-temperature mini chamber was developed by our group [28,29]. experimental setup, as shown in Figure 7, was put in the chamber, and the probe was adjusted to experimental setup, as shown in Figure 7, was put in the chamber, and the probe was adjusted to The experimental setup, as shown in Figure 7, was put in the chamber, and the probe was adjusted to output a non‐zero value. The stability of the probe was not investigated until the temperature in the output a non‐zero value. The stability of the probe was not investigated until the temperature in the output a non-zero value. The stability of the probe was not investigated until the temperature in the chamber had been stabilized to within 20 ± 0.05 °C, as shown in Figure 8. Figure 9 shows the stability chamber had been stabilized to within 20 ± 0.05 °C, as shown in Figure 8. Figure 9 shows the stability chamber had been stabilized to within 20 ˘ 0.05 ˝ C, as shown in Figure 8. Figure 9 shows the stability test results of the probe. It can be seen that the total drift of the probe was less than 5 nm for duration test results of the probe. It can be seen that the total drift of the probe was less than 5 nm for duration test results of the probe. It can be seen that the total drift of the probe was less than 5 nm for duration of three hours, and the fluctuation was less than 3 nm after two hours. The stability of the probe is of three hours, and the fluctuation was less than 3 nm after two hours. The stability of the probe is of three hours, and the fluctuation was less than 3 nm after two hours. The stability of the probe is thus confirmed. thus confirmed. thus confirmed.
Temperature Temperature((℃ ℃))
20.06 20.06 20.04 20.04 20.02 20.02 20 20 19.98 19.98 0 0
0.5 0.5
1 1
1.5 1.5(h) Time Time (h)
2 2
2.5 2.5
Figure 8. The temperature in the chamber. Figure 8. The temperature in the chamber. Figure 8. The temperature in the chamber.
3 3
Appl. Sci. 2016, 6, 86
8 of 11
Appl. Sci. 2016, 6, 86
8 of 11 1659 1658
Drift (nm)
Drift (nm)
Appl. Sci. 2016, 6, 86
8 of 11
1657 1659 1656 1658 1655 1657 1654 1656 1653 0 1655
0.5
1
1.5 Time (h)
2
2.5
3
1654
Figure 9. Stability test results of the probe.
Figure 9. Stability test results of the probe.
4.2. Probe Repeatability
1653 0
0.5
1
1.5 Time (h)
2
2.5
3
4.2. Probe Repeatability
Figure 9. Stability test results of the probe. The touch‐trigger repeatability of the probe along X+, X−, Y+, Y−, and Z directions was also
The touch-trigger repeatability of the probe along X+, X´, Y+, Y´, and Z directions tested. The probe was touched seven times in each direction with a displacement of 1 μm of was the also 4.2. Probe Repeatability Physik Instrumente (PI) stage after the in temperature in the chamber had stabilized. The of residual tested. The probe was touched seven times each direction with a displacement of 1 µm the Physik errors of (PI) the stage test results in each direction are shown in X+, Table The maximum single directional Instrumente afterrepeatability the temperature the chamber had stabilized. residual errors of the The touch‐trigger of the in probe along X−, 2. Y+, Y−, and The Z directions was also repeatability was 4 nm (K = 2). test results each direction are shown Table Thedirection maximum single directionalof repeatability tested. in The probe was touched seven intimes in 2.each with a displacement 1 μm of the was 4 nm Physik (K = 2).Instrumente (PI) stage after the temperature in the chamber had stabilized. The residual Table 2. Results of the trigger test.
errors of the test results in each direction are shown in Table 2. The maximum single directional repeatability was 4 nm (K = 2). Table 2. Results ofResidual Errors (nm) the trigger test. Item X+ X− Y+ Y− Z Table 2. Results of the trigger test. Errors (nm) 1st Item −0.6 −1.1 Residual−2.7 −1.4 −1.9 2nd 2.9 X+ −0.8 0.2 1.3 Residual Errors (nm) X´ Y+ Y´ Z −1.4 Item 3rd 0.6 1.9 −1.8 −0.3 −1.2 X+ ´0.6 X− Y+ Y− 1st ´1.1 ´2.7 ´1.4 ´1.9 Z 4th −2.2 0.7 1.6 1.3 0.1 1st 2nd −0.6 2.9 −1.1 −2.7 −1.4 ´1.4−1.9 ´0.8 0.2 1.3 5th 0.6 −2.6 2.1 0.7 −2.4 2nd 3rd 2.9 0.6 −0.8 1.9 0.2 1.3 ´1.8 ´0.3 ´1.2−1.4 6th 4th −3.2 0.8 0.7 0.1 −0.3 −2.8 1.6 1.3 0.1 −1.2 3rd 0.6 ´2.2 1.9 −1.8 −0.3 7th 1.3 2.0 1.2 −1.0 ´2.6 2.1 0.7 ´2.4−1.0 4th 5th −2.2 0.6 0.7 1.6 1.3 0.1 6th ´3.2 0.8 0.1 ´0.3 ´2.8−2.4 standard deviation 2.0 1.7 1.8 1.1 1.0 5th 0.6 −2.6 2.1 0.7 7th 1.3 2.0 1.2 ´1.0 ´1.0 repeatability (K = 2) 4.0 3.4 3.6 2.2 2.0 6th −3.2 0.8 0.1 −0.3 −2.8 standard deviation 2.0 1.7 1.8 1.1 1.0 7th 1.3 2.0 1.2 −1.0 −1.0 repeatability (K = 2) 4.0 3.4 3.6 2.2 2.0 4.3. Sensitivity and Permissible Range standard deviation 2.0 1.7 1.8 1.1 1.0 repeatability (K = 2) 4.0 3.4 3.6 2.2 2.0 Figure 10 shows the sensitivity and permissible range of the probe. It can be found that the
4.3. Sensitivity and Permissible Range sensitivities of the probe in horizontal and vertical directions were nearly equal and coincident with 4.3. Sensitivity and Permissible Range
The output of the probe (μm) The output of the probe (μm)
the design target quite well when the ball tip′s displacement was within 1 μm. In other words, the Figure 10 shows the sensitivity and permissible range of the probe. It can be found that the probe has a sensitivity within a trigger range 1 the μm that is large enough for the the Figure 10 uniform shows in the sensitivity and vertical permissible range of of probe. It equal can be found that sensitivities of the probe horizontal and directions were nearly and coincident with touch‐trigger measurement. Figure 10 also illustrates that the probe has a permissible range up to 8 sensitivities of the probe in horizontal and vertical directions were nearly equal and coincident with the design target quite well when the ball tip’s displacement was within 1 µm. In other words, the μm, which provides a large safety margin for the application of the probe. The difference between probethe design target quite well when the ball tip′s displacement was within 1 μm. In other words, the has a uniform sensitivity within a trigger range of 1 µm that is large enough for the touch-trigger two sensitivity curves could be caused by the error of manufacturing and assembly. probe has a uniform sensitivity within a trigger range of 1 μm that is large enough for the measurement. Figure 10 also illustrates that the probe has a permissible range up to 8 µm, which touch‐trigger measurement. Figure 10 also illustrates that the probe has a permissible range up to 8 provides a large safety margin for the10 application of the probe. The difference between two sensitivity in horizontal (Kh=0.88) μm, which provides a large safety margin for the application of the probe. The difference between in vertical (Kv=0.98) curves could be caused by the error of manufacturing and assembly. 8 two sensitivity curves could be caused by the error of manufacturing and assembly. 106 84
in horizontal (Kh=0.88) in vertical (Kv=0.98)
62 400
2 4 6 The displacement of the PI stage (μm)
8
2
Figure 10. The sensitivity and permissible range of the probe. 0 0
2 4 6 The displacement of the PI stage (μm)
8
Figure 10. The sensitivity and permissible range of the probe.
Figure 10. The sensitivity and permissible range of the probe.
Appl. Sci. 2016, 6, 86 Appl. Sci. 2016, 6, 86
9 of 11 9 of 11
4.4. Probe Resolution 4.4. Probe Resolution An experiment in the same condition as the repeatability test was carried out to investigate the An experiment in the same condition as the repeatability test was carried out to investigate the resolution of the probe and the result is shown in Figure 11. The probe ball tip was pushed three resolution of the probe and the result is shown in Figure 11. The probe ball tip was pushed three steps steps by the gauge block with a step of 5 nm actuated by the PI stage and then returned back to the by the gauge block with a step of 5 nm actuated by the PI stage and then returned back to the initial initial position. The steps of the probe precisely follow the motion command. Therefore, we can say position. The steps of the probe precisely follow the motion command. Therefore, we can say that the that the probe has a resolution of less than 5 nm. The different outputs of the probe tip between the probe has a resolution of less than 5 nm. The different outputs of the probe tip between the beginning beginning and the end might have been caused by the short periodic fluctuation shown in Figure 9. and the end might have been caused by the short periodic fluctuation shown in Figure 9.
The output of the probe (nm)
50 45 40 35 30 25 0
1
2 3 4 5 6 The displacement of the PI stage (μm)
7
Figure 11. Resolution test results of the probe. Figure 11. Resolution test results of the probe.
5. Conclusions 5. Conclusions A new touch‐trigger probe with a small single low‐cost sensor for micro‐CMMs is presented in A new touch-trigger probe with a small single low-cost sensor for micro-CMMs is presented in this paper. The components and sensing principle of the probe were addressed. The sensitivity of this paper. The components and sensing principle of the probe were addressed. The sensitivity of the probe was analyzed, and the uniform sensitivity feature was obtained. The optimal structural the probe was analyzed, and the uniform sensitivity feature was obtained. The optimal structural parameters conforming to uniform stiffness were obtained. Finite element analysis and experiments parameters conforming to uniform stiffness were obtained. Finite element analysis and experiments were conducted. The probe was verified as having equal stiffness of less than 1 mN/μm in three were conducted. The probe was verified as having equal stiffness of less than 1 mN/µm in three dimensions, single‐direction repeatability of less than 4 nm, resolution better than 5 nm and a small dimensions, single-direction repeatability of less than 4 nm, resolution better than 5 nm and a small cross‐sectional diameter of 40 mm. cross-sectional diameter of 40 mm. Acknowledgments: The reported work is partly funded by the Natural Science Foundation of Anhui Province Acknowledgments: The reported work is partly funded by the Natural Science Foundation of Anhui Province for Higher Education Institutions (KJ2015A410), the State Key Laboratory of Precision Measuring Technology for Higher Education Institutions (KJ2015A410), the State Key Laboratory of Precision Measuring Technology and and Instruments of China (PIL1401), the National Natural Science Foundation of China (51475131, 51475133) Instruments of China (PIL1401), the National Natural Science Foundation of China (51475131, 51475133) and the College (2015zdxm05, and the Foundation of Anhui Electrical Professional Engineering Professional Foundation of Anhui Electrical Engineering Technique CollegeTechnique (2015zdxm05, 2015zdxm06). 2015zdxm06). Author Contributions: Rui-Jun Li and Kuang-Chao Fan conceived, designed the probe and wrote the paper; Meng Xiang performed the experiments and simulations; Ya-Xiong He manufactured the sensor; Author Contributions: Rui‐Jun Li and Kuang‐Chao Fan conceived, designed the probe and wrote the paper; Qiang-Xian Huang designed the experiments; Zhen-Ying Cheng analyzed the sensitivity; Bin Zhou created Meng Xiang performed the experiments and simulations; Ya‐Xiong He manufactured the sensor; Qiang‐Xian the figures. Huang designed the experiments; Zhen‐Ying Cheng analyzed the sensitivity; Bin Zhou created the figures. Conflicts of Interest: The authors declare no conflict of interest. Conflicts of Interest: The authors declare no conflict of interest.
Abbreviations Abbreviations The following abbreviations are used in this manuscript: The following abbreviations are used in this manuscript:
CMM
Coordinate measuring machine
CMM: Coordinate measuring machine QPD Quadrant photo detector QPD: Quadrant photo detector PI Physik Instrumente PI: Physik Instrumente
References References 1. 1.
McKeown, P. Nanotechnology—Special Article. In Proceedings of the Nano-Metrology in Precision McKeown, P. Nanotechnology—Special Article. In Proceedings of the Nano‐Metrology in Precision Engineering, Hong Kong, China, 24–25 November 1998; pp. 45–55. Engineering, Hong Kong, China, 24–25 November 1998; pp. 45–55.
Appl. Sci. 2016, 6, 86
2. 3.
4.
5. 6.
7. 8. 9. 10. 11. 12. 13. 14. 15. 16.
17. 18.
19. 20. 21. 22. 23. 24. 25.
10 of 11
Fan, K.C.; Fei, Y.T.; Yu, X.F.; Chen, Y.J.; Wang, W.L.; Chen, F.; Liu, Y.S. Development of a low-cost micro-CMM for 3D micro/nano measurements. Meas. Sci. Technol. 2006, 17, 524–532. [CrossRef] Jäeger, G.; Manske, E.; Hausotte, T. Nanopositioning and Measuring Machine. In Proceedings of the 2nd European Society for Precision Engineering and Nanotechnology, Turin, Italy, 28 May–1 June 2001; pp. 290–293. Takamasu, K.; Furutani, K.R.; Ozono, S. Development of Nano-CMM (Coordinate Measuring Machine with Nanometer Resolution). In Proceedings of the XIV IMEKO World Congress, Tampere, Finland, 1–6 June 1997; pp. 34–39. Peggs, G.N.; Lewis, A.J.; Oldfield, S. Design for a compact high-accuracy CMM. CIRP Ann. 1999, 48, 417–420. [CrossRef] Leach, R.K.; Murphy, J. The Design of Co-Ordinate Measuring Probe for Characterizing Truly Three-Dimensional Micro-Structures. In Proceedings of the 4th EUSPEN International Conference, Glasgow, UK, 30 May–3 June 2004; pp. 230–231. Dai, G.L.; Bütefisch, S.; Pohlenz, F.; Danzebrink, H.U. A high precision micro/nano CMM using piezoresistive tactile probes. Meas. Sci. Technol. 2009, 20, 1118–1121. [CrossRef] Haitjema, H.; Pril, W.O.; Schellekens, P. Development of a silicon-based nano probe system for 3-D measurements. CIRP Ann. 2001, 50, 365–368. [CrossRef] Peiner, E.; Balke, M.; Doering, L.; Brand, U. Tactile probes for dimensional metrology with micro components at nanometre resolution. Meas. Sci. Technol. 2008, 19, 579–588. [CrossRef] Tibrewala, A.; Phataralaoha, A.; Büttgenbach, S. Development, fabrication and characterization of a 3D tactile sensor. J. Micromech. Microeng. 2009, 19, 125005–125009. [CrossRef] Küng, A.; Meli, F.; Thalmann, R. Ultraprecision micro-CMM using a low force 3D touch probe. Meas. Sci. Technol. 2005, 18, 319–327. [CrossRef] Hughes, E.B.; Wilson, A.; Peggs, G.N. Design of high accuracy CMM based on multilateration techniques. CIRP Ann. 2000, 49, 391–394. [CrossRef] Muralikrishnan, B.; Stone, J.A.; Stoup, J.R. Fiber deflection probe for small hole metrology. Precis. Eng. 2006, 30, 154–164. [CrossRef] Kim, S.W. New design of precision CMM based upon volumetric phase-measuring interferometry. CIRP Ann. 2001, 50, 357–360. [CrossRef] Ji, H.; Hsu, H.Y.; Kong, L.X.; Wedding, A.B. Development of a contact probe incorporating a Bragg grating strain sensor for nano coordinate measuring machines. Meas. Sci. Technol. 2009, 20. [CrossRef] Ding, B.Z.; Fei, Y.T.; Fan, K.C. 3D Touch Trigger Probe Based on Fiber Bragg Gratings. In Proceedings of the Metrology, Inspection and Process Control for Microlithography XXIII, San Jose, CA, USA, 19–20 January 2009. Liu, F.F.; Fei, Y.T.; Xia, H.J.; Chen, L.J. A new micro/nano displacement measurement method based on a double-fiber Bragg grating (FBG) sensing structure. Meas. Sci. Technol. 2012, 23, 54002–54010. [CrossRef] Enami, K.; Kuo, C.C.; Nogami, T.; Hiraki, M.; Takamasu, K.; Ozono, S. Development of nano-Probe System Using Optical Sensing. In Proceedings of the IMEKO-XV World Congress, Osaka, Japan, 13–18 June 1999; pp. 189–192. Fan, K.C.; Cheng, F.; Wang, W.L.; Chen, Y.J.; Lin, J.Y. A scanning contact probe for a micro-coordinate measuring machine (CMM). Meas. Sci. Technol. 2010, 21, 603–616. [CrossRef] Chu, C.L.; Chiu, C.Y. Development of a low-cost nanoscale touch trigger probe based on two commercial DVD pick-up heads. Meas. Sci. Technol. 2007, 18, 1831–1842. [CrossRef] Liebrich, T.; Knapp, W. New concept of a 3D-probing system for micro-components. CIRP Ann. 2010, 59, 513–516. [CrossRef] Balzer, F.G.; Hausotte, T.; Dorozhovets, N.; Manske, E.; Jäger, G. Tactile 3D microprobe system with exchangeable styli. Meas. Sci. Technol. 2011, 22, 94018–94024. [CrossRef] Joonh, Y.K.; Jae, W.H.; Yong, S.K.; Lee, D.Y.; Lee, K. Atomic force microscope with improved scan accuracy, scan speed, and optical vision. Rev. Sci. Instrum. 2003, 74, 4378–4383. Li, R.J.; Fan, K.C.; Huang, Q.X.; Qian, J.Z.; Gong, W.; Wang, Z.W. Design of a large scanning range contact probe for nano-coordinate measurement machines (CMM). Opt. Eng. 2012, 51, 527–529. [CrossRef] Li, R.J.; Fan, K.C.; Miao, J.W.; Huang, Q.X.; Tao, S. An analogue contact probe using a compact 3D optical sensor for micro/nano coordinate measuring machines. Meas. Sci. Technol. 2014, 25, 1–33. [CrossRef]
Appl. Sci. 2016, 6, 86
26. 27. 28. 29.
11 of 11
Li, R.J.; Fan, K.C.; Huang, Q.X.; Zhou, H.; Gong, E.M. A long-stroke 3D contact scanning probe for micro/nano coordinate measuring machine. Precis. Eng. 2015, 43, 220–229. [CrossRef] Li, R.J.; Fan, K.C.; Zhou, H.; Wang, N.; Huang, Q.X. Elastic mechanism design of the CMM contact probe. In Proceedings of the SPIE, Chengdu, China, 8–11 August 2013; pp. 182–185. Feng, J.; Li, R.J.; Fan, K.C.; Zhou, H.; Zhang, H. Development of a low-cost and vibration-free constant-temperature chamber for precision measurement. Sens. Mater. 2015, 27, 329–340. [CrossRef] Li, R.J.; Fan, K.C.; Qian, J.Z.; Huang, Q.X.; Gong, W.; Miao, J.W. Stability analysis of contact scanning probe for micro/nano coordinate measuring machine. Nanotechnol. Precis. Eng. 2012, 10, 125–131. © 2016 by the authors; licensee MDPI, Basel, Switzerland. This article is an open access article distributed under the terms and conditions of the Creative Commons by Attribution (CC-BY) license (http://creativecommons.org/licenses/by/4.0/).