African Journal of Plant Science Vol. 4(4), pp. 122-127, April 2010 Available online at http://www.academicjournals.org/ajps ISSN 1996-0824 © 2010 Academic Journals
Full Length Research Paper
Development of a lemon sorting system based on color and size M. Khojastehnazhand, M. Omid* and A. Tabatabaeefar Department of Agricultural Machinery Engineering, Faculty of Agricultural Engineering and Technology, University of Tehran, Karaj, Iran. Accepted 13 January, 2010
Grading systems give us many kinds of information such as size, color, shape, defect, and internal quality. Among these color and size are the most important features for accurate classification and/or sorting of citrus such as oranges, lemons and tangerines. Basically, two inspection stages of the system can be identified: external fruit inspection and internal fruit inspection. The former task is accomplished through processing of color images, while internal inspection requires special sensors for moisture, sugar and acid contents. In this paper, an efficient algorithm for grading lemon fruits is developed and implemented in visual basic environment. The system consists of two CCD cameras, two capture cards, an appropriate lighting system, a personal computer and other mechanical parts. The algorithm initially extracts the fruit from the background. The samples of different grades of lemon are situated in front of the cameras and are calibratted off-line. Then information on the HSI color values and estimated volumes of fruits are extracted and saved in a database. By comparing the information during sorting phase with the available information inside the database, the final grade of the passing fruits are determined. This algorithm can be easily adapted for grading and/or inspection of other agricultural products such as cucumber and eggplant. Key words: Lemon, sorting, volume, image processing, machine vision, HSI color. INTRODUCTION Color and size are the most important features for accurate classification and sorting of citrus. Because of the ever-growing need to supply high quality food products within a short time, automated grading of agricultural products is getting special priority among many farmer associations. The impetus for these trends can be attributed to increased awareness by consumers about their better health well-being and a response by producers on the need to provide quality guaranteed products with consistency. It is in this context that the field of automatic inspection and machine vision comes in to play the important role of quality control for agricultural products. Fruit size estimation is also helpful in planning packaging, transportation and marketing operations. Among the physical attributes of agricultural materials, volume, mass and projected areas are the most important
*Corresponding author. E-mail:
[email protected]. Tel: +98-2612801011. Fax: +98-261-2808138.
ones in sizing systems (Tabatabaeefar and Rajabipour, 2005; Wright et al., 1986; Safwat and Moustafa, 1971). Computer vision has been used for quality inspection of fruits. Quality inspections of fruits have two different objectives: quality evaluation and defect finding. In recent years, computer machine vision and image processing techniques have been found increasingly useful in the fruit industry, especially for applications in quality inspection and shape sorting. Researches in this area indicate the feasibility of using machine vision systems to improve product quality while freeing people from the traditional hand sorting of agricultural materials. Raji and Alamutu (2005) reviiewed the recent development and application of image analysis and computer machine vision in sorting of agricultural materials and products in the food industries. Generally, quality grading includes outer parameters (size, color intensity, color homogeneity, bruises, shape, stem identification surface texture and mass), inner parameters (sweetness, acidity or inner diseases) and freshness. Although, both outer and inner quality information
Khojastehnazhand et al.
123
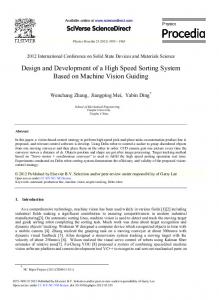
Figure 1. Developed machine vision system.
can be collected by an automatic grading system in a factory, but machine vision is more effective for measuring outer parameters (Lee et al., 1999; Majumdar and Jayas, 2000; Shahin and Symons, 2001; Paliwal et al., 2003; Shigeta et al., 2004; Shahin et al., 2004; Qiao et al., 2004; Lorestani et al., 2006). The algorithm can successfully estimate size, sort colour, classify shape, detect bruises or scar tissue and predict the mass of the pepper fruits. Njoroge et al. (2002) described the operations and performance of an automated quality verification system for agricultural products. Kondo et al. (2005) proposed a multi-product grading system for agricultural products. Recently we developed an an image processing technique for estimating citrus fruis physical attributes including diameters, volume, mass and surface area using image processing technique (Khojastehnazhand et al., 2009). There we developed a machine vision system to automatically determine the diameter, volume and surface area of tangerine. This image processing procedure can be readily applied to other axi-symmetric agricultural products such as eggs, pearl, pepper, carrot, limes and onions. The objective of this work is to extend the scope of the algorithm for a sorting system, designed specifically for citrus fruits such as lemon. MATERIALS AND METHODS In order to sort lemons, a general purpose machine vision system was developed. The proposed system (Figure 1) consists of two CCD cameras with 510 x 492 pixels (PROLINE-565 s), two capture cards (WinFast DV2000 with a resolution of
320 H × 240V
), an
appropriate lighting system and a personal computer (PC). Cameras had a CS lens mount, a focal length of 3.5 - 8 mm with a 510 by 492 pixel resolution and provided a resolution of 480 vertical TV lines. The cameras were mounted about 25 cm above the belt and powered by a 24 V power supply. To provide uniform lighting, four fluorescent tubes, placed above the conveyor, were used. The position of the lighting tubes was adjusted to provide uniform, well illuminated and free from shadows images of fruit. The light source and cameras were mounted on a frame and were attached to the measurement table. A white cardboard was used as background surface to facilitate and simplify the segmentation task. Signals from lemon samples were captured by the camera, transferred to the PC through the video capture card, digitized, and stored on the PC in RGB (red, green, blue) color space. A program was developed to capture and record the surface images of the lemon. Algorithms were implemented using Visual Basic 6.0 programming language. In order to remove the background from fruit images, firstly an image from the background is captured. By determination of R, G and B values for all pixels of background by Eq. (1), standard deviation of the images are calculated and stored in the database.
P( X , Y ) = B × 216 + G × 2 8 + R
(1)
Where; X and Y, ranging from 0 (black) to 255 (white), refer to the position of each pixel, and R, G and B values of each pixel in the image were obtained from the real color image. Once the image of the fruit is captured, the RGB value of any pixel in the image can be computed by Eq. (1). The RGB values in the fruit image are then compared with that of the stored information on the background image available in the database. If the difference between the two RGB values is less than 3 , then it is regarded as the background, else it is fruit: IF |PB - PF |
3 THEN Pixel = Background
(2)
Where PB is the RGB values of background image pixel, PF is the RGB values of fruit image pixel and is the standard deviation of
124
Afr. J. Plant Sci.
Figure 2. Selected lemons of various sizes and grades according to human export judgements
background image. Color evalutation RGB color space is the most popular color model. Some algorithms of fruit vision are based on this color model (Steinmetz et al., 1996; Leemans et al., 1998; Paulus et al., 1997). When color is presented with R, G and B, the amount of information is tripled. Thus more algorithms could be developed to comprehensively utilize the color information in an image. However, RGB system is sensitive to lighting or other conditions. Another color model is HSI (Hue, Saturation and Intensity). Here we prefer using HSI, as in this system Hue value is comparatively stable. The color of fruit is determined by calculating average Hue (H) value for the fruit. In order to evaluate the color of captured images of fruit, the acquired RGB color information was transformed to HSI color by: H = COS − 1
S = 1−
I=
(2 R
− G − B )/ 2
[(R − G )2 + (R − B )(G − B )] 2
3 [min (R, G, B )] (R + G + B )
1 (R + G + B ) 3
(3)
1
(4)
(5)
From a close examination of image histograms, we observed that the uniform green is restricted in a certain range (330 to 360) or (0 to 20), so accurate color classification is possible with only hue parameter. The RGB values are determined using the following VB code for all pixels of background:
Private Sub RGBcolor (ByVal Point As Long) Blue = Point \ 256 ^ 2 Temp = Point Mod 256 ^ 2 Green = Temp \ 256 Red = Temp Mod 256 End Sub Volume evalutation To determine the volume of lemon fruits, image of fruit is captured. Using (2), the background is removed from the main fruit . By dividing the fruit image into a number of distinct sectors, the volume of lemon fruit can be estimated (Khojastehnazhand et al., 2009). Calibration stage A total of 50 randomly selected lemons of various sizes and colors were purchased from a local market for evaluation (Figure 2). Initially the fruits are graded by human expert into 3 classes; 22 into class One, 13 into class Two, and 15 into class Three. The relevant information for these fruits (Averaged Hue value and volume information) were extracted from the above mentioned algorithms as implemented by VB program (Figure 3). The actual volume of lemons was measured using the water displacement method (WDM). In this method, the object is completely submerged in water and the weight of the displaced water measured (Mohsenin, 1970). Even though this method is quite accurate, it is not ideal for objects that absorb water and for some products, this approach might be considered intrusive or destructive. Statistical measures including, maximum, minimum and average values were also calculated for three grades (Figure 3). Finally operator selected two threshold for volume and color with obtained data by calibration stage of machine vision system. These two thresholds were minimum volume and hue of grade one. Figure 4 shows the designed interface in
Khojastehnazhand et al.
Start For Grade i = 1 to 3 For Sample j= 1 to n Capture image Calculate the Max, Min and Average Volume and Hue Save in database (Max, Min and Average of values)
Calculate the Max, Min and average volume and hue of any grade
End Figure 3. The algorithm of calibration stage.
Figure 4. Designed interface in Visual Basic 6.0 programming language.
125
126
Afr. J. Plant Sci.
Table 1. Comparison between measured and calculated volume of lemon.
Max Ave Min
Volume, 3 cm WDM IPM 26.6 28.9 20.7 20.8 9.6 8.5
2
R
0.9616
Paired t-test 0.6131
Table 2. Confusion matrix showing the number of correctly classified fruits with the developed machine vision system.
Diameter, mm a 42 37.3 29
b 35 32 24.4
c 35 31.6 24
VB 6.0 programming language for system calibration and sorting the citrus product. Sorting stage During the sorting stage, the online images of fruit passing in front of cameras were captured and HSI color values and their estimated volumes were determined. By comparing the information during sorting phase with the available information in the database, the final grade of passing fruits were determined. The fruit was graded as class One if its volume and color (Hue) were bigger than volume and color thresholds determined in calibration stage. The fruit was graded as class Two if its volume was bigger than threshhold volume and its color was less than the threshold color determined in calibration stage. Finally fruit was graded as class Three if its volume was less than the threshold volume. At the final stage of algorith, fruit’s center of gravity was calculated to be later used for automatic sorting through phenematic mechanism. The number of pixels in the foreground (fruit) has to be scaled in order to convert (map) the total number of pixels into a real volume value. The constants C (scale factor of volume) of C = 2.35*10-4 were obtained after rationing the real and measured volume of a perfect sphere. The C is eventually used to convert units of measurement from pixels to cm3.
RESULTS AND DISCUSSION The results of comparison between predicted (IPM) and 2 actual (WDM) volumes of lemons with R = 0.9852 are shown in Table 1. The diameters and volume of lemons were computed using the set up shown in Figure 1. Details are available in Khojastehnazhand et al. (2009). The results of volume calculation by proposed IPM and WDM show the fruit volume can be accurately be calculated by this algorithm (Table 1). The paired t-test results shows that the volume computed with IP method was not significantly different from the volume measured with WDM. A summary of our findings is shown in Table 2. The correct classification rates (CCR) are calculated from the confusion matrix given in Table 2. The CCR percentages for grade one, grade two, and grade three are 95.45, 100 and 86.67, respectively. Calibration results show that the algorithm produces the CCR of greater than 86 % for all grades of lemon fruits. The total weighted average in system accuracy is 94.04%, that is to say only 6% of fruits are misclassified.
Grade 1 Grade 2 Grade 3
Machine vision system Grade Grade Grade 1 2 3 21 1 0 0 13 0 2 0 13
Human expert
CCR (%)
22 13 15
95.45 100 86.67
Conclusion In this paper, we presented a novel approach for development of a sorting system for grading lemon based on color and size. The calibration of system is done by samples of different grades of fruit. The volume and color of fruit determined and saved in database during calibration stage. During sorting stage, the calculated color and volume compared with saved information in database. The final grade of fruit was determined and its center of gravity calculated to be later used for automatic sorting through phenematic mechanism. This algorithm can be easily adapted for grading/sorting different agricultural products such as cucamber and eggplant. ACKNOWLEDGMENT The financial support provided by the Research Department of University of Tehran is gratefully acknowledged. REFERENCES Khojastehnazhand M, Omid M, Tabatabaeefar A (2009). Determination of orange volume and surface area using image processing technique. Int. Agrophy. 23: 237-242. Kondo N, Ninomiya K, Peter R, Kamata J, Fasil A (2005). Development of Multi-Product Grading System, ASAE Annual Meeting, paper No. 043125. Lee WS, Slaughter DC, Giles DK (1999). Robotic weed control system for tomatoes. Precision Agric. 1: 95-113. Leemans V, Magein H, Destain MF (1998). Defects segmentation on ‘Golden Delicious’ apples by using color machine vision. Computers and Electronics in Agriculture 20: 117-130. Lorestani AN, Omid M, Shooraki SB, Borghei AM, Tabatabaeefar A (2006). Design and evaluation of a Fuzzy Logic based decision support system for grading of Golden Delicious apples. Int. J. Agric. Biol. 8(4): 440-444. Majumdar S, Jayas DS (2000). Classification of cereal grains using machine vision: II- Color models. ASAE 43(6): 1677-1680. Mohsenin NN (1970). Physical properties of plant and animal materials. New York, NY: Gordon and Breach Science Publishers. Njoroge JB, Ninomiya K, Kondo N, Toita H (2002). Automated fruit grading system using image processing. Proceedings of the 41st SICE Annual Conference. 2(5-7): 1346-1351. Paliwal J, Borhan MS, Jayas DS (2003). Classification of cereal grains using a flatbed scanner. ASAE paper No. 036103. Paulus I, De Busschers R, E Schrevens (1997). Use of image analysis to investigate human quality classification of apples. J. Agric. Eng. Res. 68: 341-353. Qiao J, Sasao A, Shibusawa S, Kondo N, Morimoto E (2004). Mobile fruit grading robot (Part I)- development of a robotics system for
Khojastehnazhand et al.
grading sweet pepper. J. Jpn. Soc. Agric. Mach. 66(2): 113-122. Raji A, Alamutu A (2005). Prospects of computer vision automated sorting systems in agricultural process operations in Nigeria. Agric. Eng. Int. : the CIGR J. Sci. Res. Dev. 7: 1-12. Safwat M, Moustafa A (1971). Theoretical prediction of volume, surface area and center of gravity for agricultural products. Transactions of the ASAE 14(2): 549-553. Shahin MA, SJ Symons, Meng AX (2004). Seed Sizing with Image Analysis. ASAE paper No. 043121 Shahin MA, Symons SJ (2001). A machine vision system for grading lentils. Can. Biosys. Eng. 7: 7-14. Shigeta K, Motonaga Y, Kida T, Matsuo M (2004). Distinguishing damaged and undamaged chaff in rice whole crop silage by image processing. ASAE Annual Meeting. paper No. 043125.
127
Steinmetz V, Crochon M, Bellon-Maurel V, Fernandez JLG, Elorza PB, Verstreken L (1996). Sensors for fruit firmness assessment: comparison and fusion. J. Agric. Eng. Res. 64(1): 15-28. Tabatabaeefar A, Rajabipour A (2005). Modeling the mass of apples by its geometrical attributies. Sci. Hortic. 105: 373-382. Wright ME, Tappan JH, Sistler FE (1986). The size and shape of typical sweet potatoes. Trans. ASAE 29(3): 678-682.