F.A.O. Fatores determinantes da qualidade das águas superficiais na bacia do Alto Acaraú, Ceará, Brasil. Ciência Rural, 37(6), pp. 1791â1797, 2007. [6] Yang ...
Water Pollution XII
133
Development of a monitoring network of water resources in urban areas as a support for municipal environmental management A. R. Finotti1, N. Susin2, R. Finkler3, M. D. Silva4 & V. E. Schneider5 1
Federal University of Santa Catarina, Brazil Municipal Environment Department of Caxias do Sul, Brazil 3 Serra Gaúcha Faculty, Brazil 4 Environmental Engineer, Brazil 5 University of Caxias do Sul, Brazil 2
Abstract Water resources in urban areas are often impacted by the intense land use in the cities. The development of a surface water monitoring network is a critical element of water resource sustainable management. The city of Caxias do Sul is the second largest metal mechanic industrial region in Brazil. Industrialization seriously impacts river water quality and is a challenge to public authority supervision. The development of a water monitoring network was the solution public authorities found for the municipality environmental management. The network included 12 stations, monitored over 13 months for 15 physical and chemical water quality parameters. Stations were placed according to maps and satellite images, so as to identify the contributing watershed and land use. Principal component analysis (PCA) was one of the techniques used for data analysis. The first principal component corresponded to the variation of total nitrogen, ammonia, total phosphorus, BOD, COD and electrical conductivity and responded for 76.54% of data variance. The variables that comprised the first component indicated that the main source of water contamination was domestic sewage. The second principal component was composed of chromium, nickel and zinc, suggesting sewage discharge from electroplating industries. The third principal component presented aluminum and iron that are naturally found in local soils. The concentrations of such parameters in each monitoring station
WIT Transactions on Ecology and The Environment, Vol 182, © 2014 WIT Press www.witpress.com, ISSN 1743-3541 (on-line) doi:10.2495/WP140121
134 Water Pollution XII allowed for the identification of watersheds with greater levels of pollution, and it has thus pointed out to the public authorities areas that should be more importantly and intensely supervised. This case study showed the importance of a good water monitoring network to subside the environmental management of urban water. Data resulting from this network can optimize decision-making in the municipality, with regard to environmental and water resource management. Keywords: monitoring network, urban river, water contamination.
1 Introduction The rivers are direct receptors of all the water transported through the watershed. In urban areas, besides the watershed natural processes, any transformation society makes in water returns to the river. Such transformations take place in dwelling and industry areas and can be simplified by the sewage treating of all water used in processes and human consumption. Watershed rivers are the main receptors of the entire load of effluents generated in urban areas. The kind of treatment given to domestic or industrial waste interferes with the water quality. Existing regulations about the quality of effluents released in the hydrous system are the first tools for water quality management. These regulations aim at establishing boundaries for industrial and domestic activities, in order to avoid water pollution. The second water management tool would be licensing the potentially pollutant activities and, third, inspecting the compliance with both previous tools. Regarding urban water management, city governments must be efficient, i.e., technically prepared to apply all three tools mentioned above. The network data may help reduce inspection efforts by showing which micro watersheds need more attention. The quali-quantitative data can be used as a guide for activity licensing. Industrial activities can be increased in micro watersheds with larger support capacity and in locations where water resources are more fragile, these activities must be reduced. And, finally, aquatic environment specific characteristics learnt from the monitoring system can be used to improve the content of regulations on the release and quality of water in the city, by creating boundaries for each subwatershed. A properly planned and operated monitoring network can be an important tool that will provide cost reduction and environmental benefits through the management of activities, especially for water resource management. This case study presents the employment and operation of a monitoring network at a mid-size city in Brazil. The city of Caxias do Sul, the second largest metal mechanic industrial region in the country, has approximately 500,000 inhabitants, and is an important complex for the furniture and food industries. Public authorities from Caxias do Sul realized the importance of employing a monitoring network and thus installed a network composed of 12 stations that were monthly monitored for 20 water quality parameters and flow. Results from this study relate to the first year of monitoring, as well as to the probable consequences of management actions. WIT Transactions on Ecology and The Environment, Vol 182, © 2014 WIT Press www.witpress.com, ISSN 1743-3541 (on-line)
Water Pollution XII
135
2 Materials and methods This study arises from the need to develop a monitoring network that may support the licensing process of the Secretariat of Environment – SEMA of Caxias do Sul, addressing potentially pollutant activities. The monitoring network should enable the finding of regions with greater urban water contamination problems and clandestine industrial waste. Initially, a hydrological study of the region was carried out based on images from Quickbird satellite and maps of the area. Based on the hydrographic records, subwatersheds were defined in the urban area and the physiographical indexes were gathered. The monitoring network Project was designed and technicians from its municipality were trained considering SEMA’s targets for the network and hydrologic study. Besides SEMA’s technicians, the Environmental Police, the Fire Brigade and technicians from the sanitation department also attended the course. The monitoring network sites were pre-established and the river sections were studied in loco. The project started with 12 stations that were monthly monitored during one year. A bathymetry was made and a limnimetric ruler was installed in each section. The flow was conventionally measured with a hydrometric winch, which measures the water speed based on the number of helix rotations. The method consists of direct measurements of the cross-section speed distribution for several levels of water. Thus, the flow can be expressed as speed rate through the cross-section of the river channel. The parameters collected as samples are presented in Table 1, as well as the method used for each analysis. The one-year data gathered from sampling were analyzed using descriptive statistical methods and the principal components analysis. The results were used by SEMA to identify the main sources of pollution and their location to intensify environmental inspections and licensing in the monitored micro watersheds.
3 Conception of the monitoring network in the city’s environmental management process The monitoring network project was based on the flowchart presented by Finotti et al. [1] (Fig. 1). The purpose of the monitoring network was to enable the licensing department of Caxias do Sul’s city hall to take inspection actions. Later, these results may be used to assist with specific licensing regulations.
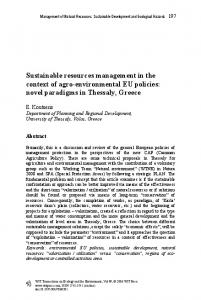
4 Water resources in Caxias do Sul and the monitoring network In order to define the monitoring network stations, a hydrographic study of the region was made. The micro watersheds of the city were delimited using satellite images; and the topographic map was made by the city hall based on air shots. Based on this cartography (Fig. 2), the micro watersheds’ physiographic data were gathered (Table 1). The hydrographic study determined 6 micro watersheds with areas from 2 to 124 km2. WIT Transactions on Ecology and The Environment, Vol 182, © 2014 WIT Press www.witpress.com, ISSN 1743-3541 (on-line)
136 Water Pollution XII Table 1:
Sample parameters and analysis method in accordance with APHA [1].
PARAMETERS Defined in the lab Chemical demand for oxygen (mg O2/L) Biochemical demand for oxygen (mg O2/L) Total nitrogen (mg N/L) Amoniacal nitrogen (mg NH3-N/L) Total phosphor (mg P/L) Anionic surfactant (mg/L) Total oil and grease (mg/L) Total solids (mg/L) Total volatile solids (mg/L) Total dissolved solids (mg/L) Volatile dissolved solids (mg/L) Cyanides (mg/L) Phenol (μg/L) Chrome (mg/L) Zinc (mg/L) Iron (mg/L) Aluminum (mg/L) Nickel (mg/L) Lead (mg/L) Faecal coliforms (NMP/100 mL) Total oil hydrocarbons (μg/L) Defined in the field pH Conductivity (μs/cm) Dissolved oxygen (mgO2/L) Air and water temperature (C)
Connected with the network purpose
METHODOLOGY Open reflux with K2Cr2O7 in acidic media Dilution and incubation at 20°C for 5 days Tritrimetric with nesslerization Tritrimetric with nesslerization Colorimetric of ascorbic acid Methylene blue – MBAS Soxhlet Extraction/Gravimetry Gravimetry at 103–105°C Gravimetry at 550°C Gravimetry at 103–105°C Gravimetry at 550°C Spectometry Extraction with chloroform Atomic absorption Atomic absorption Atomic absorption Atomic absorption Inductively coupled plasma Inductively coupled plasma Multiple tubes Gas chromatography Potentiometric method Electrometry Membrane electrode Thermometer Monitoring network operation
Monitoring network project
Water quality Collection of samples
Collection, measurement and transport
Lab analysis
Analytics, registry, quality
Data processing
Data storage
Analysis of data
Statistics, correlations
Use of information
Publishing, transfer to other departments, inspection Decision-making
Figure 1:
Relation between purpose, project and operation of the monitoring network.
WIT Transactions on Ecology and The Environment, Vol 182, © 2014 WIT Press www.witpress.com, ISSN 1743-3541 (on-line)
Water Pollution XII
Figure 2:
137
Micro watersheds of the city of Caxias do Sul.
According to the results of this study and considering Caxias do Sul Secretariat of Environment needs to inspect the area, the most relevant sites for monitoring were determined. The definition of such sites was supported by technicians’ previous knowledge on regions with larger release of effluents into the city’s rivers. Figure 3 shows these sampling results. The micro watershed drainage area of each monitoring network point is presented in Table 2. All monitoring points are within the urban area and their drained area totalize 126.5 km2 representing 53.5% of the city’s urban area.
WIT Transactions on Ecology and The Environment, Vol 182, © 2014 WIT Press www.witpress.com, ISSN 1743-3541 (on-line)
138 Water Pollution XII
Label Monitoring points Municipal limits Rivers Watersheds Streets
Figure 3:
Monitoring network.
The size of all micro watersheds is small. Monitoring these types of water courses is very rare in Brazil on account of the amount of large Rivers all over the territory. However, in urban areas, the study of such watersheds is important due to the risk of floods and to the bad quality of water. Thus, long term comparative studies such as this are rare. Regarding the monitoring points, whenever the micro watershed was larger and the rivers were important for the city, more than one point was chosen per river. In these cases, points away from wildly occupied regions were chosen in order to establish a comparison with other points in the river. In smaller and less important micro watersheds, only one point was chosen within the urban area.
5 Monitoring results Characterizing superficial water quality alterations is important for the assessment of how natural or anthropogenic sources of pollution can potentially harm ecosystems [2]. Thus, water quality monitoring is an important assessment of these impacts. Due to the large number of results obtained throughout the monitoring period, it is difficult to assess the data without statistical tools. Thus, the principal component analysis (PCA) technique enables the identification of relevant factors or components that explain several system variations [2]. Many authors have been using PCA as a combined water quality assessment tool [2–9]. The parameters of the 12 stations, monitored during 12 campaigns, were analyzed by PCA and the results are presented in Table 3, which shows the values attributed to each component and their variance percentage. WIT Transactions on Ecology and The Environment, Vol 182, © 2014 WIT Press www.witpress.com, ISSN 1743-3541 (on-line)
Water Pollution XII
Table 2:
139
Drainage area of Caxias do Sul’s micro watersheds. Total area of the micro watershed (km2)
Urban area (km2)
Drained % of the urban area
Faxinal Stream (B1a)
118.9
26.53 (22%)
11%
São Marcos River (B1)
403.54 77.59
26.53 (7%) 70.872 (91%)
11% 30%
Maestra Stream (B2b)
53.68
48.49(90.3%)
20%
Samuara Stream (B2c)
22.95
17.35 (76%)
7%
Curuçu River (B2d)
86.511
3.869 (0%)
2%
Tega River (B2)
291.47
123.231 (42%)
52%
Biazus Stream (B3)
48.74
3.88 (8%)
2%
Loreto Stream (B6a)
30.49
2.36 (8%)
1%
Ouro Stream (B6)
156.53
2.36 (2%)
1%
87.08
28.52 (33%)
Belo Stream (B5)
162.44
Espelho Stream (B4b) Pena Branca Stream (B4a) Piai River (B4)
SubWatersheds
Herval Stream (Tega) (B2a)
Pinhal Stream (B5a)
Sampling point
Contributing area (km2) sampling point
1 2 3 4 12 5 6
0.1 17.4 5.8 28.0 2.0 0.1 27.9
12%
9 10
9.5 2.4
50.88 (31%)
21%
11
16.5
46.35
15.2 (33%)
6%
7
1.2
22.01
14.76 (67%)
6%
8
15.8
328.7
29.96 (9%)
13%
The first component (CP 1) explains 30.95% of the total data variance. The total group of 5 components explains 76.54% of the variance. In the variables group CP 1, the total nitrogen, ammoniacal nitrogen and total phosphor’s value is higher than 0.90. The value of the other four variables of the group – biochemical demand for oxygen, chemical demand for oxygen and conductivity – is higher than 0.74. CP 1 variables indicate that the main contamination source from water bodies in the city of Caxias do Sul is domestic sewage. The main components of this sewage are: organic matter, nitrogen and phosphor. According to Perona et al. [3], the river’s chemical composition changes with the intensity of human pressure, causing a considerable fluctuation in the nutrient content throughout the year. The author examined fluctuations in concentrations of dissolved inorganic nitrogen and phosphor in different seasons of the year when analyzing a 25 km course in the Alberche River (Madrid, Spain).
WIT Transactions on Ecology and The Environment, Vol 182, © 2014 WIT Press www.witpress.com, ISSN 1743-3541 (on-line)
140 Water Pollution XII Table 3: Factorial value matrix of variables in the top five components selected. Parameter Total nitrogen Ammoniacal nitrogen Total phosphor Conductivity Biochemical demand for Oxygen Chemical demand for oxygen Total chrome Total zinc Total nickel Total aluminum Total iron Sample temperature Air temperature Tolerant faecal coliforms Anionic surfactant Dissolved oxygen % explained variance % accumulated variance
CP 1 0.935 0.931 0.919 0.859 0.778 0.742 0.129 0.173 0.035 0.104 -0.050 0.116 0.030 0.049 0.453 -0.437 30.95 30.95
CP 2 0.132 0.094 0.002 0.224 0.057 0.060 0.932 0.763 0.677 -0.049 0.056 0.046 0.011 -0.083 0.144 -0.339 13.39 44.34
Component CP 3 -0.061 -0.105 0.073 -0.062 0.141 0.437 0.008 0.162 -0.119 0.901 0.877 -0.040 -0.008 -0.034 0.282 -0.029 12.13 56.47
CP 4 0.059 0.064 0.118 0.080 -0.060 -0.003 0.018 0.061 -0.016 -0.035 -0.017 0.895 0.894 0.092 0.137 -0.155 10.56 67.03
CP 5 0.065 0.029 0.086 0.030 0.209 0.200 -0.010 -0.142 0.179 0.001 0.059 0.093 0.099 0.868 0.625 -0.455 9.51 76.54
Shrestha and Kazama [8] have examined the water quality of the Fuji River basin using PCA. The authors obtained three principal components as a result of the polluted area analysis. Component VF1 is constituted by the standards of biochemical demand for oxygen, chemical demand for oxygen, electrical conductivity and inorganic dissolved phosphor, explaining 32.83% of the total variance. The authors noted that this factor can be interpreted as influence of pollutants by particular sources, such as waste water, domestic sewage and industrial effluents. Bouza-Deaño et al. [10] have assessed the quality of water of the Ebro River (Spain), and they have found that the principal component PC4, which explained 7.4% of the variance, included the standards of biochemical demand for oxygen, ammonia and chemical demand for oxygen, thus considered an anthropogenic factor. According to Tundisi and Tundisi [11], the water conductivity expresses a large number of complex phenomena. It depends on the ionic concentration; there is a relation between conductivity and the phytoplankton and macrophyte nutrients. This explains the presence of conductivity as a parameter in CP1 for the statistical analysis. In group CP 2, the total chrome value is equal to 0.932, while total zinc and nickel were 0.763 and 0.677, respectively. The parameters of this group indicate that another relevant source of water pollution is the release of wastewater from galvanic industries. CP 3 presents total aluminum (0.886) and total iron (846) as variables. Both metals constitute the region’s soil and indicate that soil leaching is carried by the rivers of that area. It is, therefore, a natural process. CP 4 included the following variables: air temperature (0.895) and sample temperature (0.894). These variables are intrinsically related, because the temperature alterations in water resources depend on climate changes. Drastic
WIT Transactions on Ecology and The Environment, Vol 182, © 2014 WIT Press www.witpress.com, ISSN 1743-3541 (on-line)
Water Pollution XII
141
water temperature changes affect its properties: viscosity, superficial tension and specific heat. Likewise, gas solubility increase can occur due to water temperature fall. Such variations can greatly affect the entire dynamics of the aquatic ecosystem, altering chemical compositions and biogeochemical cycles, as well as the lifecycle of organisms. Bouza-Deaño et al. [10], in their studies using the PCA analysis, have found that water and air temperatures were highly significant factors, explaining 11.4% of the variation, the authors called it climate factor. According to Finotti et al. [1], high water temperatures can also increase the toxic action of many elements. Thus, the action of organic or inorganic substances may increase or decrease depending on water temperature change. Finally, CP 5 includes thermo-tolerable coliforms, ammoniacal surfactants, and dissolved oxygen, with values equal to 0.868, 0.625, and -0.455, respectively. The dissolved oxygen is quickly absorbed in water and it depends on air/water interactions – water temperature and air pressure [11]. This parameter suffers significant alterations, because in the monitored points there is release of industrial and domestic waste, altering watercourse natural dynamics. The establishment of thermo-tolerable coliforms is extremely important because it indicates the presence of pathogenic organisms, which are responsible for transmitting water-borne diseases [12]. Surfactants can highly affect water ecosystem dynamics, because they alter the dissolved oxygen and xenobiotic concentrations and light penetration [1].
6 Monitoring and environmental management The results from the statistical analysis indicated that the main pollutants in the monitoring network installed in the city of Caxias do Sul are: total nitrogen, ammoniacal nitrogen, total phosphor, conductivity, and chemical and biochemical demand for oxygen, indicating contamination by domestic waste. The second group of parameters of water contamination in the monitoring network includes: chrome, nickel and zinc, suggesting contamination by industrial waste, probably from galvanic industry. In fact, it is known that sewage treatment in Caxias do Sul does not surpass 20% of the waste generated by the population. Although the use of individual alternatives, such as filters and cesspools, is required, the monitoring shows that great part of the domestic waste is released directly into the city’s rivers. The presence of chrome, nickel and zinc was another important aspect that the monitoring network identified. The use of showers to treat metal surfaces is a large scale activity of the city. The water monitoring showed that the waste produced by these activities is release into the city’s water resources, causing severe damage to the environment and inhabitants, due to its toxicity. Monitoring results confirmed the need to establish a sewage collection and treatment system in the city and check for improper connections of houses in this system. Another important aspect evidenced by the monitoring network is the need to inspect activities that involve showers in chrome and nickel treatments. Licensed and illegal businesses must be inspected. The detailed analysis of each WIT Transactions on Ecology and The Environment, Vol 182, © 2014 WIT Press www.witpress.com, ISSN 1743-3541 (on-line)
142 Water Pollution XII sampling point and the micro watersheds enables the identification of regions that must be more urgently inspected. Also, the issuing of permits for all activities is an important action to be taken. On account of the monitoring results, activities involving shower treatments can be more properly authorized, to avoid new projects from worsening the situation in this urban area. Accordingly, the parameters used for these types of project should be reviewed.
7 Conclusions This study has showed the development of a water quality monitoring network for an urban area, aiming to aid on the decision-making of the city’s environment department. The monitoring network was designed with the purpose of supporting the inspection and licensing of potentially pollutant activities. The monitoring network was built with 12 stations, where 5 physical and chemical parameters were measured, besides water flow. The monitoring period lasted for 12 months. Hydrological studies on the region’s hydrographic, physiographic and topographic characteristics were carried out to define the monitoring stations. The quality data generated by the network were statistically analyzed by PCA. The component that better explained the sampling variation presented as parameters the nitrogen series, phosphor, biochemical and chemical demand for oxygen and electrical conductivity. These parameters indicate pollution by domestic waste. The second component presented chrome, nickel and zinc, indicating a possible contamination by release of waste from metal treatment activities. The third component presented aluminum and iron, which are present in large scale in the region’s soil, evidencing a natural process. With the monitoring network it was possible to establish some management actions for the city’s environment department, mainly regarding the need to control the release of domestic waste. Also, non-structural actions must be taken to increase inspection on metal treatment activities, finding illegal businesses, and even to increase licensing requirements for new projects in this sector. The monitoring network proved to be an important element of environmental management and action planning for agencies that deal with environmental matters and water resources.
Acknowledgements The authors would like to thank CNPq (National Council of Scientific and Technological Development) for the support to Professor Alexandra Finotti and the Secretariat of the Environment of Caxias do Sul for the financial support and collaboration in the conduction of this study.
References [1]
Finotti, A.R.; Finkler, R.; Silva, M.D.; Cemin, G. Monitoramento de recursos hídricos em áreas urbanas. Caxias do Sul, Brazil: EDUCS, 2009.
WIT Transactions on Ecology and The Environment, Vol 182, © 2014 WIT Press www.witpress.com, ISSN 1743-3541 (on-line)
Water Pollution XII
[2]
143
Ouyang, Y. Evaluation of river quality monitoring stations by principal component analysis. Water Research, 39, pp. 2621–2635, 2005. [3] Perona, E.; Bonilla, I.; Mateo, P. Spatial and temporal changes in water quality in a Spanish river. The Science of the total environment, 241, pp. 75–90, 1999. [4] Helena, B.; Pardo, R.; Veja, M.; Barrado, E.; Fernandez, J.M.; Fernandez, L. Temporal evolution of groundwater composition in na alluvial aquifer (Pisuerga River, Spain) by principal component analysis. Water Research, 34(3), pp. 807–816, 2000. [5] Andrade, E.M. de; Araújo, L.F.P.; Rosa, M.F.; Gomes, R.B.; Lobato, F.A.O. Fatores determinantes da qualidade das águas superficiais na bacia do Alto Acaraú, Ceará, Brasil. Ciência Rural, 37(6), pp. 1791–1797, 2007. [6] Yang, H.; Shen, Z.; Zhang, J.; Wang, W. Water quality characteristics along the course of the Huangpu River (China). Journal of environmental sciences, 19, pp. 1193–1198, 2007. [7] Kazi, T.G.; Arain, M.B.; Jamali, M.K.; Jalbani, N.; Afridi, H.I.; Sarfraz, R.A.; Baig, J.A.; Shah, A.Q. Assessment of water quality of polluted lake using multivariate statistical techniques: a case study. Ecotoxicology and environmental safety, 72, pp. 301–309, 2009. [8] Shrestha, S. and Kazama, F. Assessment of surface water quality using multivariate statistical techniques: A case study of the Fuji river basin, Japan. Environmental Modelling & Software, 22, pp. 464–475, 2007. [9] Wu, B.; Zhao, D.; Zhang, Y.; Zhang, X. and Cheng, S. Multivariate statistical study of organic pollutants in Nanjing reach of Yangtze River. Journal of Hazardous Materials, 169, pp. 1093–1098. 2009. [10] Bouza-Deaño, R.; Ternero-Rodríguez, M.; Fernández-Espinosa, A.J. Trend study and assessment of surface water quality in the Ebro River (Spain). Journal of hydrology, 361, pp. 227-239, 2008. [11] Tundisi, J.G.; Tundisi, T.K. Limnologia. São Paulo, Brazil: Oficina de Textos, 2008. [12] CETESB. Companhia Ambiental do Estado de São Paulo Web site. Variáveis de qualidade da água. www.cetesb.sp.gov.br/Agua/rios /variaveis.asp#coliformes.
WIT Transactions on Ecology and The Environment, Vol 182, © 2014 WIT Press www.witpress.com, ISSN 1743-3541 (on-line)