University of Nebraska - Lincoln
DigitalCommons@University of Nebraska - Lincoln Faculty Papers and Publications in Animal Science
Animal Science Department
2015
Development of a Row-Crop Tractor Data Acquisition System J. Roeber University of Nebraska-Lincoln
Santosh Pitla University of Nebraska-Lincoln,
[email protected]
R. Hoy University of Nebraska-Lincoln
Joe D. Luck University of Nebraska-Lincoln,
[email protected]
Follow this and additional works at: http://digitalcommons.unl.edu/animalscifacpub Part of the Genetics and Genomics Commons, and the Meat Science Commons Roeber, J.; Pitla, Santosh; Hoy, R.; and Luck, Joe D., "Development of a Row-Crop Tractor Data Acquisition System" (2015). Faculty Papers and Publications in Animal Science. 929. http://digitalcommons.unl.edu/animalscifacpub/929
This Article is brought to you for free and open access by the Animal Science Department at DigitalCommons@University of Nebraska - Lincoln. It has been accepted for inclusion in Faculty Papers and Publications in Animal Science by an authorized administrator of DigitalCommons@University of Nebraska - Lincoln.
An ASABE Meeting Presentation Paper Number: 152187827
Development of a Row-Crop Tractor Data Acquisition System J. Roeber, S. Pitla, R. Hoy, J. Luck University of Nebraska-Lincoln, Department of Biological Systems Engineering; University of Nebraska-Lincoln.
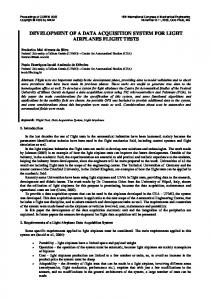
Written for presentation at the 2015 ASABE Annual International Meeting Sponsored by ASABE New Orleans, Louisiana July 26 – 29, 2015 Abstract. Numerous advancements in machinery performance on row-crop agricultural tractors have been made in recent years. Currently, the Organisation for Economic Co-operation and Development (OECD) only tests predetermined points (E.g., max. power, max. torque) for drawbar and hydraulic power. This method of testing has been used for many years with the tractor at a steady state which is usually not typical of row-crop operations. A data acquisition system (DAQ) was designed that records implement energy consumption (E.g., drawbar loading, PTO power, and hydraulic power). The system used a LabVIEW program and a compact data acquisition system (cDAQ) to record data from instrumentation outputting drawbar, PTO, and hydraulic loads. Data were then collected and verified in accordance with OECD standards at the Nebraska Tractor Test Lab (NTTL), an official OECD testing facility. Requirements of the system were: implementation of the system on multiple machines with minor alterations, minimally invasive to the factory design of the tractor, and equivalent data compared to those recorded by the NTTL testing devices and procedures. Manufacturers’ calibration information along with standardized testing equipment used to tune NTTL testing devices were used to verify that the system would perform according to OECD guidelines. The collection methodology included hydraulic testing at steady state in accordance to OECD Code 2. The hydraulic system was verified with varying curvatures near the sensors that provided data within a 1 percent error of the actual hydraulic power. Another test included calibration of a strain instrumented drawbar within 100 lbf of a dynamic load. Keywords. Tractor test, Data acquisition, Drawbar power, Hydraulic power
Introduction Agricultural tractors are used throughout the year for various row-crop operations, utilizing different implements. The authors are solely responsible for the content of this meeting presentation. The presentation does not necessarily reflect the official position of the American Society of Agricultural and Biological Engineers (ASABE), and its printing and distribution does not constitute an endorsement of views which may be expressed. Meeting presentations are not subject to the formal peer review process by ASABE editorial committees; therefore, they are not to be presented as refereed publications. Citation of this work should state that it is from an ASABE meeting paper. EXAMPLE: Author’s Last Name, Initials. 2015. Title of Presentation. ASABE Paper No. ---. St. Joseph, Mich.: ASABE. For information about securing permission to reprint or reproduce a meeting presentation, please contact ASABE at
[email protected] or 269932-7004 (2950 Niles Road, St. Joseph, MI 49085-9659 USA).
Typically, these implements are powered by the tractor via draft power, high pressure hydraulic fluid and a power take-off (PTO) shaft. Several of these processes demand the most and usually continuous energy from the tractor (e.g. drawbar, PTO), while others are low demand or intermittent operations (e.g. hydraulics). Tractor performance is currently measured according to the standards of The Organisation for Economic Cooperation and Development (OECD) Code 2 for the official testing of agricultural and forestry tractor performance. All OECD approved tractors must complete a set of tests to determine the engine performance through the PTO, tractive performance as a result of drawbar pull, and hydraulic power (OECD, 2014). The mandatory test for hydraulic power requires the hydraulic case fluid to be within a 5 degree tolerance of 65°C, and is to be stated in the report if temperature is unable to be achieved. In normal operating conditions, environmental temperature and operating load can have a dramatic effect on the initial and rate of change of the fluid temperature. The test must also be conducted at maximum engine speed, which is not always reasonable for normal operations. Similarly, when testing drawbar performance, tractors are tested in the gear/speed setting in which the greatest maximum power is developed and the gear/speed immediately above and below. However, the fuel consumption test during the drawbar power test (section 4.4.2.2, OECD 2014) provides information on operational efficiency at partial loads. The official test consists of five sub tests: maximum drawbar power at rated speed, two tests that are at 75 per cent of maximum drawbar power at rated speed, and two tests that are at 50 per cent of maximum drawbar power at rated speed. These tests are performed to assess two gear/speed settings typically used for fieldwork, and it suggests a nominal speed of 7.5 kmh-1 and the other giving a nominal speed between 7 and 10 kmh-1. Most implements are not used continuously in field conditions and utilize more than one source of energy transfer between the tractor and the implement during operation. Current testing procedures at the OECD-approved Nebraska Tractor Test Laboratory (NTTL) does not measure multiple energy flows simultaneously. A new tractor testing methodology called the PowerMix testing is currently being used in Germany at the DLG Test Center Technology and Farm Inputs. The DLG exceeds the OECD-Standard tests to gain tractor performance characteristics under normal field and transport operations and carries out the PowerMix test by combining traction, PTO, and hydraulic loads while measuring the specific fuel consumption under fourteen different workload scenarios. (Lech & Winter, 2015). One of the most frequently used standards for agricultural machinery is the ASAE Standard D497.7 Agricultural Machinery Management (ASAE D497.7, 2011). This standard gives information on required draft power, PTO power, and operating speeds, but combines the independent power requirements for all implement connections utilizing energy from the tractor. Differences in machine design, machine condition, and crop characteristics are accounted for by the expected range value which can vary from 20 to 50 percent of the typical range, which could significantly affect the proper sizing of machinery combinations. To give more practical test results for row crop tractors used in the United States, the NTTL could incorporate tests for tractors under multiple load conditions (i.e., PTO, hydraulic, and drawbar loads). To determine the scenarios which a tractor will face, current operations will need to be monitored and standardized. Originally, a plan for measuring the implement interface was devised to log Controller Area Network (CAN) bus data from the tractor. A channel list was created in accordance to the J1939 standard to gather messages from the bus. However, many of the desired message packets are not available publicly and another standard (ISO 11783) is required for many of the implement/peripheral messages used with Virtual Terminal (VT). A plan of this scale would require many hours of data analysis, post-processing, and would limit the accuracy based on the inconsistency of CAN sampling rates. Furthermore, a separate system would also be needed to ensure the data was relevant and accurate. With limited implement data that could be collected from the CAN bus, other means of instrumentation became more plausible. Similar research began quantifying machinery operational performance, but they approached the problem from the stance of the tractor efficiencies. Burgun et al. (2013) instrumented, using embedded buses and sensors, a Massey Ferguson 6475 90kW tractor (a popular mid-sized tractor in France) for tillage, seeding, fertilizer, and transport operations. Using the embedded buses (CAN and ISOBUS) and decoding according to the SAE J1939 protocol engine speed (RPM), engine percentage load (%), and fuel consumption (l/h) were accessed, along with global position, vehicle speed, selected gear, and hitch position. A dedicated recording device connected to the J1939 diagnostic plug behind the seat. They considered the three main power flows to be delivered to the wheels, PTO, and the hydraulics. Torquemeters and incremental encoders were used on both rear axles to measure each wheel’s torque and speed independently. The purpose of measuring each wheel independently is due to a power differential in the axle housing that transfers power from the driveshaft to the axles, thus allowing each wheel to spin at differing rates. Power at the front wheels was assumed to be given by torque and speed of the 4-wheel drive shaft. The 4WD speed was given by the transmission ratio and the rear final drive speed. A commercially available PTO torque and speed-meter from DATUM was used for power 2015 ASABE Annual International Meeting Paper
Page 1
monitoring if the PTO shaft was required by an implement. The DATUM transducer is a contactless slip ring with a female coupler on one end and a male shaft on the other end. A flow turbine (HYDROTECHNIK RE6) and pressure transducer were instrumented in the main hydraulic pump line before the rear block to capture the hydraulic power generated. This allowed total flow from the hydraulic pump to be measured. Engine fan speed was considered a significant power-absorbing auxiliary and recorded as well due to the viscous drive; which allows the fan speed to differ from engine speed. All the added signals were connected to an autonomous black box that contained a CAMPBELL CR-3000 and CR-1000 data acquisition boards connected via serial communications. Their goal with this system was to evaluate agricultural machinery performance, consisting in describing the energy requirements set by an implement during field applications and in expressing the related operational efficiency (Burgun el al., 2013). A study by A. F. Kheiralla (2001) about instrumenting a DAQ to map power and energy demand was based on custom made sensors. A Massey Ferguson 3060 was selected as a typical size, general use oil palm plantation tractor for operation in Malaysia. The onboard instrumentation system which measured engine speed, PTO speed, forward speed, wheel slip, acres worked, fuel consumption per hour or hectare, acres per hour, cost factor, fuel consumed, fuel remaining, and distance. This factory system includes a radar sensor for ground speed, a magnetic pickup to measure tractor rear wheel shaft rotation, and a flow meter to measure fuel flow. Additional instrumentation included a custom-built drawbar transducer, wheel torque sensors, a PTO shaft torque sensor, and a 3-point dynamometer. Drawbar force was measured with a proof ring installed toward the front of the drawbar to reduce lateral and longitudinal moments. An aluminum alloy was used to give the transducer greater sensitivity. Strain gages were bonded in pairs at the nodes and at 90° locations on the inner and outer circumferences of the proof ring, and connected in a full bridge configuration. The rear wheel torque transducers are designed based on extension shafts. A RBE-4A Kyowa slip ring and custom built adapters to fit onto the axle and the tire rim. The PTO shaft torque transducer is a modified commercial drive shaft with a slip ring on the free female end and a universal joint on the other end. A Data Electronics Datataker 605 along with a Compaq Contura 3/25C notebook was employed as the DAQ using an in-house Decipher Plus software. (Kheiralla et al., 2001) Kheiralla does not present a method or measurement for hydraulic power in their research pursuit. This paper presents a novel approach for an acquisition system of agricultural implement energy requirements during field applications. This system would require that all points on the interface between the tractor and implement be measured accurately and repeatable. For this, a signal list was established to measure draft loads (drawbar and 3-point), hydraulic power, and PTO. A restriction to this system would be that it could be employed on different agricultural machinery combinations while being as minimally invasive to the design of the machine. Realizing a draft load would not be connected by way of the drawbar and 3-point in the same situation, the drawbar was deemed more suited to the initial development of the system. Objectives The objectives of the current research work were to • •
Develop an instrumentation and data acquisition system that could be implemented on a row-crop tractor to determine the flow of energy through the tractor/implement interface. Validate the collected data by comparing the recorded data with the NTTL tractor data.
Materials and Methods The instrumentation was based on the desired interfaces to capture the energy used by the implement. Analog instrumentation was preferred for its availability and ease of use. Hydraulic DAQ Development Instrumentation The hydraulic system consisted of two measurements, pressure and flow, which were used to calculate hydraulic power, a necessary parameter in energy flow through this interface. Considering a Selective Control Valve (SCV) has an inlet and an outlet port, two separate hydraulic lines would be measured per SCV. Flow through the two lines would be equal unless a leak was detected. From this point of view, only one flow meter was chosen. The Flo-tech (Activa F6206-AVB-NN, Racine, Wisc.) is an analog, turbine flowmeter with a 4-80 gallons per minute rating. It has additional ports for a temperature and pressure transducers all in one housing to provide compactness (Fig. 1). Turbine flowmeters are inherently bidirectional, which is ideal when only using one flowmeter. Input voltage is in the range of 10-26V with a conditioned output of 0-5V, and an error of 32cSt. (Flo-tech, 2010) 2015 ASABE Annual International Meeting Paper
Page 2
Pressure sensor
Flowmeter
Figure 1: Hydraulic DAQ apparatus for measuring fluid power in a single SCV.
If a hydraulic motor were present in the system the torque produced would result from a pressure drop between the lines. So, two Omega Px309 pressure transducers were selected for pressure range and cost. With a range of 0-5000 psi and input of 10-30V and an output of 0-5V make it an ideal companion with the Flo-tech flowmeter. (Omega, 2014) Sensor Location Considering the installation of a system between the hydraulic pump and SCVs would require cutting and plumbing new lines, an external system that would extend the interface of the tractor/implement was envisioned to ease operator use and limit system interference. Using standard ISO 5675/ Pioneer 4000 hydraulic couplers with ¾” x 12” hose and adapters to fit the SAE 16 (1”) ports on the flowmeter were used to create the flexible extension hoses that would serve as the measurement apparatus. Male ends would simply plug into the SCV, one line would contain the flowmeter with a pressure transducer, and the other would hold the second pressure transducer (Fig. 2). The hoses would be fixed to the 3 pt. system with female couplers to closely imitate the SCVs.
Figure 2: Mounting location for the hydraulic apparatus on the rear of tractor.
Calibration and Test Procedure With both sensors being commercially available, calibration values were used from the manufacturers’ 3-point test which is traceable to NIST standards. Validation was tested against the OECD approved methods and equipment used by NTTL for hydraulic power testing. The test emulated the OECD code at maximum engine speed with additional engine speeds at 1200, 1500, and 2100 rpm, if different from maximum engine speed. These points correspond to frequent operating ranges for transport and field operations in which hydraulic power may be used. A hydraulic apparatus used by NTTL for official tests was utilized to add simulated loads via a needle valve. The procedure was to report the hydraulic power available at the SCV, at the flow rate corresponding to a hydraulic pressure equivalent to 90% of the actual relief valve pressure setting. A dynamic pressure curve was to be developed at each engine speed to determine the maximum available hydraulic power with flow through a single coupler pair, and another curve with coupler pairs operating simultaneously. These curves would provide a range of available hydraulic power. The recorded values were pressure, flow, and calculated power from both the tractor sensors and the testing apparatus. Hydraulic temperature was also recorded by the test device.
Drawbar DAQ Development The drawbar interface was challenging when a minimally invasive instrument is to be employed. Several approaches could be made: an instrumented drawbar pin, instrument the drawbar, or add a load cell attached to 2015 ASABE Annual International Meeting Paper
Page 3
the drawbar. Fastening a load cell to the end of the drawbar would create a cantilever that would affect the tractive efforts of the tractor. A design complication of having a rigidly mounted load cell would prove ineffective in measuring lateral loads seen in contour or headland operations. Instrumenting the drawbar with strain gages would prove to be the most effective at measuring draft in all directions. The difficulty with instrumenting the drawbar is calibration of the strain gages on multiple agricultural machinery setups. Each drawbar would need to be calibrated, which requires a test bench to travel to all applications sites or removal of the drawbar and sent to a location for instrumentation and calibration. The final method of instrumenting a drawbar pin has been done, but creates much noise in the data. A slightly different approach of applying strain gages to the pin where the axle meets the front of the drawbar. The tolerances between the drawbar and this pin are significantly smaller and minor non-invasive steps can be taken to ensure the pin would not rotate in position. The problem with a freely rotating pin would generate a direction of strain error. Velocity of the tractor is another key variable in determining power consumption of an implement. Multiple methods have been implemented previously, such as encoders for individual wheel speed, a separate wheel to measure true travel speed, or using GPS. Using encoders on each wheel provides the efficiency of drawbar pulling force, but only if you have a separate method of measuring the true travel speed. The pulling efficiency is not relevant when measuring the implement load; therefore, a GPS receiver was determined to be more reliable than a separate wheel. The GPS receiver is a Trimble Copernicus II module, a complete SBAS (WAAS, EGNOS, and MSAS) receiver. Protocols are given in NMEA, TSIP, TAIP serial strings. (Trimble, 2009) Sensor Location For an initial prototype design, a drawbar was deemed appropriate. The ideal location to minimize horizontal loading is as close to the front drawbar support as possible. Any wiring and the sensors themselves would then need to be protected from debris. Material was milled from the surface of the drawbar to increase the sensitivity and provide a smooth surface to mount the strain gages (Fig. 3). Two 90 degree strain rosettes were mounted on either side of the drawbar to measure the axial load in a full-bridge temperature compensated configuration. A cross-drilled hole provides a raceway between the rosettes for the sensor wire to be routed safely. Strain gages
Front of drawbar Figure 3: Drawbar illustrating sensor location.
An external antenna was routed to obtain maximum visibility of the sky, while being as close to the rear of the tractor as possible. The receiver would be located inside the cabin of the tractor to reduce environmental hazards. Calibration and Test procedure The drawbar was attached to a 100,000 lb. load cell which conformed to ASTM Standard Practice E74. The load cell was attached to a hydraulic cylinder to develop load, the other end was attached to a steel plate which was then attached to the drawbar. The calibration procedure began with loads of 1000, 2000, 3000, 5000, 10,000, 15,000, 20,000, 25,000, 30,000 lbf. Any load under 1000 lbf was assumed to be highly variable due to being either transport or headland turn. Loads over 30,000 lbf was assumed to be on heavy tillage equipment used by heavily ballasted 300 HP, track laying, or 4WD tractors. Strain electrical values were recorded 3 times near the anticipated loads and scaled to match the respective load cell values. The scaled values were then repeated 3 times to adjust the point-to-point variation. This process was repeated until drawbar values were 100 lbf of the load cell. Testing procedures followed the OECD code (section 4.4.2.1). Tests shall be made at least in those gears/speed settings, from one giving a travel speed immediately faster than in the gear/speed setting in which the greatest maximum power is developed down to one immediately slower than the gear/speed setting allowing maximum pull to be developed. The calibrated drawbar load, and a GPS calculated speed were the signals to be verified by a dynamometer truck used by NTTL. The truck will provide engine speed, power, drawbar pull, and ground speed.
2015 ASABE Annual International Meeting Paper
Page 4
PTO DAQ Development Many different options were commercially available for measuring PTO torque. Several companies offer flanged slip ring torque sensors that allow different shaft connections to be made. However, two available torque sensors are purpose built to be instrumented on the PTO shaft. The Datum Electronics Series 420 PTO Shaft Torque and Power Monitoring System is a complete non-contact PTO shaft extension system that provides digital output directly proportional to torque (DATUM, 2012). It is capable of measuring torque up to 2,500 Nm on a 1 ¾” shaft. Another sensor of similar design made by NCTE, designated the Torque Sensor Series 7000 is also a plug and play solution which measures up to 5,000 Nm with an analog 0-10 V output. With costs and signal conditions being the largest factors in the decision, the least expensive Datum transducer with a serial or analog connection was considered the better of the two options (Fig. 4). Energy collected through the PTO interface will be a function of rotational speed and torque produced.
Figure 4: Datum PTO Power Monitoring System on rear tractor PTO shaft.
Sensor Location These systems would attach inline to the male PTO shaft on the rear of the tractor utilizing a female coupler with a male shaft returning out the rear of the sensor (Fig. 4). A tether will provide anti-rotational protection for the ring of the transducer. The complete sensor will be compatible with only one PTO shaft configuration. Calibration and Test Procedure Calibration values were provided from the manufacturer to conform to the ISO 6789 and ISO 9001 standards. The PTO test followed the OECD code section 4.1.1.3, Tests at varying load. The governor control would be set for maximum power at rated engine speed, and at standard power take-off speed. The torque of both the sensor and the dynamometer along with the PTO speed as recorded by both instruments were to be collected. The engine speed was also collected as per OECD instructions while fuel and reagent consumption would not add pertinent data to verify the accuracy of the PTO sensor. The following loads from OECD Code 2 section 4.1 were to be verified: 4.1.1.3.1.1 The maximum power at standard PTO speed; 4.1.1.3.1.2 85% of the maximum torque at standard PTO speed; 4.1.1.3.1.3 75% of the maximum torque at standard PTO speed; 4.1.1.3.1.4 50% of the maximum torque at standard PTO speed; 4.1.1.3.1.5 25% of the maximum torque at standard PTO speed; 4.1.1.3.1.6 Unloaded (with the brake disconnected). (OECD, 2014)
DAQ Hardware Development A variety of companies offer many types of data acquisition systems for almost any application. Due to experience and resources, a DAQ from National Instruments (NI) was utilized for this system. A NI Compact Data Acquisition System (cDAQ) was used to collect the signals using C series modules. Two NI 9205 were purchased to collect analog channels. Each has a 32 single-ended or 16 differential channel capacity, with an analog to digital converter resolution of 16 bits, and input voltage range of ±10 V. Universal analog input modules (NI 9219) were purchased to read various signal types simultaneously, such as: voltage, current, thermocouple, and resistance. 2015 ASABE Annual International Meeting Paper
Page 5
Another feature of this module was the bridge completion for quarter and half bridge based sensors.
DAQ Software Development A LabVIEW API was to be created for each system and then combined into a single API that would allow the systems to operate independently or simultaneously. Each independent system’s VI consisted of an initialize phase. This phase would create a task related to one or more physical channels, the task could then be scaled and started. Another phase was to read the data from the physical devices, hydraulic system, drawbar, and PTO transducer at 1000 Hz. The GPS was limited to 1 Hz sampling. Phase 3 was to log the data to a TDMS file. With a sampling rate of 1000 Hz for a majority of the system components, a very large file would be created for the dataset. The solution for this problem was to average the data over 1 second, which would provide a smoother data stream while having the ability to see sudden changes in the system. The final phase was to close the channels to prevent software resources from being queued for the program when not in use.
Results and Discussion Hydraulic Bench Test A preliminary test was developed for the hydraulic system to verify the suggested location orientation would function properly. The test utilized the same LabVIEW program that was be used for the final prototype (Fig. 5). The sensors and hoses were mounted to a 2 ft. x 4 ft. x ½ in. plywood board using U-bolts. The hose ends were able to be mounted in a straight-line configuration (0°), 45°, 90°, or any combination of these bends (Fig. 6, 7, 8).
Figure 5: LabVIEW front panel of hydraulic test program.
Figure 6: Device under test (DUT) in a 90 degree bending configuration.
2015 ASABE Annual International Meeting Paper
Page 6
Figure 7: Straight-through (0-0 degree) DUT setup.
Figure 8: 45-45 degree DUT setup.
To test if there was an effect of the degree of bending on pressure or flow, a control system was utilized. This system contained a flowmeter, strain-type pressure transducers, and a needle valve. A steel tube was mounted to provide 30 cm (12 in.) of upstream and downstream uninterrupted flow (Fig. 9).
Pressure sensor port Needle valve
Flowmeter
Figure 9: Bench test apparatus used by Nebraska Tractor Test Laboratory.
From the results of the test, figures 10, 11, and 12 show the mean pressure of the bench apparatus and the device under test (DUT). The pressure error was the result of the difference of the pressure between the current configuration and a straight through setup. Error was calculated based on the pressure difference compared to the overall Bench pressure in equation (1):
PE = Pressure Error (%)
𝑃𝑃𝐸𝐸 =
��𝑃𝑃𝐷𝐷𝐷𝐷𝐷𝐷𝑛𝑛 − 𝑃𝑃𝐵𝐵𝑛𝑛 � − �𝑃𝑃𝐷𝐷𝐷𝐷𝐷𝐷0 − 𝑃𝑃𝐵𝐵0 �� 𝑃𝑃𝐵𝐵𝑛𝑛
(1)
PDUT = Mean DUT Pressure (kPa) PB = Mean Bench Pressure (kPa) n = nth sample 2015 ASABE Annual International Meeting Paper
Page 7
0 = initial sample Comparing the different bends at the 1200 rpm engine setting, yielded a linear pressure pattern. A large error increase is seen at the 90-45 configuration (Fig. 10). These patterns are seen in all pressure settings in this flow range with most error being well below 1 percent.
490
14
470
12
450
10
430
8
410
6
390
4
370
2
Error
Pressure (kPa)
Pressure Difference at 1200 rpm Full Flow
0
350 0-0
45-0
90-0
45-45
90-45
90-90
Pressure Error (kPa)
% Pressure Error
Mean Bench Pressure (kPa)
Mean DUT Pressure (kPa)
Figure 10: Average pressure and error of test arrangements at 1200 rpm with needle valve completely open.
When inspecting each flow range, the 90-45 bending configuration always had higher error than any other configuration. Pressure error above 1 percent appears at the full flow conditions. Comparing the difference between the lowest flow and the highest flow with the needle valve fully open, the 450 bend test increases in error by 0.39% or 7 kPa compared to the Bench. The maximum error difference is a 2.5% decrease between the high and low flow rates which is at the 90-90 bend test. As the pressure rises at each flow rate, the error decreases (Fig. 11, 12).
1200
30
1150
25
1100
20
1050
15
1000
10
950
5
900
Error
Mean Pressure (kPa)
Pressure Difference at 2900 rpm Full Flow
0 0-0
45-0
90-0
45-45
90-45
90-90
Pressure Error (kPa)
% Pressure Error
Mean Bench Pressure (kPa)
Mean DUT Pressure (kPa)
Figure 11: Average pressure and error of test arrangements at 2900 rpm with needle valve completely open.
2015 ASABE Annual International Meeting Paper
Page 8
10650
30
10600
25
10550
20
10500
15
10450
Error
Mean Pressure (kPa)
Pressure Difference at 2900 10.342 MPa (1500 psi)
10
10400
5
10350 10300
0 0-0
45-0
90-0
45-45
90-45
90-90
Pressure Error (kPa)
% Pressure Error
Mean Bench Pressure (kPa)
Mean DUT Pressure (kPa)
Figure 12: Average pressure and error of test arrangements with needle valve resistance of 10.342 MPa (1500 psi)
Since the 90-90 configuration was a more relevant test for the location of the sensors, each flow range was compared (Fig. 13). This showed that the pressure error grew as flow increased at all pressure ranges. As figures 12 and 13 depict, the pressure error decreased as the pressure increased. However, the overall error had minimal changes, in the operating range of the tractor.
Pressure vs. Flow at 90-90 Configuration 10.342 MPa (1500 psi) 15
10600
10
10500 5
10400 10300
Error
Pressure (kPa)
10700
0 1200
1500
2100
2700
2900
Engine Speed (rpm) Pressure Error (kPa)
% Pressure Error
Mean Bench Pressure (kPa)
Mean DUT Pressure (kPa)
Figure 13: Average pressure differences and errors compared to the engine speed using the 90-90 degree test arrangement.
Drawbar Calibration Test A calibration was performed on the drawbar according to the procedure listed above. The LabVIEW program was developed to read the mVV-1 values from the strain gages and the load cell, it would then display and record the mVV-1, percent difference in pull, and if the scale was provided, the force (lbf). Data collection averages, Run 1 Approximate Load (lbf) ~500
Drawbar Pull (mV/V) 0.698
Gold Standard Load cell (lbf) 650
~1,000
0.705
1,069
~2,000
0.716
2,023
~3,000
0.732
2,917
2015 ASABE Annual International Meeting Paper
Page 9
~5,000
0.756
4,564
~10,000
0.830
9,716
~15,000
0.904
14,807
~20,000
0.977
19,930
~25,000
1.049
24,887
~30,000
1.124
30,222
Table 1: The average static strain value at a given load used as a final scale for the tested drawbar.
The calibration was repeated 3 times to obtain a repeatable electrical value around the desired calibration points (Table 1). A scale was applied to these points, and the test was repeated another 3 times to determine the percent difference in pull. Testing proceeded to average 3 runs each time before adjusting the calibration scale by multiplying the previous pull load by the percent difference in pull. The goal was to have a difference of