Macgregor, Sylvia Robinson, "Information system support as a critical success factor for chronic disease management: Necessary but not sufficient", International.
2011 4th International Conference on Biomedical Engineering and Informatics (BMEI)
Development of a Web-based Quality Indicators Monitoring System for Long-term Care Facilities Ean-Wen Huanga/Jung-Chun Chena/ Fei-Ying Liub /Shwu-Fen Chiouc /ChingMiin Duha a
Department of Information Management b Institute of Tourism and Health Science c Department of Nursing National Taipei University of Nursing and Health Sciences Taipei, Taiwan, R.O.C.
Der-Ming Liou
Suh-chin Wang
Institute of Biomedical Informatics, National Yang-Ming University Taipei, Taiwan, R.O.C
Department of Nursing
Abstract—Population aging is an important issue in Taiwan. The percentage of elderly members of the population has been growing quickly during recent years. The requirements of longterm care for chronic and functionally impaired patients are rapidly increasing. Beside medical treatment, the needs of longterm care facilities are also continuously increasing. Among the variants of long-term care institutions, the quality of healthcare service varies widely and lacks an objective assessment indicator. In order to manage healthcare quality, Taiwan Long Term Care Association has defined six quality indicators including number of falls, nosocomial infections, use of physical restraints, nonplanned weight gain or loss, pressure ulcers and non-planned transfers to acute hospitals. In order to facilitate, collect and calculate the indicators, the Association cooperates with us to implement a service system. The architecture of the system has four components including Data Collection Subsystem, Report Generation Subsystem, Aggregation and Analysis Subsystem and System Administration Subsystem. In this paper, we introduce and share our experience of the system's development. Keywords long term care; nursing home; quality indicators; web-based system.
I.
INTRODUCTION
The United Nations has defined an “aging society” as a population in which the percentage of people over 65 years is greater than 7 percent; when that percentage increases beyond 14 percent, the population is deemed an "aged society." The population of Taiwan is about 23.4 million. According to a government estimation report [1], the number of senior citizens over 65 accounted for 10.7 percent of the nation's total population in 2010. The report also predicted that the proportion would exceed 14 percent by 2017, meaning that the nation will become an aged society at that time, and then would exceed 20 percent by 2025. The average life expectancy is 76.1 years for men and 82.7 years for women in 2010; the report predicted that the average life expectancy would be 78.3 years for men and 84.9 years for women in 2020. The burden of supporting the healthcare expenses for the elderly population is significant. According to statistical data from the Bureau of National Health Insurance of Taiwan, in 2006, the average
978-1-4244-9350-0/11/$26.00 ©2011 IEEE
National Taiwan University Hospital Bei-Hu Branch Taipei, Taiwan, R.O.C.
amount spent by the elderly population for health insurance was about 7 times that of other age groups [2]. In 2010, there are 1089 long-term care and elderly care facilities in Taiwan with about 41000 residents with an average of 2.15 residents per staff [3]. The Healthcare Indicator is the measurement for patients' care quality. According to the Joint Commission on Accreditation of Healthcare Organizations (JCAHO), an indicator is a quantitative measure of an aspect of patient care [4]. Because the quality is difficult to quantify, using more objective evidence for monitoring is necessary. Although the quality of healthcare is difficult to measure, it can take certain problems into account. The development of long-term care quality indicators is based on the JCAHO and the Taiwan Quality Indicator Project (TQIP) definitions. The Association continuously modified the evaluation items. The latest version was finished in 2009 and was promoted as the basis of the institution's quality assessment. There are many studies in the quality of care for nursing home. Chia-Ling Yang suggested seven important indicators of quality of nursing homes including environment, nursing professional competence, quality assurance, basic human rights, direct care attitude, social satisfaction [5]. Ming-Nan Kao investigated on aged care quality of nursing home [6]. Chen LiChuan used observable indicators of nursing home care quality instrument to measure quality of nursing home care [7]. Noemi C. et al. tested an Internet report card containing information about quality indicators and assessed consumer satisfaction and quality in nursing homes [8]. Carolyn J. Greena et al. suggested that Information system support is a critical success factor for chronic disease management [9]. The Taiwan Long Term Care Association has defined six indicators for monitoring long-term care quality including number of falls, nosocomial infections, use of physical restraints, non-planned weight gain or loss, pressure ulcers and non-planned transfers to acute hospitals [10, 11]. The indicators are reviewed frequently and have been the institution assessment requirements since 2010. Each indicator has a number of items that are reported each month. The data were
1941
entered into MS-Excel worksheets and collected through Email or CD-ROM initially. It always took some time in routine data entry and report gathering each month; in order to promote efficiency and reduce retyping errors, the Association decided to develop a web-based system to automatically collect indicator data, generate monthly and yearly reports and analyze the quality and performance of long term-care institutions. This project is based on six long-term care quality indicators to implement a user-friendly system. The administrator of longterm care institutions may conveniently enter indicator items each month and save them into a database to provide further query and analysis. The system may also help the users to reduce the indicators' calculation time and generate the assessment reports quickly. II.
METHODS
The process of developing this system included system analysis, design and development. We studied the indicators guidelines and discussed them with Taiwan Long Term Care Association to confirm the system requirements. Before the system development, the institutions need to count the number of incidents for each indicator item and follow the formulas to calculate ratios each month. They entered the data into an Excel worksheet and sent printed reports or a CD-ROM to the Association monthly. The Association needs to spend time and man power to aggregate, check and analyze the data. At the end of the year, each institution was required to send another yearly report in the summary indicators for each month. In order to improve the process, we decided to develop an indicator
* Identify Where the User Comes From IP * Add or Modify the Indicators * Generate Monthly Reports * Calculates the Ratios * Check Ratio Item * Alert the Mistake Value * Data Update or Append A Database Record
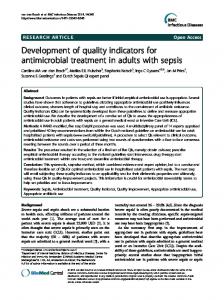
information system to assist both institutions and Association users. The system architecture is show in Figure 1. The functions of the database and each subsystem will be specified below. A. Database Design There are six indicators; each indicator is an independent database table. Each item of the indicators is a field in the database table. Beside the monthly resident numbers, fields of each table are described below: Falls indicator table: the number of total resident-days, the number of resident-falls per month, the number of falls because of health conditions, the number of falls because of drug reaction, the number of falls because of environmentally dangerous factors, the number of falls, injures and the degree, and the number of residents that fell more than once. Nosocomial infections indicator table: the number of total infections, respiratory infections, urinary apparatus infections, the number of residents have used catheters, the number of urinary, the number of urinary apparatus infections with used and unused catheters, and the number of residents with ulcer infection. Physical restraints indicator table: the number of residents with restraints, the number of restraints for prevention of falls, extubation, self-harm, behavior disorder, assistant treatment and other, the number of residents with two or more restrictions and successfully removing the restriction for more than 24 hours.
Database Module * Falls indicator table: * Nosocomial infections indicator table: * iPhysical restraints indicator table * Non-planned weight gain or loss indicator table: * Non-planned transfer to acute hospitals indicator: *Pressure ulcer indicator table: * User Table User Logs
System Administrator * Creating user IDs and passwords * managing and marinating the whole system operation * generate monthly and yearly reports * aggregate and analysis data * user passwords are encrypted * records each user logs
Nursing Home Institution Users
Reports
*Retrieves Indicator Items From The Database *Calculate The Ratios For Each Indicator Item * Display The Results On The Screen * Define A Two-Dimension Buffer * Generate Monthly And Yearly Reports * Print The Report * Copy And Paste The Data To Other Software
* Analyze Cross-Institution Indicators * Select Parameters as Condition * Query from Database * Compare Indicator Performance
Long-Term Care Association Users
Figure 1. The Architecture of Long-term Care Facility Quality Indicators System
1942
Non-planned weight gain or loss indicator table: the number of residents staying for more than 30 days, gain or loss of more than 5 percent body weight within 30 days.
the month's data exists in the database and perform a data update or append a database record.
Non-planned transfer to acute hospitals indicator: the number of new residents, the number of residents and new move in transferring to acute hospitals, the number of new residents transferred to a hospital because of cardiovascular malfunction, bone fracture, gastrointestinal tract hemorrhage, infection and other surgery factors.
C. Report Generation Subsystem After entering the indicator items, the system may generate reports. We followed the report format defined by Taiwan Long Term Care Association to design the system. When users login to the system, he/she may select a yearly report or a monthly report to be generated. The system retrieves indicator items from the database, calculate ratios, and display the results on the screen. Users may print the report directly or copy and paste the data to other software for further use. The subsystem also has six modules; each indicator is an independent module and may generate monthly and yearly reports automatically. The screen of monthly reports is similar to the Data Collection Subsystem. The yearly reports are relatively complicit. The program shall define a two-dimension buffer, retrieve 12month records from the database, calculate the ratios for each indicator item, and then display the values of the twodimension buffer on the screen or print them out to a paper.
Pressure ulcer indicator table: the number of residents with pressure ulcers and their level of severity. B. Data Collection Subsystem The raw data of indicators are input from the Data Collection Subsystem. All of the indicator definitions and formulae are shown on the screen to avoid user error. The subsystem may identify where the user comes from to prepare the data entry environment. Because each indicator is only saved on one record per month, the system will check the system time and retrieve the data from the previous month from the database and display it on the screen. Users may modify the indicators, generate monthly reports or input new data directly. Users may also choose to calculate, confirm or cancel each data entry. The calculate function calculates the ratios for each indicator followed by predefined formulas. Because each ratio could not be larger than 100 percent, the system may check each ratio item and alert the mistake values. When the confirmation button is clicked, the system checks if
D. Aggregation and Analysis Subsystem The Aggregation and Analysis Subsystem is designed for Association users to analyze cross-institution indicators collected from other sites. Users may select parameters of period, institution and aggregation functions as condition and query from database. Uses may also compare each institution's indicator performance.
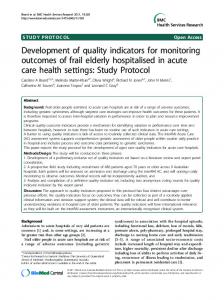
Figure 2. The falls indicator module includes the fields of the number of total resident-days, the number of resident-falls within this month, the number of falls because of health conditions, the number of falls because of drug reaction, the number of falls because of environmentally dangerous factors, the number of falls, injures and the degree, and the number of residents that fell more than once.
1943
E. System Administration Subsystem The system users may be divided into three groups: Users from institutions, Association users, and system administrator. The system administrator is responsible for creating user IDs and passwords and managing the whole system operation. Institution users may enter data and generate monthly and yearly reports, but are restrict only to their institution. The Association users need aggregate and analysis data and may generate monthly and yearly reports for each institution. Each user has their own ID and password. The access privilege is also controlled by the programs; only the institution users may add or modify their own institution's data. The user passwords are encrypted before being saved into the database. The subsystem also records each user login and logout time and IPaddress for auditing use. III.
RESULTS
We have successfully developed a long-term care quality indicators information system. The falls indicator module is shown in the Figure 2. User only select the year and month, then he/she can query the data saved in the database, enter new data and count the ratios, or modify the data and save it into the database. The indicator items include the total number of residents-days, the number of falls and densities, the reasons for falls and the harm levels. Similar to the falls indicator modules, there are a total of six indicator modules in the indicator data collection subsystem. Each module is designed for processing a particular kind of indicator. The report generation subsystem may help to produce monthly and yearly reports. The monthly report may be generated from the indicator items entry module directly. The yearly report is retrieved from data in the database and aggregated 12 monthly reports data together in the report form. One of the institution resident Nosocomial infections yearly reports from 2010 is shown in Figure 3. The Association has promoted and encouraged nursing home users to use the testing system since April 2010. The
system has collected more than one thousand monthly reports records since 2008. We analyzed some care quality indicators and summarize them in Table 1. The average of falls density is 0.06 percent per resident-days, infection density is 0.31 percent per resident-days, physical restraints density is about 1.56 percent per resident-days, the monthly rate of non-planned transfer to acute hospitals is 14.56 percent per resident, the monthly rate of Pressure ulcer is 3.74 percent per residents and the monthly rate of weight loss of more than 5 percent is 2.26 percent, and the weight gain of more than 5 percent is 1.63 percent. The system is implemented in Windows Server 2008 Internet Information Services environment. The programming language is Visual Basic Dot Net. The MS-Access and MSSQL are applied as databases. IV.
DISCUSSION AND CONCLUSION
A quality indicator is very important in healthcare management. The indicator usually becomes an important factor for institution performance evaluation. In order to pass the evaluation by the government or association, institutions need to spend time in preparing data and counting ratios each month and at the end of the year. The Association also needs to pay close attention to the recalculation and correction of the reports sent from the institutions. Through our system, users from institutions only need to spend a few minutes to fill in raw data; the system will calculate and generate correct reports automatically. After the system was implemented, the Association has promoted and encouraged institution users to test and evaluate the system. We have also followed user suggestions to improve the system. The most of the data input for the system only needs to be entered in Arabic numbers, and may assist users in finishing complicated calculations and producing useful report forms. Furthermore, the system's interface is very simple and user-friendly. So, it is satisfactory for most of the institutions' users and Association's users. The Association is planning to promote the system to all of the long-term care institutions.
Figure 3. One of the institution resident nosocomial infections yearly report for each month, including the fields of the number of total resident-days, the number of total infections, respiratory infections, urinary apparatus infections, the number of residents have used catheters, the number of urinary, the number of urinary apparatus infections with used and unused catheters, and the number of residents with ulcer infection..
1944
TABLE I.
Monthly Indicators
SUMMARIZED CARE QUALITY INDICATORS FROM JAN. 2008 TO DEC. 2010
Nosocomial Infections
Falls
Data collected from number of hospitals
Non-planned Weight Loss > 5%
Physical Restraints
Non-planned Weight Gain > 5%
Pressure Ulcers
Non-planned Transfer to Acute Hospitals
10
9
10
10
10
11
8
Total data records(hospital-months)
175
207
171
178
178
159
136
Average number of cases
1.07
5.32
28.79
1.24
0.89
2.33
9.93
54.83(>30days)
54.83(>30days)
62.24
67.76
2.26%
1.63%
3.74%
14.65%
Average number of residents Average rate (Number of case/Number of residents) Average number of resident-days Average density (Number of case/Number of resident-days)
1743.46
1717.69
1846.23
0.06%
0.31%
1.56%
In the near future, we are going to continuously extend the indicators system. If the Association wants to add or modify some indicator items in the database, the system will automatically modify the indicator database, generate new questionnaire tables for users and email the notification to institution users. Through this function, the Association may collect indicator data online in a very short time period. We are also planning to develop a nursing home care incident cases tracing system. Besides collecting each care case in detail, the system will also trace the ways of processing and results after an incident and save them into the database. The system will also provide a query and reasoning functions for other similar cases for further reference. ACKNOWLEDGMENT This work was supported in part by the National Science Council of Taiwan, R.O.C. under Grant NSC97-2221-E-227001-MY3. REFERENCES [1] Council for Economic, Planning and Development. "The estimates for future population in Taiwan area from 2010 to 2060"; http://www.cepd.gov.tw/dn.aspx?uid=8966 [2] Bureau of National Health Insurance, "Detailed Inpatient Expenses by Level of Sex and Age", http://www.nhi.gov.tw/Resource/webdaata/Attach_1045 5_1_95-T101.xls [3] Department of statistics, Ministry of the Interior, "longterm care Overview", June 2010, http://www.moi.gov.tw/stat/news_content.aspx?sn=4594 [4] Nadzam DM., Turpin R., Hanold LS., White RE., "Datadriven Performance Improvement in Health Care: The Joint Commission's Indicator Measurement System (IM
System)". The Joint Commission Journal on Quality Improvement, 19(11), 1993, pp.492-500. [5] Chia-Ling Yang, "Indicators of Quality of Care for Nursing Homes: From the Perspectives of Residents Family, and Nurses", Taiwan Journal of Public Health, vol. 20(3), pp. 238-247. [6] Ming-Nan Kao, "Investigation on Aged Care Quality of Nursing Home –Taking Chain Nursing Homes of Kaohsiung District as Examples", Thesis of Graduate School of Management, I-Shou University, 2006. [7] Chen Li-Chuan, "Using the Observable indicators of Nursing Home Care Quality instrument to measure quality of nursing home care– in Taichung City", Thesis of Graduate School of Long-Term Care, Asia University, 2007. [8] Noemi C., Van Nie, Louk J.M. Hollands, Jan P.H. Hamers, "Reporting quality of nursing home care by an internet report card", Patient Education and Counseling 78 , 2010, pp.337–343. [9] Carolyn J. Green, Patricia Fortin, Malcolm Maclure,Art Macgregor, Sylvia Robinson, "Information system support as a critical success factor for chronic disease management: Necessary but not sufficient", International Journal of Medical Informatics, 75, 2006, pp.818–828. [10] Li-Chan Lin, Institutional Quality Indicators for the Monitoring Operation Manual, Taiwan Long-term Care Professional Associations in, 2009. [11] Indicators for Monitoring the Quality of Long-term care facilities Conference - six quality indicators, http://www.npo.org.tw/Bulletin/ShowAct.asp?ActID=13 589.
1945