biosensors Article
Development of an Immunosensor for Pf HRP 2 as a Biomarker for Malaria Detection Aver Hemben 1 , Jon Ashley 1,2 1 2
*
ID
and Ibtisam E. Tothill 1, *
ID
Surface Engineering and Nanotechnology Institute, Cranfield University, Cranfield, Bedfordshire MK43 0AL, UK;
[email protected] Department of Micro- and Nanotechnology, Technical University of Denmark, Produktionstorvet, 2800 Kgs. Lyngby, Denmark;
[email protected] Correspondence:
[email protected]; Tel.: +44-0-750-076-6487
Received: 13 June 2017; Accepted: 12 July 2017; Published: 18 July 2017
Abstract: Plasmodium falciparum histidine-rich protein 2 (Pf HRP 2) was selected in this work as the biomarker for the detection and diagnosis of malaria. An enzyme-linked immunosorbent assay (ELISA) was first developed to evaluate the immunoreagent’s suitability for the sensor’s development. A gold-based sensor with an integrated counter and an Ag/AgCl reference electrode was first selected and characterised and then used to develop the immunosensor for Pf HRP 2, which enables a low cost, easy to use, and sensitive biosensor for malaria diagnosis. The sensor was applied to immobilise the anti-Pf HRP 2 monoclonal antibody as the capture receptor. A sandwich ELISA assay format was constructed using horseradish peroxidase (HRP) as the enzyme label, and the electrochemical signal was generated using a 3, 30 , 5, 50 tetramethyl-benzidine dihydrochloride (TMB)/H2 O2 system. The performance of the assay and the sensor were optimised and characterised, achieving a PfHRP 2 limit of detection (LOD) of 2.14 ng·mL−1 in buffer samples and 2.95 ng·mL−1 in 100% spiked serum samples. The assay signal was then amplified using gold nanoparticles conjugated detection antibody-enzyme and a detection limit of 36 pg·mL−1 was achieved in buffer samples and 40 pg·mL−1 in serum samples. This sensor format is ideal for malaria detection and on-site analysis as a point-of-care device (POC) in resource-limited settings where the implementation of malaria diagnostics is essential in control and elimination efforts. Keywords: Malaria; Pf HRP 2; parasites; immunosensor; biosensor; nanoparticles
1. Introduction Malaria is a serious disease that is caused by an Apicomplexan Plasmodium parasite that is transmitted by adult female Anopheles mosquitoes, which thrive in tropical and subtropical weather [1]. Malaria affects approximately 50% of the world’s population, and causes millions of deaths [2]. According to the latest World Health Organisation (WHO), estimates, released in December 2016, there were 212 million cases of malaria in 2015, and 429,000 deaths [2]. From this, the African region accounted for the most global cases of malaria (88%), followed by the South-East Asia Region (10%) and the Eastern Mediterranean Region (2%). Despite control efforts, the disease continues to affect productivity, and therefore an effective diagnosis is required for the successful treatment and reduction of both complications and mortality [2]. The methods available for the detection of malaria include blood film microscopy, immunechromatographic tests, and serological tests. Blood film microscopy shows the highest specificity, as it depends on the detection of Plasmodium parasites in blood circulation, and in some cases is essential for epidemiological purposes [3]. This assay is known as the gold standard method for malaria diagnosis despite problems with its field accuracy, unacceptably high false-positive rates, errors in species identification, and its operator-dependence [4,5]. Alternative methods, such as laser desorption mass Biosensors 2017, 7, 28; doi:10.3390/bios7030028
www.mdpi.com/journal/biosensors
Biosensors 2017, 7, 28
2 of 14
spectroscopy (LDMS), loop mediated isothermal amplification (LAMP), and flow cytometry (FCM) are expensive, time consuming, require specialised training, and are characterised by various levels of sensitivity or specificity in relation to sample quality [6–8]. Levels of parasitemia are not necessarily correlative with the progression of the disease, particularly when the parasite is able to adhere to blood vessel walls. Therefore, more sensitive, easy to use diagnostic tools need to be developed in order to detect low levels of parasitemia in the field [9]. Serological malaria tests are blood tests that picks up the specific malaria antibodies produced by the immune system [10]. These methods have a specific use, as they are limited to the measurement of past exposure to the disease. Methods based on parasite nucleic acid detection [11] have shown great sensitivity and specificity, but require significant infrastructure and training, and are more expensive than the blood smear method [12]. Methods based on the use of antibodies to recognise parasite components or biomarkers have also emerged in recent years [13]. Plasmodium falciparum histidine-rich protein 2 (Pf HRP 2) is a 35 kDa protein comprising unique tandem repeats (Ala-His-His-Ala-Ala-Asp), and is present in the serum of a malaria-infected patient as a parasite antigen [14,15]. Pf HRP 2 is also present in food vacuole [16], digestive vacuole [17], and the membrane surface of the infected red blood cells [18]. Pf HRP 2 is produced in large amounts by the most lethal of malaria parasites, and is specific to Plasmodium falciparum. Other malaria biomarkers, such as parasite lactate dehydrogenase (pLDH), and/or parasite aldolase, are common to all Plasmodium species [19]. In addition, Pf HRP2 has been proven to be useful in detecting the presence of parasites in cases of placental malaria [20]. The significance of Pf HRP 2 has led to a lateral flow dipstick test [21,22], enzyme-linked immunosorbent assay (ELISA) tests [4], and Western blotting [23] for the clinical diagnosis of malaria in support of microscopy. The drawbacks of these techniques are that they are either of low sensitivity, which could lead to inappropriately withholding treatment from patients with malaria [19], or are as time consuming as the lab-based methods. Recent literature has reported the development of different sensors for malaria based on biomarker and antibody detection [24,25]. Therefore, in this work, we investigated the development of a rapid and highly sensitive sensor based on a screen-printed device, which would enable its use in low-resource countries. The method selected was based on chronoamperometry, which is well known for its high sensitivity [26] and ability to amplify a signal using nanotechnology. The use of biomarker detection related to parasite infection was also implemented in this work through the selection of Pf HRP 2. The biosensor was then optimised to achieve a sensitive outcome and a capacity to work in resource-limited settings, and can be combined with other biomarkers for malaria infection detection. 2. Materials and Methods 2.1. Materials Plasmodium falciparum histidine-rich protein 2 recombinant protein (PIP001), sandwich pair HuCAL capture monoclonal antibody (HCA 160, IgG1, clone 14971), and detection (HCA 159, IgG1, clone 14964) monoclonal antibody conjugated to horseradish peroxidase (HRP) were purchased from AbDSerotec (UK). Phosphate buffered saline tablets (PBS, pH 7.4), PBST (0.05 v/v Tween-20), Tween-20, microtitre plates, and MaxiSorp (Nunc Immuno), were purchased from Thermo Fischer Scientific (Hertfordshire, UK). Bovine serum albumin (BSA), phosphate citrate buffer tablets, sodium hydroxide, potassium chloride (KCl), sodium carbonate, sodium bicarbonate, 3, 30 , 5, 50 -tetramethyl benzidine hydrochloride hydrate (TMB) (powder), colloidal gold, hydrogen peroxide, 95% ethanol, potassium ferricyanide [K3 Fe(CN)6 ], and human serum were purchased from Sigma-Aldrich (Dorset, UK). Milk concentrate blocking solution was purchased from KPL (Gaithersburg, MD, USA). Double-distilled ultrapure water produced by a Millipore Direct-Q® 3 UV (Millipore; Molsheim, France) was used for the analysis. All of the chemicals and solvents were of analytical or HPLC grade, and were used without further purification.
Biosensors 2017, 7, 28
3 of 14
2.2. Sensors Fabrication and Electrochemical Measurements Screen-printed gold electrodes (SPGE), consisting of a gold working electrode, a carbon counter and a silver–silver chloride pseudo-reference electrode were fabricated using a procedure similar to that described by Noh and Tothill [27], and printed using the facilities at DuPont with inks provided by the company (DuPont Microcircuit Materials, Bristol, UK). Three electrode batches, JD1, JD2a, and JD2b, were tested. The printing pastes used for JD1 were BQ221 carbon, BQ331 gold, 5880 Ag/AgCl, and 5036 blue encapsulant (DuPont Ltd. Bristol, UK), produced in 2010. JD2a and JD2b were different from JD1 in that the carbon ink used was BQ226, but all other inks used were the same as JD1. The JD2a sensors were from a batch produced in 2013, while the JD2b sensors were freshly produced (2015). The gold working electrode had a 5 mm diameter, giving a 19.6 mm2 planar area, and was printed on a graphite ink layer (dried at 120 ◦ C, 30 min). The electrochemical procedures were conducted using a computer-controlled four channel Autolab electrochemical analyser multipotentiostat (Metrohm, The Netherlands) throughout, which allows the simultaneous detection of four sensors. Data capture was through the supplied GPES version 4.9) software installed onto a personal computer (PC). The sensor edge connectors were from PalmSens (Provided by Alvatek, Gloucestershire, UK). The electrodes were characterised using cyclic voltammetry (CV) and chronoamprometry. The CV scans were conducted by using a 100 µL drop of potassium ferricyanide (K4 Fe(CN)6 3H2 O) at 0.1, 0.5, and 1 mM in 0.1 M KCl, placed onto the electrode’s surface. Three scans were taken at varying scan rates (10, 20, 50, 70, and 100 mV·s−1 ) relative to the on board Ag/AgCl reference electrodes. The active area of the working electrode was calculated [28] using the Randles–Sevcik equation [29]. For sample analysis, each of the measurements was carried out in triplicate using a new strip in a non-deaerated and unstirred solution. For the selection of the optimal constant potential for the enzymatic reaction (TMB-H2 O2 -HRP), choroamperometry was conducted using a bare screen-printed gold electrode with buffer solution (50 mM phosphate citrate buffer, pH 5.0, in 0.1 M KCl) and a substrate (4 mM TMB, 0.06% H2 O2 ) with an antibody-HRP conjugate. Step amperometry was conducted at a range of potentials from +600 mV to −400 mV within 600 s for the TMB-H2 O2 -HRP system, in order to achieve the best signal-to-noise ratio. Data plotted from the steady state current was used to obtain the concentration of the analyte. Following the measurements, the data were copied to Microsoft Excel for representation. 2.3. SEM and AFM Scan of the SPGE Scanning electron microscope (SEM) (Phillips, Guildford, UK) was used to visualise the surface structure of the gold working electrode at 50× and 3500× magnification. An electron emission spectrum was also obtained by using the Environmental Scanning Electron Microscope (ESEM) to determine the composition of the SPGE. Atomic force microscopy (AFM) (Digital instruments, Boston, MA, USA) was used to obtain the sensor’s surface topography at 25 and 50 mu magnification. 2.4. Immunoassay Development (ELISA) ELISA tests were first developed using micro well polystyrene plates, MaxiSorp (Nunc Immuno). A direct assay was first developed by adapting the standard ELISA AbDSerotec protocol (Abdserotec.com). Following optimisation, Pf HRP 2 recombinant protein (PIP001) was serially diluted in sodium bicarbonate buffer (pH 9.6) to yield concentrations of 0.01, 0.1, 0.5, 1.0, 5.0, 10, and 100 µg·mL−1 , then 100 µL of the antigen solution was added in triplicate to the plate and incubated at 4 ◦ C overnight. The control wells contained no antigen. The plate was aspirated and washed three times using 200 µL 0.01 M PBS Tween-20 (0.05 v/v). A 200 µL of 1% BSA was then used to block the plate by incubating at 37 ◦ C for 2 h in a Labsystems iEMS Incubator/shaker (Bradenton, FL, USA). The wash steps were repeated. A detection antibody conjugated with horseradish peroxidase (HCA 159, 10 µg·mL−1 ) was added to the wells, and incubated at 37 ◦ C for 2 h. The plate was washed
Biosensors 2017, 7, 28
4 of 14
three times in PBS Tween-20 (0.05 v/v). A 100 µL solution of 3, 30 , 5, 50 Tetramethylbenzidine/H2 O2 was added to the reaction wells, and incubated at room temperature for 15 min in the dark. The reaction was stopped using 50 µL of 1 M H2 SO4 , and read at 450 nm on a Varioskan plate reader (Thermo Fischer Scientific (Hertfordshire, UK). A Sandwich ELISA assay was then developed, where 100 µL of Pf HRP 2 capture antibody (HCA 160) was dissolved in 900 µL of 0.1 M sodium bicarbonate buffer (pH 9.6) to give a concentration of 50 µg·mL−1 . Twenty microliters (20 µL) of this solution were deposited in a microtiter plate and incubated overnight at 4 ◦ C. The plate was then washed three times using 200 µL of 0.1 M PBS Tween-20 (0.05 v/v). Two hundred microliters (200 µL) of 1% BSA was then added to block the plates by incubating at 37 ◦ C for 2 h. The plate was then washed and 100 µL of serial dilution of the Pf HRP 2 antigen was added to the plate as a 0.01, 0.5, 0.1, 1.0, 10, 50, and 100 µg·mL−1 antigen diluted in PBS (0.01 M). The control wells contained no antigen. The plate was then incubated at 37 ◦ C for 2 h. The plate was washed three times in PBS Tween-20 (0.05 v/v). Two hundred microliters (200 µL) of Pf HRP 2 detection antibody-HRP (HCA 159) were dissolved in 800 µL of PBST-20 (0.05 v/v) to give a concentration of 20 µg·mL−1 , and incubated at 37 ◦ C for 2 h. The plate was washed three times using 200 µL of 0.01 M PBS Tween-20, (0.05 v/v). One hundred microliters (100 µL) of 3, 30 , 5, 50 Tetramethylbenzidine were added to the reaction wells, and incubated at room temperature for 15 min in the dark. The reaction was stopped using 50 µL of 1 M H2 SO4 and read at a 450 nm wavelength. The standard curve and linear regression with the limit of detection were obtained in Microsoft Excel. The limit of detection (LOD) was calculated as 3 times the SD of the blank measurement plus the average blank measurement. 2.5. Optimisation of Capture and Detection Antibody on the Sensor’s Surface A 20 µL capture antibody in concentrations of 10, 20, and 30 µg·mL−1 in sodium bicarbonate buffer (0.1 M, pH 9.6) was immobilised by physical adsorption on the gold working electrodes (overnight at 4 ◦ C) in humid conditions. Prior to the immobilisation of the antibodies, the sensors were cured at 120 ◦ C and washed using distilled water. After the immobilisation, the sensors were washed twice using PBST and dried in a gentle flow of nitrogen. The electrode surface was blocked using 100 µL of 1:10 milk in PBS (0.01 M) to reduce non-specific binding and incubated for 1 h at 37 ◦ C. After each incubation step, the surface was washed gently with 100 µL PBST. After washing, 30 µg·mL−1 of Pf HRP 2 antigen prepared in 20 µL of PBS was dropped onto the working electrode and incubated for 1 h at 37 ◦ C. The surface was washed with PBST again. The detection antibody HCA 159P was diluted to a working strength of 30 µg·mL−1 in 1:40 milk concentrate and incubated on the sensor for 1 h. The sensors were then washed and assayed by using a volume of 100 µL of the TMB-H2 O2 substrate, dropped on the sensor surface covering all three electrodes. The current was then measured using the potentiostat. The detection antibody concentration was optimised by repeating the above procedure using the best concentration of capture antibody obtained in the above experiment (20 µL Pf HRP 2 capture antibody, 20 µg·mL−1 ) in sodium bicarbonate buffer (0.1 M, pH 9.6). The capture antibody was immobilised, and the sensor washed and blocked as above. A 30 µg·mL−1 Pf HRP 2 antigen was prepared in 1:10 milk PBS, and 10 µL was dropped onto the working electrode. The detection antibody was used at different concentrations of 10, 20, and 30 µg·mL−1 in 1:40 milk PBS. The experiment was repeated as above. 2.6. Standard Curve and Limit of Detection The Pf HRP 2 antigen was assayed using 20 µL of capture antibody with a concentration of 20 µg·mL−1 in sodium bicarbonate buffer (0.1 M, pH 9.6) immobilised on the gold working electrode and incubated overnight at 4 ºC. Concentrations of 0, 2, 16, 20, 40, 64, 80, and 100 ng·mL−1 of Pf HRP 2 antigen were prepared in 1:10 milk PBS (0.01 M), and 20 µL of the antigen solution was dropped onto the working electrode. The detection antibody-HRP was diluted to a working strength of 20 µg·mL−1
Biosensors 2017, 7, 28
5 of 14
in 1:40 milk PBS. The lowest detection limit of the antigen was determined by 3 times the standard deviation of the blank value plus the average of the blank measurement, and the data were presented using Microsoft Excel. Biosensors 2017, 7, 28
5 of 14
2.7. Signal Amplification Using Gold Nanoparticle 2.7. Signal Amplification Using Gold Nanoparticle Colloidal gold (40 nm) was employed for its large surface area in an attempt to amplify the Colloidal gold (40 nm) was employed for its large surface area in an attempt to amplify the sensor’s signal and lower the detection limit of the target protein. The commercial colloidal gold sensor’s signal and lower the detection limit of the target protein. The commercial colloidal gold nanoparticles were investigated using different concentrations of blocking buffer for the optimisation nanoparticles were investigated using different concentrations of blocking buffer for the optimisation of the Au nanoparticles’ (AuNP) conjugation to the reporter protein. A 1000 µL quantity of gold colloid of the Au nanoparticles’ (AuNP) conjugation to the reporter protein. A 1000 µL quantity of gold was taken in a 1.5 mL tube, and 0.1 µL of 0.2 M NaOH was added, adjusting the pH to 9.0 [30]. A 100 µL colloid was taken in a 1.5−mL tube, and 0.1 µl of 0.2 M NaOH was added, adjusting the pH to 9.0 [30]. 1 detection antibody (HCA 159P) was added, and the mixture was shaken volume 0.1 mg A 100of µLneat volume of·mL neat 0.1 mg·mL−1 detection antibody (HCA 159P) was added, and the mixture at was roomshaken temperature for 1 h. The buffer dilutions ofdilutions 1:5, 1:10,of 1:20, and at room temperatureblocking for 1 h. The blocking buffer 1:5,and 1:10,1:50 1:20,BSA andand 1:501:5 BSA 1:10 milk in PBS were examined as the blocker after the antibodies’ attachment to the nanoparticles. and 1:5 and 1:10 milk in PBS were examined as the blocker after the antibodies’ attachment to the The tube was then shaken at room temperature fortemperature 1 h in the dark at 10,000 rpmat for 10 min nanoparticles. The tube was then shaken at room for 1and h inspun the dark and spun 10,000 ◦ (4 rpm C). The supernatant discarded and pellet re-suspended 70 µL PBS (0.01 obtain for 10 min (4 °C). was The supernatant wasthe discarded and the pelletinre-suspended in 70M) µLtoPBS (0.01the stock AuNP—conjugated to the detection to antibody—HRP, which was stored at was 4 ◦ C.stored The stock was M) to obtain the stock AuNP—conjugated the detection antibody—HRP, which at 4 °C. diluted 1:5 and to produce amplified signal. Another batch nanoparticles was also prepared The stock was1:10 diluted 1:5 andthe 1:10 to produce the amplified signal.ofAnother batch of nanoparticles also prepared a way similar tobut thebyabove procedure, but by adding extra enzyme horseradish in was a way similar to theinabove procedure, adding extra horseradish peroxidase (HRP) 1 ) were peroxidase enzyme (HRP) after the antibody-HRP attachment. (3−µL) of HRP (20 to after the antibody-HRP attachment. Three microliters (3 µL) ofThree HRPmicroliters (20 mg·mL added −1) were added to the AuNP antibody-HRP solution and incubated for 1 h at room temperature mg·mL the AuNP antibody-HRP solution and incubated for 1 h at room temperature in a shaker. The tube in then a shaker. was then at 10,000 rpm forthe 10 supernatant min (4 °C) and the supernatant discarded. was spunThe at tube 10,000 rpm forspun 10 min (4 ◦ C) and discarded. The sediment was The sediment re-suspended in 1and mL the distilled water continued and the procedure used above. re-suspended inwas 1 mL distilled water procedure as used continued above. Theasprinciple of the The principle of the can developed sensor candeveloped be seen in sensor Scheme 1. be seen in Scheme 1.
Scheme 1. Principle of the developed sensor for malaria detection. Scheme 1. Principle of the developed sensor for malaria detection.
2.8.2.8. Human Serum Human SerumAssay Assay InIn order tototest commerciallyavailable availablehuman humanserum serum sample was order testthe thesensor sensorfor formatrix matrix effect, effect, a a commercially sample was used and spiked with different concentrations of the biomarker. Tests were then conducted using 100% used and spiked with different concentrations of the biomarker. Tests were then conducted using human following the same as thatasreported in Sections 2.6 and 2.7. 2.7. 100% serum humansamples serum samples following theprocedure same procedure that reported in Sections 2.6 and 3. 3. Results and Results andDiscussion Discussion 3.1.3.1. Characterisation Characterisationofofthe theScreen-Printed Screen-Printed Electrodes Electrodes In order to make a comparison of the 3 electrodes (JD1, JD2a, and JD2b), electrochemical In order to make a comparison of the 3 electrodes (JD1, JD2a, and JD2b), electrochemical characterisation was conducted using cyclic voltammetry. This was to investigate the performance characterisation was conducted using cyclic voltammetry. This was to investigate the performance of of the new carbon ink used in the JD2 electrodes, and also to study the effect of the production year the new carbon ink used in the JD2 electrodes, and also to study the effect of the production year on the performance of the sensors. All of the electrodes were stored at room temperature in dark conditions. The experiments were carried out in the presence of potassium ferricyanide, in different concentrations (0.1, 0.5 and 1 mM) and at different scan rates (10, 20, 50, 70 and 100 mV·s−1) relative
Biosensors 2017, 7, 28
6 of 14
on the performance of the sensors. All of the electrodes were stored at room temperature in dark conditions. The experiments were carried out in the presence of potassium ferricyanide, in different concentrations (0.1, 0.5 and 1 mM) and at different scan rates (10, 20, 50, 70 and 100 mV·s−16)ofrelative Biosensors 2017, 7, 28 14 to the on board Ag/AgCl reference electrodes. The cathodic and anodic peak current was used to to the onactive boardsurface Ag/AgClarea reference andthe anodic peak current equation was used [28,29]. to calculate the of theelectrodes. electrodesThe by cathodic employing Randle–Sevcik calculate the active surface area of the electrodes by employing the Randle–Sevcik equation [28,29]. The ideal ∆E value for a reversible redox reaction of potassium ferricyanide is 56 to 59 mV, and the The ideal the ΔE cathodic value for aand reversible reaction of potassium ferricyanide 56 difference to 59 mV, and the ratio between anodic redox peak is 1 [31,32]. In practice, however,isthe is typically ratio between the cathodic and anodic peak is 1 [31,32]. In practice, however, the difference is 100 mV and higher [32]. The use of 1 mM potassium ferricyanide resulted in the best reproducibility of typically 100 mV and higher [32]. The use of 1 mM potassium ferricyanide resulted in the best the redox reaction (Data not shown). Figure 1 shows the characterisation of the different sensors using reproducibility of the redox reaction (Data not shown). Figure 1 shows the characterisation of the CV with 1 mM potassium ferricyanide. different sensors using CV with 1 mM potassium ferricyanide.
Figure 1. Cyclic voltammogramofofthe thedifferent different electrodes electrodes atatdifferent scan rates using a 1 mM Figure 1. Cyclic voltammogram different scan rates using a 1 mM potassium ferricyanide solution in 0.1 M KCl, n = 3. potassium ferricyanide solution in 0.1 M KCl, n = 3.
Biosensors 2017, 7, 28 Biosensors 2017, 7, 28
7 of 14 7 of 14
The that even though JD1 was in 2010,init performed well whenwell compared The results resultsshowed showed that even though JD1 produced was produced 2010, it performed when to the JD2 electrodes. It was alsoItnoted thatnoted the active surface area of thearea goldofworking compared to the JD2 electrodes. was also that the active surface the goldelectrode working (A higher in the JD2 electrodes information, Table S1). electrode (Athe activeJD1 %)was in ~10% the JD1 wasthan ~10% higher than in (Supplementary the JD2 electrodes (Supplementary active %) in This could be Table due to S1). physical/chemical place in the inks/polymer as the electrodes information, This could bechanges due totaking physical/chemical changes taking place in the become older. as Compared to the JD2 electrodes, JD1 sufferedtofrom lower reproducibility. The change inks/polymer the electrodes become older. Compared the JD2 electrodes, JD1 suffered from in the base carbon ink showed no effect sensor’s performance. lower reproducibility. The change in on thethe base carbon ink showedBoth no JD2a effectand onJD2b the showed sensor’s comparative further continued usingdata, the JD2b In order tocontinued study the performance.data, Bothand JD2a and experiments JD2b showed comparative and electrodes. further experiments optimal for the detection system, current signals generated from TMB/H the using thepotential JD2b electrodes. In order to study the optimal potential for the detection system, current 2 Othe 2 with HRP-antibody conjugate analysed using The ratio of theanalysed signal current signals generated from were TMB/H 2O2 with thechronoamperometry. HRP-antibody conjugate were using to the background current (−400 mV to +600 mV) of 4 mM TMBusing and 0.06% chronoamperometry. Theusing ratiostep of amperometry the signal current to the background current step amperometry (−400 mV to mV) of mM TMB and 0.06% H2O2 with without the addition of H without the+600 addition of4the detection antibody-HRP in a and pH 5.0 citrate buffer, 0.1 M 2 O2 with and the detection antibody-HRP in a pH 5.0 citrate buffer, KCl, was calculated. results showed KCl, was calculated. The results showed that the best0.1M potential in this system isThe −0.2 V using JD2 that the best potential in this this was system is −0.2for V future using immunosensor JD2 electrodes, developments and therefore this was selected electrodes, and therefore selected (Supplementary for future immunosensor information, Figure S1). developments (Supplementary information, Figure S1). 3.2. 3.2. SEM, SEM, ESEM ESEM and and AFM AFM of of Bare Bare SPGE SPGE The The working working electrode electrode of of the the screen-printed screen-printed gold gold sensor sensor was was characterised characterised using using scanning scanning electron scanning electron microscopy (ESEM), which show the electron microscopy microscopy(SEM) (SEM)and andenvironmental environmental scanning electron microscopy (ESEM), which show composition of the gold electrode’s surface (Figure 2). The SEM scans showed pinholes in the surface the composition of the gold electrode’s surface (Figure 2). The SEM scans showed pinholes in the structure, which were formed as a result the printing process with awith rough granular surface. The surface structure, which were formed as aof result of the printing process a rough granular surface. ESEM analysis (Figure 2C) gives a small figure insert with the average of three spectra’s data and The ESEM analysis (Figure 2C) gives a small figure insert with the average of three spectra’s data and indicates indicates aa high high percentage percentage of of the the gold gold ink ink (~89.2%) (~89.2%) used used to to produce produce the the sensors sensors with with carbon carbon (~9.11) (~9.11) and and oxygen oxygen (~1.69). (~1.69).
Figure ×, (B) ×, (C) (C) ESEM ESEM surface surface analysis analysis of of JD2b. JD2b. Figure2.2.SEM SEMof ofaaJD2b JD2bbare bareelectrode, electrode,(A) (A)atat500 500×, (B) at at 3500 3500×,
Biosensors 2017, 7, 28 Biosensors 2017, 7, 28
8 of 14 8 of 14
Thesurface surfaceroughness roughness of the electrode was visualised force microscopy The of the goldgold electrode was visualised using using atomicatomic force microscopy (AFM) 50 3). muThis (Figure shows the screen-printed gold working electrode’s at(AFM) 25 andat 50 25 mu and (Figure shows3). theThis screen-printed gold working electrode’s topography, similar topography, similar to the SEM scans. to the SEM scans.
Figure Figure3.3.Three-dimensional Three-dimensional(3D) (3D)surface surfacetopography topographyof ofaabare barescreen-printed screen-printedgold goldelectrode electrode(SPGE) (SPGE) using AFM at (A) 25 mu and (B) 50 mu. using AFM at (A) 25 mu and (B) 50 mu.
3.3. 3.3.Development Developmentofofthe theImmunoassay Immunoassay First, HRP 2 assay was developed using the the microtiter plateplate by a direct and a and sandwich assay First,the thePfPfHRP 2 assay was developed using microtiter by a direct a sandwich format in orderintoorder investigate the suitability of the reagents for the detection of Pf HRPof2,PfHRP before 2, moving assay format to investigate the suitability of the reagents for the detection before the assaythe to assay the sensor’s surface.surface. The direct assay assay was conducted by immobilising the antigen by moving to the sensor’s The direct was conducted by immobilising the antigen physical adsorption to the and detecting it using the detection antibody-enzyme conjugate. The by physical adsorption toplate, the plate, and detecting it using the detection antibody-enzyme conjugate. sandwich assayassay used the capture antibody immobilised on the plate and theand antigen was added The sandwich used the capture antibody immobilised on thesurface, plate surface, the antigen was inadded solution using different concentrations. The detection antibody-enzyme was then added to complete in solution using different concentrations. The detection antibody-enzyme was then added to the assay. The resultsThe for both assays are shown Supplementary InformationInformation Figures S2 and S3. complete the assay. results for both assays in arethe shown in the Supplementary Figure − 1 − 1 −1 −1 The LOD was calculated as 0.56 ·mL for ELISA anddirect 0.89 µg ·mL and for0.89 theµg·mL sandwich S2 and Figure S3. The LOD was µg calculated as the 0.56direct µg·mL for the ELISA for ELISA. The results reveal thereveal HuCAL pairsandwich recognises and interacts and withinteracts the malaria the sandwich ELISA. The that results thatsandwich the HuCAL pair recognises with protein, and can be used in the immunosensor. development of the the malaria protein, and can development be used in of theandevelopment of No an further immunosensor. No further assay or optimisation was conducted on thewas ELISA assay, since theELISA aim ofassay, the work was focus development of the assay or optimisation conducted on the since thetoaim of on the the sensor’s work was todevelopment. focus on the sensor’s development. 3.4. 3.4.Development DevelopmentofofPfHRP PfHRP22Immunosensor Immunosensor Capture Captureantibody antibodyoptimisation optimisationwas wasconducted conductedusing usingaasandwich sandwichELISA ELISAformat. format.Concentrations Concentrations −1 were added to the sensor’s surface (20 µL in sodium bicarbonate buffer, of 10, 20, and 30 µg · mL −1 of 10, 20, and 30 µg·mL were added to the sensor’s surface (20 µL in sodium bicarbonate buffer, 0.1 0.1 9.6) attach thesensor sensorusing usingphysical physicaladsorption adsorption (overnight (overnight at at 44 ◦°C). C). The M,M, pHpH 9.6) toto attach totothe The electrodes electrodeswere were ◦ then blocked using 100 µL, 1:10 milk in PBS (0.01 M) for 1 h at 37 C, and then washed gently using then blocked using 100 µL, 1:10 milk in PBS (0.01 M) for 1 h at 37 °C, and then washed gently using PBST HRP 22antigen ·mL−1−1)) PBSTbuffer. buffer.The ThePfPfHRP antigenwas wasthen thendropped droppedonto ontothe thesensor’s sensor’ssurface surface(20 (20µL, µL,3030µgµg·mL ◦ and ·mL−1−1)) andincubated incubatedfor for11hh(37 (37 C), °C),washed, washed,and andthen thenthe thedetection detectionantibody-enzyme antibody-enzyme(20 (20µL, µL,3030µgµg·mL ◦ was 2O 22 wasadded addedand andincubated incubated(1(1h,h,37 37 C). °C).The Theassay assaywas wasthen thenfollowed followedby byadding addingthe theTMB-H TMB-H 2O substrate, and the signal was recorded using a − 200 mV potential. TMB-H O was chosen as the substrate, and the signal was recorded using a −200 mV potential. TMB-H22O22 was chosen as the enzyme enzymesubstrate substratefor forthe theenzyme enzymelabel labelhorseradish horseradishperoxidase peroxidase(HRP)’s (HRP)’s activity activity determination determination [33]. [33]. Furthermore, TMB has superior detection properties than other systems [34–36]. Figure 4A shows that Furthermore, TMB has superior detection properties than other systems [34–36]. Figure 4A shows −1 for the−1capture antibody. The response increased the was found be 20 to µgbe ·mL20 thatbest theconcentration best concentration was to found µg·mL for the capture antibody. The response −1 linearly against antibody concentration up to about theto20about µg·mL level, and level, after this increased linearly against antibody concentration up the 20concentration µg·mL−1 concentration and -1 point the response was lower, which indicates the saturation of the sensor’s surface. A 20 µg·mL after this point the response was lower, which indicates the saturation of the sensor’s surface. A 20 concentration of anti Pfof HRP antibody was chosen the optimum concentration for the capture µg·mL-1 concentration anti2 PfHRP 2 antibody wasaschosen as the optimum concentration for the antibody, since it was the best compromise between the response and the cost of the antibody. capture antibody, since it was the best compromise between the response and the cost of the antibody. The µgµg·mL ·mL−1−1capture Thedetection detectionantibody antibodyconcentration concentrationwas wasthen thenoptimised optimisedusing using2020 captureantibody antibody immobilised immobilisedon onthe thesensor’s sensor’ssurface. surface. The The detection detection antibody-enzyme antibody-enzyme conjugate conjugate was was tested tested at at 10, 10, 20, 20, − 1 in 1:40 milk PBS and 30 µg·mL −1 antigen. The procedure followed was similar to and 30 µg · mL −1 −1 and 30 µg·mL in 1:40 milk PBS and 30 µg·mL antigen. The procedure followed was similar to that −1 that listed above. results shown in Figure with highest signal recorded at 20 µg·mL −1 also listed above. TheThe results are are shown in Figure 4B, 4B, with thethe highest signal recorded at 20 µg·mL also for detection the detection antibody-HRP concentration. for the antibody-HRP concentration.
Biosensors 2017, 7, 28
9 of 14
Biosensors2017, 2017,7,7,28 28 Biosensors
of14 14 99of
The HRP 2. Theimmunosensor immunosensorwas wasthen thendeveloped developedfor forthe thedetection detectionand andquantification quantificationof ofPf PfHRP The The immunosensor was then developed for the detection and quantification of PfHRP 2.2.The The −1 ) and detection antibody (20 µg·mL−1 ) concentrations were used with optimal capture (20 µg · mL optimalcapture capture(20 (20µg·mL µg·mL−1−1))and anddetection detectionantibody antibody(20 (20µg·mL µg·mL−1−1))concentrations concentrationswere wereused usedwith withthe the optimal the JD2 electrodes to conduct a calibration curve. Different Pf HRP 2 antigen concentrations (0, 2, 16, JD2electrodes electrodesto toconduct conductaacalibration calibrationcurve. curve.Different DifferentPfHRP PfHRP22antigen antigenconcentrations concentrations(0, (0,2,2,16, 16,20, 20, JD2 −1 ) prepared in 1:10 milk/PBS (0.01M) as dilution buffer, and then a set of 20, and 100 ng·mL −1) prepared −1 64,64, 80,80, and 100 ng·mL in 1:10 1:10 milk/PBS milk/PBS (0.01M) (0.01M) as as dilution dilution buffer, buffer, and and then then aa set set of of 64, 80, and 100 ng·mL ) prepared in experiments spiked 100% commercial human serum samples. The assay was runrun in experimentswas wasconducted conductedinin in spiked 100% commercial human serum samples. The assay was run experiments was conducted spiked 100% commercial human serum samples. The assay was triplicate forfor allall of the measurements. The blank contained no antigen for intriplicate triplicate for allof ofthe the measurements. The blank contained no antigen forthe thebuffer bufferand andthe theserum serum in measurements. The blank contained no antigen for the buffer and the serum experiments. The results of both assays are shown in Figure 5. The results agree with the range experiments.The Theresults resultsof ofboth bothassays assaysare areshown shownin inFigure Figure5.5.The Theresults resultsagree agreewith withthe therange rangeused used experiments. used by [37] for the detection of PfHRP 2. The effect of tandem repeats in the structure of the protein make by [37] for the detection of PfHRP 2. The effect of tandem repeats in the structure of the protein make by [37] for the detection of PfHRP 2. The effect of tandem repeats in the structure of the protein make the theantigen antigeneasy easyto todetect; detect;however, however,the theconcentration concentrationof ofthe theanalyte analyteisisisinfluenced influencedby bythe thematrix. matrix. the antigen easy to detect; however, the concentration of the analyte influenced by the matrix.
Figure4.44 Chronoamperometric Chronoamperometric response response of of(A) (A)different differentconcentrations concentrationsof ofcapture captureantibody antibodyon onthe the Figure capture antibody on the Figure Chronoamperometric response sensor’ssurface surfacein inaaasandwich sandwichassay assayformat; format,(B) (B)different differentconcentrations concentrationsof ofdetection-horseradish detection-horseradish sensor’s surface in sandwich assay format, (B) different concentrations of detection-horseradish sensor’s peroxidase(HRP) (HRP)antibody antibodyin inaaasandwich sandwichassay assayformat, format,nnn===3. peroxidase (HRP) antibody in sandwich assay format, 3.3. peroxidase
Figure regression analysis of the chronoamperometric response of Pf HRP 2 detection in buffer Figure5.5.5.Linear Linear regression analysis of the the chronoamperometric chronoamperometric response of PfHRP PfHRP detection in Figure Linear regression analysis of response of 22 detection in −1 Pf HRP −1 PfHRP (PBS, 0.01M, pH 7.4, spiked with 1–100 ng · mL 2) (A) and 100% serum samples (spiked with −1 buffer (PBS, 0.01M, pH 7.4, spiked with 1–100 ng·mL 2) (A) and 100% serum samples (spiked buffer (PBS, 0.01M, pH 7.4, spiked with 1–100 ng·mL PfHRP 2) (A) and 100% serum samples (spiked 1 Pf HRP 1–100 ·mL− 2) (B) on JD2on sensor. Measurements were conducted −0.2 V. Correlation −1−1 PfHRP with ng 1–100 ng·mL PfHRP 2) a(B) (B) on JD2 sensor. Measurements Measurements were at conducted at −0.2 −0.2 V. V. with 1–100 ng·mL 2) aa JD2 sensor. were conducted at 2 value of 0.9827 for the buffer matrix and 0.98 for the serum matrix (n = 3). coefficient and R 2 valueof of0.9827 0.9827for forthe thebuffer buffermatrix matrixand and0.98 0.98for forthe theserum serummatrix matrix(n (n== Correlationcoefficient coefficientand andRR2 value Correlation
3). 3).
From the data shown in Figure 5A, the limit of detection (LOD) for the buffer samples was Fromas the data shown in Figure 5A,spiked the limit limit of detection detection (LOD) for for the buffer buffer samples was From the data Figure 5A, the of (LOD) the samples was calculated 2.14 ngshown ·mL−1 ,in and for the human serum samples (Figure 5B) the LOD was −1, and for the spiked human serum samples (Figure 5B) the LOD was 2.95 −1 − 1 calculated as.2.14 2.14 ng·mL calculated ng·mL , and for the humangive serum samples (Figure 5B) thebut LOD was 2.95 2.95 ng·mLas These results show thatspiked both assays a similar detection limit, with lower Theseresults results show that bothassays assays give similar detection limit, butwith with lower readings ng·mL−1−1. .achieved These show that both aasimilar detection but readings ng·mL readings for the serum samples. Thisgive is very encouraging andlimit, indicates that lower the sensors are achieved forthe the serum samples. Thisisisvery veryhuman encouraging andindicates indicates thatthe thesensors sensors areable ableto to achieved for serum samples. This encouraging are able to perform well using 100% commercial serum and samples. The that difference in matrix affects perform well using 100% commercial human serum samples. The difference in matrix affects the rate perform well using 100% commercial human serum samples. The difference in matrix affects the rate the rate of electron exchange, which occurs when the analyte is oxidized when a potential difference ofapplied. electronThe exchange, which occurs occurs when the analyte oxidized whenattaching potential difference of electron exchange, which analyte isis oxidized when aa potential isis is lower readings can be when due tothe small proteins in the samples to difference the sensor’s applied. The lower readings readings can be be due due to to small proteinsand in the the samples samples attaching attaching to the the sensor’s sensor’s applied. The lower can small proteins in to surface and affecting the electron transfer. The sensitivity reproducibility of the sensors in this surfaceand andaffecting affectingthe theelectron electrontransfer. transfer.The Thesensitivity sensitivityand andreproducibility reproducibilityof ofthe thesensors sensorsin inthis this surface assayare areshown shownto tobe beadequate adequatefor forthe thedetection detectionof of the themalaria malariabiomarker, biomarker,since sinceaablood bloodlevel levelof of~~ assay 9.45ng·mL ng·mL−1−1has hasbeen beenreported reportedto tobe bePlasmodium Plasmodiumsp. sp.specific specificand andmalaria malariapositive positive[38–40]. [38–40]. 9.45
Biosensors 2017, 7, 28
10 of 14
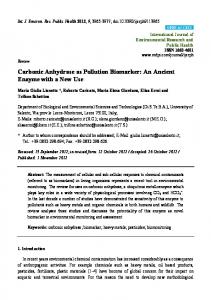
assay are shown Biosensors 2017, 7, 28 to be adequate for the detection of the malaria biomarker, since a blood level 10 of of 14 ~9.45 ng·mL−1 has been reported to be Plasmodium sp. specific and malaria positive [38–40]. investigate if we can can improve improve the the detection detection limit further, the the detection detection antibody-HRP antibody-HRP was To investigate nanoparticles (40 nm) nm) and and used used in in the the sandwich sandwich assay. assay. Several optimisation optimisation attached to gold nanoparticles thethe best results before a calibration curve was repeated with experiments were wereconducted conductedtotoachieve achieve best results before a calibration curve was repeated serialserial dilution of the in buffer first, and then with dilution of antigen the antigen in buffer first, and thenthe theexperiments experimentswere wererepeated repeated in in 100% are listed in in Section 2.7.2.7. Figure 6 shows the commercial human human serum serum samples. samples.The Thefull fullprocedures procedures are listed Section Figure 6 shows linear regression of the results achieved using the amplified assay with the gold nanoparticles the linear regression of the results achieved using the amplified assay with the nanoparticles thethe addition of free enzymes to attach to thetogold conjugated detection detectionantibody-HRP antibody-HRPalone, alone,without without addition of free enzymes to attach the nanoparticles. gold nanoparticles.
ofof thethe chronoamperometric response of PfHRP 2 detection in buffer (PBS, Figure 6. 6. Linear Linearregression regression chronoamperometric response of Pf HRP 2 detection in buffer −1 PfHRP −1 Pf HRP 2) (A) and 100 0.01M,0.01M, pH 7.4, withwith 0.05–0.5 ng·mL (PBS, pH spiked 7.4, spiked 0.05–0.5 ng·mL 2) (A) and 100%%spiked spiked serum serum samples −11PfHRP 2) (B) on JD2 sensors using (Commercial human human serum serum samples samples spiked spiked with with 0.05–0.5 0.05–0.5 ng ng·mL (Commercial ·mL− Pf HRP 2) (B) on JD2 sensors gold nanoparticles nanoparticles conjugated conjugatedto tothe thedetection detectionantibody-HRP. antibody-HRP. Measurements were conducted at0.2 −0.2 Measurements were conducted at − V. 2 2 V. Correlation coefficient value of 0.955 buffer matrix 0.9844 serum = 3). Correlation coefficient andand R R value of 0.955 forfor thethe buffer matrix andand 0.9844 forfor thethe serum (n =(n3). −1 From the the above above data, data, an an LOD LOD of of 36 36pg pg·mL with From ·mL−1 was was obtained obtained in in the the amplified amplified buffer buffer samples samples with 2 value of 0.955 (Figure 6A). An LOD of 40 pg·mL−1 was also obtained in the amplified 100% an R an R2 value of 0.955 (Figure 6A). An LOD of 40 pg·mL−1 was also obtained in the amplified 100% serum samples samples (Figure (Figure 6B). 6B). The The AuNP and limit serum AuNP results results gave gave excellent excellent sensitivity sensitivity and limit of of detection detection without without the use of additional free enzymes (horseradish peroxidase) to load the particles. best AuNP AuNP the use of additional free enzymes (horseradish peroxidase) to load the particles. The The best conjugate stock dilution used was 1:10 milk in PBS, and also blocking with milk proteins. The conjugate stock dilution used was 1:10 milk in PBS, and also blocking with milk proteins. The serum serum proteins in in the the samples samples in in this this assay assay also also showed showed aa similar in that that proteins similar trend trend to to the the non-amplified non-amplified assay, assay, in similar responses where achieved to the buffer samples. Table 1 shows some of the different biosensor similar responses where achieved to the buffer samples. Table 1 shows some of the different biosensor technology for detecting PfHRP PfHRP 2, 2, and and their their detection detection limits. limits. These limits technology for detecting These are are comparable comparable to to the the limits achieved using our sensor. Our work showed that a proof of concept sensor was developed and this achieved using our sensor. Our work showed that a proof of concept sensor was developed and this can achieve a much lower detection limit than is required for malaria’s positive detection in blood can achieve a much lower detection limit than is required for malaria’s positive detection in blood samples. Further work will be done to examine the sensor in patient serum samples to confirm the samples. Further work will be done to examine the sensor in patient serum samples to confirm the results achieved in this work. results achieved in this work.
Table 1. Different biosensor technology for detecting PfHRP 2, and their detection limits. Table 1. Different biosensor technology for detecting PfHRP 2, and their detection limits. Analyte Analyte
Assay principle Assay Principle
PfPfHRP HRP 22
SPR SPR
-
-
PfPfHRP HRP 22
Carbon CarbonSPE SPEmodified modifiedwith with MWCN and MWCN andAu/MWCN Au/MWCN
-
-
-
-
-
-
PfPfHRP HRP 22 PfPfHRP HRP 22
PfHRP 2 PfHRP 2
Carbon CarbonSPE SPEmodified modifiedwith with AuNPs/Al AuNPs/Al2 2O O33sol–gel sol–gel Graphite–epoxy Graphite–epoxycomposite composite magneto magnetoelectrodes electrodes Polydimethylsiloxane microfluidic chips Carbon nanofiber forest grown on glass microballons
Range Range
Detection limit References Detection Limit References −1 5.6 pg·mL 5.6 pg ·mL−1
8 ng −1 ·mL 8 ng·mL
-
−1
-
−1 0.36 ng −1 ·mL 0.36 ng·mL
[25] [25] [37] [37] [41] [41] [42] [42]
-
16 ng·mL−1
[43]
0.01–10 ng·mL−1
0.025 ng·mL−1
[44]
Biosensors 2017, 7, 28
11 of 14
Table 1. Cont. Analyte
Assay Principle
Range
Detection Limit
References
Pf HRP 2
Polydimethylsiloxane microfluidic chips
-
16 ng·mL−1
[43]
Pf HRP 2
Carbon nanofiber forest grown on glass microballons
0.01–10 ng·mL−1
0.025 ng·mL−1
[44]
Pf HRP 2
Mercaptopropylphosphonic acid functionalized copper doped zinc oxide nanofibers
10 ag·mL−1 – 10 µg·mL−1
6.8 ag·mL−1
[45]
Pf HRP 2
Low electrocatalytic indium tin oxide (ITO) on glass electrodes; APTES-glutaraldehyde modified
1 pg·mL−1 – 100 ng·mL−1
2.2 pg·mL−1
[46]
4. Conclusions An immunosensor has been successfully developed using a sandwich ELISA assay on JD2 gold screen-printed electrodes. Milk concentrate was used as the blocking protein, as it reduced non-specific binding on the electrode surface. With both malaria antigen and antibodies being very expensive, care had to be taken in designing the experiments to achieve optimised results. An ELISA test was first developed to check the affinity of both antibodies toward the antigen Pf HRP 2. An immunosensor was then developed and optimised with electrochemical measurements that produced a 2.14 ng·mL−1 detection limit for the buffer samples, which is better than the ELISA assay developed in this work. Spiked 100% serum samples also achieved a very good LOD of 2.95 ng·mL−1 . An amplified signal is also achievable using the sensor with AuNPs conjugated to the detection antibody-enzyme. Signal amplification using gold nanoparticles gave an LOD of 36 pg·mL−1 , while the serum assay gave an LOD of 40 pg·mL−1 . The developed immunosensor offers a highly sensitive, portable, and low cost method of detecting Plasmodium falciparum histidine-rich protein 2. Future experiments will look at real samples analysis using patient serum samples. Supplementary Materials: Figure S1: Optimum potential determination by step potential of TMB/H2 O2 system with antibody-HRP on JD2 electrodes. The results shown are after subtracting the signal with no enzyme, Figure S2: (A) Standard curve of absorbance versus antigen concentration in a direct ELISA assay, (B) linear regression with correlation coefficient and R2 value of 0.9612, limit of detection is 0.56 µg·mL−1 , Figure S3: (A) Standard curve of absorbance versus antigen concentration in a Sandwich ELISA assay, (B) linear regression with correlation coefficient and R2 value of 0.9755. Limit of detection is 0.89 µg·mL−1 , Table S1: Overview of cyclic voltammetric analyses of the three electrodes, JD1, JD2a and JD2b at 20 mV·s−1 , using 1 mM potassium ferricyanide solution in 0.1 M KCl, n = 5. Acknowledgments: The authors would like to express their thanks to DuPont Microcircuit Materials, UK, for the screen-printed electrodes. Author Contributions: Aver Hemben performed all the experimental work and wrote the draft of the paper; Jon Ashley assisted in the laboratory work; Ibtisam E. Tothill supervised and directed the research and finalized the paper. Conflicts of Interest: The authors declare no conflict of interest.
References 1. 2. 3.
Noppadon, T.; Chatnapa, D.; Polrat, W.; Srivicha, K. Malaria diagnosis: A brief review. Korean J. Parasitol. 2009, 47, 93–102. Malaria Fact Sheet. Available online: http://www.who.int/mediacentre/factsheets/fs094/en/ (accessed on 1 May 2017). Malaria Treatment. Available online: http://www.who.int/malaria/publications/treatment/en/ (accessed on 1 May 2017).
Biosensors 2017, 7, 28
4.
5.
6.
7.
8. 9.
10. 11.
12.
13.
14. 15. 16.
17. 18. 19.
20.
21.
22.
12 of 14
Kifude, C.M.; Rajasekariah, H.G.; Sullivan, D.J.; Stewart, V.A.; Angov, E.; Martin, S.K.; Diggs, C.L.; Waitumbi, J.N. Enzyme-linked immunosorbent assay for detection of Plasmodium falciparum histidine-rich protein 2 in blood, plasma, and serum. Clin. Vaccine Immunol. 2008, 15, 1012–1018. [CrossRef] [PubMed] Herrera, S.; Vallejo, A.F.; Quintero, J.P.; Arévalo-Herrera, M.; Cancino, M.; Ferro, S. Field evaluation of an automated RDT reader and data management device for Plasmodium falciparum/Plasmodium vivax malaria in endemic areas of Colombia. Malar. J. 2014, 13, 87. [CrossRef] [PubMed] Demirev, P.; Feldman, A.; Kongkasuriyachai, D.; Scholl, P.; Sullivan, D.; Kumar, N. Detection of malaria parasites in blood by laser desorption mass spectrometry. Anal. Chem. 2002, 74, 3262–3266. [CrossRef] [PubMed] Scholl, P.F.; Kongkasuriyachai, D.; Demirev, P.A.; Feldman, A.B.; Lin, J.S.; Sullivan, D.J., Jr.; Kumar, N. Rapid detection of malaria infection in vivo by laser desorption mass spectrometry. The Am. J. Trop. Med. Hyg. 2004, 71, 546–551. [PubMed] Diagnoses, C.G. Maiera Consultative Group on Diagnoses and Diagnostics. A Research Agenda for Malaria Eradication: Diagnoses and Diagnostics. PLoS. Med. 2011, 8, 1–31. Redd, S.; Kazembe, P.; Luby, S.; Nwanyanwu, O.; Hightower, A.; Ziba, C.; Wirima, J.; Chitsulo, L.; Franco, C.; Olivar, M. Clinical algorithm for treatment of Plasmodium falciparum malaria in children. Lancet 2006, 347, 223–227. [CrossRef] Corran, P.; Coleman, P.; Riley, E.; Drakeley, C. Serology: A robust indicator of malaria transmission intensity? Trends Parasitol. 2007, 23, 575–582. [CrossRef] [PubMed] Iglesias, N.; Subirats, M.; Trevisi, P.; Ramírez-Olivencia, G.; Castán, P.; Puente, S.; Toro, C. Performance of a new gelled nested PCR test for the diagnosis of imported malaria: Comparison with microscopy, rapid diagnostic test, and real-time PCR. Parasitol. Res. 2014, 113, 2587–2591. [CrossRef] [PubMed] Vekemans, J.; Marsh, K.; Greenwood, B.; Leach, A.; Kabore, W.; Soulanoudjingar, S.; Asante, K.P.; Ansong, D.; Evans, J.; Sacarlal, J.; et al. Assessment of severe malaria in a multicenter, phase III, RTS, S/AS01 malaria candidate vaccine trial: Case definition, standardization of data collection and patient care. Malar. J. 2011, 10, 221. [CrossRef] [PubMed] Merwyn, S.; Gopalan, N.; Singh, A.K.; Rai, G.P.; Agarwal, G.S. Monoclonal antibodies against recombinant histidine-rich protein 2 of Plasmodium falciparum and their use in malaria diagnosis. Hybridoma 2011, 30, 519–524. [CrossRef] [PubMed] Wellems, T.E.; Howard, R.J. Homologous genes encode two distinct histidine-rich proteins in a cloned isolate of Plasmodium falciparum. Proc. Natl. Acad. Sci. USA 1986, 83, 6065–6069. [CrossRef] Schneider, E.L.; Marletta, M.A. Heme binding to the histidine-rich protein II from Plasmodium falciparum. Biochemistry 2005, 25, 979–986. [CrossRef] [PubMed] Desakorn, V.; Dondorp, A.M.; Silamut, K.; Pongtavornipinyo, W.; Sahassananda, D.; Chotivanich, K.; Pitisuttithum, P.; Smithyman, A.; Day, N.P.; Day, N.P.; White, N.J. Stage-dependent production and release of histidine-rich protein 2 by Plasmodium falciparum. Trans. R. Soc. Trop. Med. Hyg. 2005, 99, 517–524. [CrossRef] [PubMed] Sullivan, D.J., Jr.; Gluzman, I.Y.; Goldberg, D.E. Plasmodium hemozin formation mediated by histidine-rich proteins. Science 1996, 271, 219–222. [CrossRef] [PubMed] Sullivan, D.J.; Gluzman, I.Y.; Russell, D.G.; Goldberg, D.E. On the molecular mechanism of chloroquine’s antimalarial action. Proc. Natl. Acad. Sci. USA 1996, 93, 11865–11870. [CrossRef] Rock, E.P.; Marsh, K.; Saul, A.J.; Wellems, T.E.; Taylor, D.W.; Maloy, W.L.; Howard, R.J. Comparative analysis of the Plasmodium falciparum histidine-rich proteins HRP-I, HRP-II and HRP-III in malaria parasites of diverse origin. Parasitology 1987, 95, 209–227. [CrossRef] [PubMed] Hawkes, M.; Conroy, A.L.; Opoka, R.O.; Namasopo, S.; Liles, W.C.; John, C.C.; Kain, K.C. Use of a three-band HRP2/pLDH combination rapid diagnostic test increases diagnostic specificity for falciparum malaria in Ugandan children. Malar. J. 2014, 2875, 13–43. [CrossRef] [PubMed] Leke, R.F.; Djokam, R.R.; Mbu, R.; Leke, R.J.; Fogako, J.; Megnekou, R.; Metenou, S.; Sama, G.; Zhou, Y.; Cadigan, T.; et al. Detection of the Plasmodium falciparum Antigen Histidine-Rich Protein 2 in Blood of Pregnant Women: Implications for Diagnosing Placental Malaria. J. Clin. Microbial. 1999, 37, 2992–2996. Wu, J.; Peng, Y.; Liu, X.; Li, W.; Tang, S. Evaluation of wondfo rapid diagnostic kit (Pf-HRP2/PAN-pLDH) for diagnosis of malaria by using nano-gold immunochromatographic assay. Acta Parasitol. 2014, 59, 2670–2671. [CrossRef] [PubMed]
Biosensors 2017, 7, 28
23.
24. 25.
26. 27. 28. 29. 30. 31. 32.
33. 34. 35. 36.
37. 38.
39.
40.
41.
42.
13 of 14
Ouattara, A.; Doumbo, S.; Saye, R.; Beavogui, A.H.; Traoré, B.; Djimdé, A.; Niangaly, A.; Kayentao, K.; Diallo, M.; Doumbo, O.K.; et al. Use of a pLDH-based dipstick in the diagnostic and therapeutic follow-up of malaria patients in Mali. Malar. J. 2011, 10, 1475–2875. [CrossRef] [PubMed] Son, E.S.; Kim, T.S.; Nam, H.W. Western blot diagnosis of vivax malaria with multiple stage-specific antigens of the parasite. Korean J. Parasitol. 2001, 39, 171–176. [CrossRef] [PubMed] Sikarwar, B.; Sharma, P.K.; Srivastava, A.; Agarwal, G.S.; Boopathi, M.; Singh, B.; Jaiswal, Y.K. Surface plasmon resonance characterization of monoclonal and polyclonal antibodies of malaria for biosensor applications. Biosens. Bioelectron. 2014, 60, 201–209. [CrossRef] [PubMed] Tothill, I.E. Biosensors for cancer markers diagnosis. Seminars in cell & developmental biology. Semin. Cell Dev. Biol. 2009, 20, 55–62. Noh, M.F.; Tothill, I.E. Development and characterisation of disposable gold electrodes, and their use for lead (II) analysis. Anal. Bioanal. Chem. 2006, 386, 2095–2210. [CrossRef] [PubMed] Bard, A.J.; Faulkner, L.R. Electrochemical Methods: Fundamentals and Applications; Wiley: New York, NY, USA, 1980. Gosser, D.K.J. Cyclic Voltammetry: Simulation and Analysis of Reaction Mechanisms; Wiley: New York, NY, USA, 1993; pp. 27–30. Salam, F.; Tothill, I.E. Detection of Salmonella typhimurium using an electrochemical immunosensor. Biosens. Bioelectron. 2009, 24, 2630–2636. [CrossRef] [PubMed] Morrin, A.; Killard, A.J.; Smyth, R.M. Electrochemical Characterization of Commercial and Home-Made Screen-Printed Carbon Electrodes. Anal. Lett. 2007, 36, 2021–2039. [CrossRef] Mueller, T.R.; Adams, R.N. Voltammetry at inert electrodes: II. Correlation of experimental results with theory for voltage and controlled potential scanning, controlled potential electrolysis, and chronopotentiometric techniques. Anal. Chim. Acta 1961, 25, 482–497. [CrossRef] Arya, S.K.; Singh, P.S.; Malhotra, B.D.; Marks, R.S.; Cullen, D.C.; Karube, I.; Lowe, C.R.; Weetall, H.H. Handbook of Biosensors and Biochips; Wiley: New York, NY, USA, 2007; pp. 342–377. Parker, C.O.; Tothill, I.E. Development of an electrochemical immunosensor for aflatoxin M1 in milk with focus on matrix interference. Biosens. Bioelectron. 2009, 24, 2452–2457. [CrossRef] [PubMed] Fanjul-Bolado, P.; González-García, M.B.; Costa-García, A. Amperometric detection in TMB/HRP-based assays. Anal. Bioanal. Chem. 2005, 382, 297–302. [CrossRef] [PubMed] Volpe, G.; Draisci, R.; Palleschi, G.; Compagnone, D. 3, 30 , 5, 50 -Tetramethylbenzidine as electrochemical substrate for horseradish peroxidase based enzyme immunoassays: A comparative study. Analyst 1998, 123, 1303–1307. [CrossRef] Lillehoj, P.B.; Huang, M.C.; Truong, N.; Ho, C.M. Rapid electrochemical detection on a mobile phone. Lab Chip 2013, 13, 2950–2955. [CrossRef] [PubMed] Abdallah, J.F.; Okoth, S.A.; Fontecha, G.A.; Torres, R.E.; Banegas, E.I.; Matute, M.L.; Bucheli, S.T.; Goldman, I.F.; de Oliveira, A.M.; Barnwell, J.W.; et al. Prevalence of PfHRP2 and PfHRP3 gene deletions in Puerto Lempira, Honduras. Malar. J. 2015, 14, 19. [CrossRef] [PubMed] Dzakah, E.; Kang, K.; Ni, C.; Tang, S.X.; Wang, J.H.; Wang, J.F. Comparative performance of aldolase and lactate dehydrogenase rapid diagnostic tests in Plasmodium vivax detection. Malar. J. 2014, 13, 272. [CrossRef] [PubMed] Ho, M.F.; Baker, J.; Lee, N.; Luchavez, J.; Ariey, F.; Nhem, S.; McCarthy, J.S. Circulating antibodies against Plasmodium falciparum histidine-rich proteins 2 interfere with antigen detection by rapid diagnostic tests. Malar. J. 2014, 13, 480. [CrossRef] [PubMed] Sharma, M.K.; Rao, V.K.; Agarwal, G.S.; Rai, G.P.; Gopalan, N.; Prakash, S.; Sharma, S.K.; Vijayaraghavan, R. Highly sensitive amperometric immunosensor for detection of Plasmodium falciparum histidine-rich protein 2 in serum of humans with malaria: Comparison with a commercial kit. J. Clin. Microbial. 2008, 46, 3759–3765. [CrossRef] [PubMed] Sharma, M.K.; Agarwal, G.S.; Rao, V.K.; Upadhyay, S.; Merwyn, S.; Gopalan, N.; Rai, G.P.; Vijayaraghavan, R.; Prakash, S. Amperometric immunosensor based on gold nanoparticles/alumina sol-gel modified screen-printed electrodes for antibodies to Plasmodium falciparum histidine rich protein-2. Analyst 2010, 135, 608–614. [CrossRef] [PubMed]
Biosensors 2017, 7, 28
43.
44. 45.
46.
14 of 14
De Souza Castilho, M.; Laube, T.; Yamanaka, H.; Alegret, S.; Pividori, M. Magneto immunoassays for Plasmodium falciparum histidine-rich protein 2 related to malaria based on magnetic nanoparticles. Anal. Chem. 2011, 83, 5570–5577. [CrossRef] [PubMed] Gikunoo, E.; Abera, A.; Woldesenbet, E. A novel carbon nanofibers grown on glass microballoons immunosensor: A tool for early diagnosis of malaria. Sensors 2014, 14, 14686–14699. [CrossRef] [PubMed] Brince, P.K.; Kumar, S.; Tripathy, S.; Vanjari, S.R.K.; Singh, V.; Singh, S.G. A highly sensitive self- assembled monolayer modified copper doped zinc oxide nanofiber interface for detection of Plasmodium falciparum histidine-rich protein-2: Targeted towards rapid, early diagnosis of malaria. Biosens. Bioelectron. 2016, 80, 39–46. [CrossRef] [PubMed] Dutta, G.; Nagarajan, S.; Lapidus, L.J.; Lillehoj, P.B. Enzyme-free electrochemical immunosensor based on methylene blue and the electro-oxidation of hydrazine on Pt nanoparticles. Biosens. Bioelectron. 2017, 92, 372–377. [CrossRef] [PubMed] © 2017 by the authors. Licensee MDPI, Basel, Switzerland. This article is an open access article distributed under the terms and conditions of the Creative Commons Attribution (CC BY) license (http://creativecommons.org/licenses/by/4.0/).