Dental Materials Journal 26(6):882-891, 2007
Development of Three-dimensional FE Modeling System from the Limited Cone Beam CT Images for Orthodontic Tipping Tooth Movement Akira NAKAJIMA1, Mamoru MURATA2, Eiji TANAKA3, Yoshinori Yasukazu NISHI2, Glenn SAMESHIMA6 and Noriyoshi SHIMIZU1
ARAI4,
Yasumasa
FUKASE5,
Department of Orthodontics, Nihon University School of Dentistry, 1-8-13 Kanda Surugadai, Chiyoda-ku, Tokyo 101-8310, Japan 2 Department of Mechanical Engineering, College of Industrial Technology, Nihon University, 1-2-1 Izumicho, Narashinoshi, Chiba 275-8575, Japan 3 Department of Orthodontics and Craniofacial Developmental Biology, Hiroshima University Graduate School of Biomedical Sciences, 1-2-3 Kasumi, Minami-ku, Hiroshima 734-8553, Japan 4 Department of Hard Tissue Research, Matsumoto Dental University Graduate School of Oral Medicine, 1780 Gobara Hirooka Shiojiri, Nagano 399-0781, Japan 5 Department of Dental Materials, Nihon University School of Dentistry, 1-8-13 Kanda Surugadai, Chiyoda-ku, Tokyo 1018310, Japan 6 Department of Orthodontics, University of Southern California School of Dentistry, 925 West 34th St., DEN 312D, Los Angeles, California 90089, USA Corresponding author, Akira NAKAJIMA; E-mail:
[email protected] 1
Received September 11, 2006/Accepted July 3, 2007 Previously, numerous three-dimensional finite element (FE) models of the dentoalveolar complex have been developed and stress analyses of orthodontic tooth movements were reported. Most of the models were, however, developed based on average anatomical data, but not on individual data. The aim of this study, therefore, was to investigate dentoalveolar stress distribution by lingual and distal tipping tooth movements using FE models of individual teeth based on the limited cone beam CT (3DX) images. Three extracted teeth (lower canine, upper molar, and lower molar) were used to test the threedimensional reconstruction procedure in terms of accuracy and reproducibility in linear dimensions and sizes. From the stress analysis of the three different models, the equivalent stress in tipping movement concentrated at the cervical region of the PDL and bone crest in all teeth. It was suggested that the FE modeling technique based on 3DX in this study is recommended for the individual determination of optimal orthodontic force for effective tooth movement. Keywords: Three-dimensional FE model, Orthodontic tooth movement, Limited cone beam CT
INTRODUCTION The finite element (FE) method has proven to be a suitable tool for approximating the distribution of stresses in structures in dentistry1-12). Indeed, since 1980, several three-dimensional FE models of the tooth, including the periodontal ligament (PDL) and alveolar bone, have been created1-12). These models have shown, for example, that the predicted stress distribution in the PDL and on the surface of root matched up to the resultant bone remodeling in the alveolar bone. However, most of the three-dimensional models have been developed based on average anatomical data. In other words, individual structural differences of the tooth are not considered nor reflected in the stress analysis results. For example, a previous study demonstrated that stress distribution in the PDL was affected by root length and alveolar bone height2). Furthermore, results have revealed that an orthodontic force application should be determined on the basis of anatomical variations in tooth length and alveolar bone height to induce optimal stress in the PDL, which is a key to desirable tooth movement. Therefore, to identify the precise stress status in the
PDL during tooth movements, a stress analysis using an individual FE model should be performed. To create an individual FE model of the tooth, we developed an algorithm to construct the alveolar complex model based on data from a limited cone beam dental compact-CT (3DX). This CT has a radiological dose effect that is 1/100 of the helical-CT and with a higher resolution than the other CTs13,14). The aim of this study, therefore, was to develop FE models of teeth from the limited cone beam CT images, and then further investigate stress distributions in the tooth-PDL-bone complex during two different orthodontic tooth movements by use of FE analysis. MATERIALS AND METHODS Imaging system The original prototype made use of an existing technology in which the film was replaced by an image intensifier13). Subsequent refinements and improvements resulted in the transfer of technology to Morita Corporation as the 3DX multi-image micro-CT (3DX). The radiation field of this cone beam CT is limited to a height of 29 mm and a width of 38 mm at the center of rotation. Standard imaging conditions are
NAKAJIMA et al.
Fig. 1
883
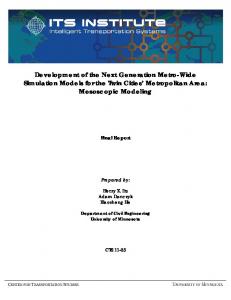
A-C 1: Extracted teeth; A-C2: Reconstructed FE tooth models; A-C 3: Entire FE tooth models including periodontal ligament and alveolar bone; D-1 and 2: High-magnification images of original tooth and FE model. Arrow heads indicate cavern of tooth surface.
884
3D FE modeling system from CBCT
a tube voltage of 85 kV and a tube current of 2 mA. Image data are on a two-dimensional screen measuring 240 pixels in the vertical direction by 320 pixels in the horizontal direction, and its resolution is 0.125 mm for one pixel13). FE models Three different extracted teeth (mandibular canine, mandibular and maxillary molars) were imaged in CT (Figs. 1 A-1, B-1, and C-1). These CT images were converted to three-dimensional point data sets by use of IRIS Explorer (NAG, Tokyo, Japan). After deleting tooth pulp data and adjusting FE models to the original tooth size, the surface of each tooth was created using the three-dimensional point data obtained. Thereafter, using our algorithm, we created FE models from the three-dimensional point data sets of the CT images (Figs. 1 A-2, B-2, and C-2). The geometry of PDL was defined based on anatomical knowledge, and the thickness of PDL was determined to be an average of 0.2 mm. Bone elements were established around the PDL elements (Figs. 1 A-3, B-3, and C-3). Consequently, the three-dimensional canine model including PDL and alveolar bone consisted of 90,701 elements and 17,320 nodes. The mandibular and maxillary molars consisted of 99,806 and 151,348 elements, and 17,700 and 26,156 nodes, respectively. Material property and boundary condition Table 1 summarizes the material properties of tooth, PDL, and alveolar bone used in this analysis, as mentioned in a previous study5). The loading configuration was designed to mimic conventional orthodontic tooth movement. Lingual and distal tipping forces were applied at the middle of buccal crown surface, with a 5×5 mm square area as an orthodontic bracket. The orthodontic force was simulated by applying a force of 1 N perpendicular to the long axis of the tooth as lingual and distal tipping tooth movement. For the alveolar bone, displacement at the peripheral nodes was constrained to zero.
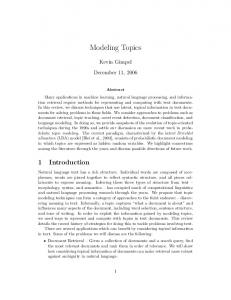
RESULTS Accuracy of the reconstructed FE models Three-dimensional FE models could be reconstructed from CT images of extracted lower canine, mandibular molar, and maxillary molars (Figs. 1 A-C). These FE models showed that details of the original tooth shape could be precisely reconstructed (Fig. 1 D-1, 2). To reconstruct the FE models, we developed an algorithm to delete neighboring points within a distance of 0.5 mm from the original surface points. The original three-dimensional point data contained irregular triangle surface elements (Fig. 2 A). Near points which had a relatively short distance, as compared with the average distance, were created on the tooth surface due to noise during CT image processing. An irregular triangle surface element was created when these near points were connected as one side of the triangle. These elements were eliminated from FE analysis because they would lead to errors in numerical integration and interfere with FE analysis (Fig. 2 A). To avoid potential errors, the distance between every two points was calculated by computer and the neighboring points within a specified distance (0.5 mm in this case) were merged into one representative point. The representative point was either the center of gravity of the neighboring point group or merely a representative point. Figures 1 A-2, B-2, and C-2 show the volume models surrounded by such modified surface elements. Table 2 shows the mesio-distal and bucco-palatal widths of the crown and the total lengths of the three
Table 1 Material properties for finite element models Material
Young’ s modulus(Mpa)
Poisson’ s ratio
Tooth
19600
0.3
PDL
0.666
0.49
Bone
13700
0.3
Fig. 2
A: Before modification of three-dimensional points for FE tooth model using our algorithm; B: After modification of FE tooth model.
NAKAJIMA et al. Table 2
885
Tooth sizes of FE models Canine
Extracted teeth
FE moldel
Tooth Length 26.61
Manxibular molar
Maxillary molar
Mesial root
Distal root
Bucco-mesial root
Bucco-distal root
Lingual root
24.76
23.30
25.86
26.31
27.30
Mesio-distal crown width
8.39
16.89
13.14
Bucco-palatal crown width
6.30
14.17
15.35
Tooth Length 26.73
24.88
23.42
25.97
26.43
Mesio-distal crown width
8.51
17.01
13.26
Bucco-palatal crown width
6.42
14.29
15.47
27.20
Unit: mm
different teeth by direct measurement with a caliper and those from the three-dimensional FE models. The obtained lengths and widths revealed 0-0.1% error, ranging from 0 to 0.115 mm, between the measurements from the original extracted teeth and the FE models (Table 2). All dimensions obtained from the three-dimensional tooth models agreed with the measured values within the 0.125 mm of a resolution unit of CT images. Comparison of the stress distribution dependence on the number of roots during tipping tooth movement When applying a lingual tipping force (1 N) on the bracket node of the canine model, a region of relatively high equivalent stress was found at the lingual and labial surfaces of the root (Fig. 3 A-1, 2). The maximum value was 179.2 kPa, which was detected on the cervical level of the roots. By applying a distal tipping force, relatively high stresses were observed mainly at the middle level of the distal and mesial root surfaces. The maximum value was 320 kPa (Fig. 3 B-1, 2). The stresses observed at the mesial root surface were distributed over a wider area than those at the distal surface. In the lingual tipping movement of the mandibular molar, relatively high equivalent stress (approximately 65 kPa) was found at the buccal surfaces of mesial and distal roots (Fig. 3 C-1, 2). Meanwhile, the maximum stress in the distal tipping movement was approximately 240 kPa, which was observed at the root furcation (Fig. 3 D-1, 2). In the FE model of maxillary molar, stresses induced by the lingual tipping force were found mainly at the buccal surface of the lingual root, and the maximum stress (approximately 84 kPa) was found near the root furcation (Fig. 3 E-1, 2). Meanwhile, in the distal tipping movement, a relatively high stress of approximately 100 kPa was found at
the distal surface of the lingual root (Fig. 3 F-1, 2). Biomechanical responses in the periodontal ligament In the canine model, relatively high stresses induced by the lingual tipping movement were also found mainly at the cervical level of the root on labial and lingual surfaces. However, the maximum stress in the PDL was 6-7 kPa, which was approximately 4- 5% of the maximum stress on the root surface (Fig. 4 A-1-4). When the distal tipping force was applied, relatively high stress (approximately 4-5 kPa) was observed in the mesio-distal direction at the cervical level (Fig. 4 B-1-4). The maximum stresses observed in the PDL were larger in the lingual tipping movement than in the distal tipping movement. In the mandibular molar, the maximum stress (approximately 5-6 kPa) was localized in the PDL near the root furcation between the mesial and distal roots when distal and lingual tipping forces were applied (Figs. 4 C-1-4, D-1-4). Comparing the stresses on the root apex, the distal root stress was larger than that of the mesial root. In the FE model of maxillary molar, stress was found mainly at the cervical level in buccal and lingual directions, which was almost similar to those in the canine model (Figs. 4 E-1-4, F-1-4). The maximum stresses in the PDL were approximately 0.8 kPa, and observed in the PDL at the cervical level and root apex (Table 3). Stress distribution in the alveolar bone In the alveolar bone, stress distribution was almost similar to that in the PDL, but the values of stress distributed in the alveolar bone were approximately 10-20 times lager than those in the PDL (Table 3). Furthermore, almost one-tenth of the stresses distributed on the root surface. Irrespective of the tipping force application pat-
886
Fig. 3
3D FE modeling system from CBCT
A: Canine stress distribution of lingual tipping movement; B: Canine stress distribution of distal tipping movement; C: Mandibular molar stress distribution of lingual tipping movement; D: Mandibular molar stress distribution of distal tipping; E: Maxillary molar stress distribution of lingual tipping movement; F: Maxillary molar stress distribution of distal tipping movement; 1: Labial view; 2: Lingual view.
NAKAJIMA et al.
Fig. 4
887
A: Canine PDL stress distribution of lingual tipping; B: Canine PDL stress distribution of distal tipping movement; C: Mandibular molar PDL stress distribution of lingual tipping movement; D: Mandibular molar PDL stress distribution of distal tipping movement; E: Maxillary molar PDL stress distribution of lingual tipping movement; F: Maxillary molar PDL stress distribution of distal tipping movement; 1: Occlusal view; 2: Apical view; 3: Distal view; 4: Bucco-lingual view.
888
Fig. 5
3D FE modeling system from CBCT
A: Canine alveolar bone stress distribution of lingual tipping movement; B: Canine alveolar bone stress distribution of distal tipping movement; C: Mandibular molar alveolar bone stress distribution of lingual tipping movement; D: Mandibular molar alveolar bone stress distribution of distal tipping movement; E: Maxillary molar alveolar bone stress distribution of lingual tipping movement; F: Maxillary molar alveolar bone stress distribution of distal tipping movement. All figures are showing occlusal view of alveolar bone elements.
NAKAJIMA et al.
889
Table 3 Maximal nodal equivalent stress at cervical line and root apex of PDL and alveolar bone Root-PDL stress Canine
Mandibular molar
Maxillary molar
PDL-Bone stress surface
Lingual tipping
Distal tipping
Buccal cervical line
6.238
4.704
Lingual tipping 45.423
Distal tipping 39.963
Lingual cervical line
6.910
1.751
44.989
17.150
Mesial cervical line
3.022
5.147
26.076
48.963
Distal cervical line
2.453
4.598
9.369
34.483
Root apex
2.028
0.985
24.624
48.411
Buccal cevical line
2.137
1.155
22.782
12.573
Lingual cevical line
1.669
1.461
19.399
16.509
Mesial cevical line
1.647
1.608
16.103
23.654
Distal cevical line
1.145
2.232
17.571
22.116
Mesial root apex
0.818
0.668
14.138
18.115
Distal root apex
0.698
0.621
8.364
16.396
Buccal cevical line
0.828
0.763
22.557
18.552
Lingual cevical line
0.807
0.546
19.070
15.926
Mesial cevical line
0.770
0.778
13.696
20.231
Distal cevical line
0.948
0.781
27.216
31.708
Mesial bucco root apex
0.569
0.333
7.953
5.040
Distal bucco root apex
0.477
0.431
7.116
7.122
Lingual root apex
0.566
0.629
11.081
9.089 Unit: kPa
tern, the maximum stress in the canine alveolar bone was found at cervical level (approximately 40-50 kPa) (Figs. 5 A, B and Table 3). In the mandibular molar, the maximum stresses in both the lingual and distal tipping movements were found at root furcation (approximately 60 kPa) (Figs. 5 C, D). Regarding the stress induced at root apex, the stress value was larger in the bucco-mesial direction than that of the buccal-distal one (Table 2). Furthermore, in the maxillary molar model, the maximum stresses (approximately 30 kPa) were located at the cervical level of distal depression (Figs. 5E, F and Table 2). The bone crest between the bucco-mesial and buccodistal root furcations also showed relatively high stresses, which were approximately 20 kPa (Figs. 5 E, F). DISCUSSION Previously, several researchers8-10) constructed FE tooth models using a series of slice images of a tooth and performed stress analysis during tooth movements. However, these FE models were developed as general tooth models with an average size and shape of the crown and root. Subsequently, in a previous study, an automatic modeling system from CT image was developed for computer-aided diagnosis15). However, this system was used only for simulation
to identify the density of alveolar bone for human growth, but not for stress analysis of the periodontium complex during orthodontic tooth movement. Our cone beam CT had a high resolution of 0.125 mm for one pixel13). In addition, this CT had an extremely low radiological dose, which was 1/100 of helical-CT13). The micro CT was developed as a highresolution imaging device and a precise FE modeling tool using the images16). However, it could not be adapted for human use because of its high radiological dose effect. In the present study, the tooth length and width obtained from the FE model were very close to those measured directly (Table 2), revealing only 0-0.1% error. Furthermore, this modeling system could detect the microstructure of the root surface and could simulate even a small defect on the root precisely (Fig. 1 D-1, 2). Therefore, a three-dimensional tooth model constructed by this modeling system would be sufficiently accurate to facilitate stress analysis in the dentoalveolar complex during tooth movements. When lingual and distal tipping forces were applied, our FE analysis results showed that maximum stresses were observed mainly at the cervical level of root, PDL, and alveolar bone. Stress concentration at the cervical level could be associated with bone remodeling or bone loss, resulting in expected
890
3D FE modeling system from CBCT
tipping tooth movements. Comparing the stress values in the root apex between canine and molars, the stress level was much higher in the canine model than in the mandibular and maxillary molar models. This implied that the stress distribution in the PDL and on the root surface could provide insight for clinical consideration that the maxillary and mandibular molars were less susceptible to apical root resorption than the single root. In fact, previous radiological studies17,18) showed that single roots such as maxillary central incisor exhibited the highest incidence of apical root resorption during orthodontic tooth movement. As our FE models were reconstructed from individual teeth, it was impossible to compare this set of analysis data against those using the average anatomical model. However, when comparing to previous published results based on the average anatomical molar model9), we could demonstrate that stress distribution on the surface of tooth was dependent on the microstructure of the tooth surface. Therefore, in vivo stress distribution on the tooth surface during orthodontic tooth movement may not show a smooth gradation which can be detected in the average anatomical tooth model9). The major components of the ground substance of PDL include proteoglycans and glycoproteins. Proteoglycans consist of a core protein to which glycosaminoglycan (GAG) sulfate side-chains are attached19-21), and they mainly contribute to the viscoelastic properties of the PDL22). In the present study, the stress value on the root surface was approximately 400-500 kPa (Fig. 3), whereas those in the PDL and alveolar bone were around 1-6 kPa and 10-50 kPa respectively (Figs. 4, 5 and Table 3). This implied that the stress induced by orthodontic tipping force was transmitted through the PDL and reduced by 10% on the alveolar bone. This result might support a histological phenomenon that the PDL has a viscoelastic behavior in nature and contributes to bone remodeling in the alveolar bone during orthodontic tooth movements. In a previous study, an orthodontic diagnosis tool was introduced to put together a standard CT threedimensional image of a person’ s head with measuring points extracted from the patient’ s information such as X-ray films, individually23). In the same vein, present FE models may also provide a standard database of three-dimensional points of tooth shape of individual patients. This could be helpful in reconstructing individual dental arch where FE analysis could fit individual patient’ s CT images as a computer-aided diagnosis system. The limitations of this study involved the noise of CT images such as artifacts. However, our algorithm was able to reduce the noise of CT images as described above. Therefore, this modeling system
could assuredly construct precise FE models directly from limited cone beam CT images. The future direction of our FEM simulation should involve more accurate simulation of loading and approximation of material behaviors, as well as variations in the geometries of PDL, bone, and tooth. Nonetheless, FEM simulation using CT images can be a powerful computational tool with great flexibility in modeling geometries and mechanical behaviors of biological tissues. CONCLUSIONS Our three-dimensional reconstruction procedure created FE tooth models (lower canine, and upper and lower first molars) of sufficient accuracy. We thus suggested that the FE modeling technique based on 3DX in this study is recommended for the individual determination of optimal orthodontic force for effective tooth movement. In the future, these FE modeling tools can be useful for individual internal stress distribution for orthodontic treatment plan. ACKNOWLEDGEMENTS The authors wish to thank Mr. Hiroki Sakurada and Dr. Tetsuo Ohyama at Nihon University. This work was supported by a Grant from the Ministry of Education, Culture, Sports, Science and Technology to promote multi-disciplinary research projects, by Nihon University Research Individual Grant for 2005 and 2007, by a Grant from Dental Research Center, Nihon University, and by Sato Funds from Nihon University School of Dentistry. REFERENCES 1)
2)
3)
4)
5)
Tanne K, Sakuda M, Burstone C. Three-dimensional finite element analysis for stress in the periodontal tissue by orthodontic forces. Am J Orthod Dentofacial Orthop 1987; 92: 499-505. McGuinnes N, Wilson AN, Jones M, Middleton J, Robertson NR. Stress induced by edgewise appliances in the periodontal ligament ― a finite element study. Angle Orthod 1992; 62: 15-22. Cobo J, Arguelles J, Puente M, Vijande M. Dentoalveolar stress from bodily tooth movement at different levels of bone loss. Am J Orthod Dentofacial Orthop 1996; 110: 256-262. Middleton J, Jones M, Wilson A. The role of the periodontal ligament in bone modeling: The initial development of a time-dependent finite element model. Am J Orthod Dentofacial Orthop 1996; 109: 155-162. Tanne K, Yoshida S, Kawata T, Sasaki A, Knox J, Jones, ML. An evaluation of the biomechanical response of the tooth and periodontium to orthodontic forces in adolescent and adult subjects. Br J Orthod 1998; 25: 109-115.
NAKAJIMA et al. 6)
7)
8)
9)
10)
11)
12)
13)
14)
Jeon PD, Turley PK, Moon HB, Ting K. Analysis of stress in the periodontium of the maxillary first molar with a three-dimensional finite element model. Am J Orthod Dentofacial Orthop 1999; 115: 267-274. Geramy A. Alveolar bone resorption and the center of resistance modification (3-D analysis by means of the finite element method). Am J Orthod Dentofacial Orthop 2000; 117: 399-405. Jones ML, Hickman J, Middleton J, Knox J, Volp C. A validated finite element method study of orthodontic tooth movement in the human subject. J Orthod 2001; 28: 29-38. Jeon PD, Turley PK, Moon BH, Ting K. Analysis of stress in the periodontium of the maxillary first molar with a three-dimensional finite element model. Am J Orthod Dentofacial Orthop 1999; 115: 267-274. Qian H, Chen J, Katona TR. The influence of PDL principal fibers in a 3-dimensional analysis of orthodontic tooth movement. Am J Orthod Dentofacial Orthop 2001; 120: 272-279. Rudolph DJ, Willes MG, Sameshima GT. A finite element model of apical force distribution from orthodontic tooth movement. Angle Orthod 2001; 71: 127-131. Toms SR, Eberhardt AW. A nonlinear finite element analysis of the periodontal ligament under orthodontic tooth loading. Am J Orthod Dentofacial Orthop 2003; 123: 657-665. Arai Y, Tammisalo E, Iwai K, Hashimoto K, Shinoda K. Development of a compact computed tomographic apparatus for dental use. Dentomaxillofac Radiol 1999; 28: 245-248. Nakajima A, Sameshima GT, Arai Y, Homme Y, Shimizu N, Dougherty H. Two- and three-dimensional orthodontic imaging using limited cone beamcomputed tomography. Angle Orthod 2005; 75: 724-
15)
16)
17)
18) 19) 20)
21) 22)
23)
891
732. Maki K, Inou N, Takanishi A, Miller AJ. Computerassisted simulations in orthodontic diagnosis and the application of a new cone beam X-ray computed tomography. Orthod Craniofac Res 2003; 6: 95-101. Jaecques SV, Van Oosterwyck H, Muraru L, Van Cleynenbreugel T, De Smet E, Wevers M, Naert I, Vander SJ. Individualized micro CT-based finite element modeling as a tool for biomechanical analysis related to tissue engineering of bone. Biomaterials 2004; 25: 1683-1696. Beck BW, Harris EF. Apical root resorption in orthodontically treated subjects: analysis of edgewise and light wire mechanics. Am J Orthod Dentofacial Orthop 1994; 105: 350-361. Sameshima GT, Sinclair PM. Predicting and preventing root resorption: Part II. Treatment factors. Am J Orthod Dentofacial Orthop 2001; 119: 511-515. Larjava H, Hakkinen L, Rahemtulla F. A biochemical analysis of human periodontal tissue proteoglycans. Biochem J 1992; 284: 267-274. Hakkinen L, Oksala O, Salo T, Rahemtulla F, Larjava H. Immunohistochemical localization of proteoglycans in human periodontium. J Histochem Cytochem 1993; 41: 1689-1699. Iozzo RV. Matrix proteoglycans: from molecular design to cellular function. Annu Rev Biochem 1998; 67: 609-652. Yoshida N, Koga Y, Peng CL, Tanaka E, Kobayashi K. In vivo measurement of the elastic modulus of the human periodontal ligament. Med Eng Phys 2001; 23: 567-572. Nakashima A, Terajima M, Mori N, Hoshino Y, Tokumori K, Aoki Y, Hashimoto S. Three-dimensional computer-generated head model reconstructed from cephalograms, facial photographs, and dental cast models. Am J Orthod Dentofacial Orthop 2005; 127: 282-292.