THE 4th INTERNATIONAL CONFERENCE ON THEORETICAL AND APPLIED PHYSICS (ICTAP-2014) 16-17 October 2014, Denpasar-Bali, Indonesia
Development of Web-based Power Monitoring System for a Pulse Combustion Spray Pyrolysis using Java Programming Agus Fattrya Nanda1, Darmawan Hidayat1, Camellia Panatarani1, Dwindra W. Maulana1 and I Made Joni1, a) 1
Lab. of Instrumentation System and Functional Material Processing, Dept. of Physics, Faculty of Mathematics and Natural Sciences, Padjadjaran University, Jl. Raya Bandung-Sumdedang, KM 21, Jatinangor 45363, Jawa Barat, Indonesia a)
Corresponding author:
[email protected]
Abstract. High production rate of nanoparticles synthesis by pulse combustion spray pyrolysis (PCSP) method is currently developed. In order to have the visibility study of the pilot industrial scale of this system, the information of electrical consumption is very crucial. These electrical quantities measurement includes current, voltage and power. In this current investigation, a remote monitoring system has been developed equipped with a KM50-E1-FLK power monitoring and a KM20-CTF-50A in which use a RS-485 serial communication interface into a PLC in a local area network (LAN). The obtained data from a PLC is transmitted to a computer server. The monitoring application system is developed using a JAVA programming language for both server and user side. The energy consume by a pulse combustion system has been successfully monitors in a web based monitoring system. In addition, the results of the monitoring inform the characteristics of the device used in PCSP. Thus, it is concluded that the system can be used for feasibility study as well as for monitoring the performance of the device during operation. Keywords: Power Monitoring, Java, Pulse Combustion, Spray Pyrolysis. PACS: 00.07.05.HD
INTRODUCTION Processing a raw material into a functional material can be done by various methods, among those method the PCSP is the promising method for high production rate. High production rate of nanoparticles synthesis by pulse combustion spray pyrolysis (PCSP) method is currently developed. The advantage of using a pulse combustion spray pyrolysis method are high purity product and relatively high production rate process compared with conventional methods such as liquid-solution. Newly developed pilot plant was a scale up plant of previously studied PCSP system [1] equipped with automation of factories and were being covered with machinery. Spaces crowded with machinery are more difficult and dangerous for personnel to operate in. Thus a PLC with Supervisory control and data acquisition (SCADA) technology system is usually employed to allow effective control of the machinery and also achieve a realtime and web-based monitoring system [2-5]. Additionally, the developed system helps improve students' skills on SCADA systems in use in industry [6]. In order to see the economy of the products, a feasibility study of the pilot plant in industrial scale is necessary to be conducted. Thus the information of electrical power consumption is very crucial in feasibility study. Therefore the objective of this research is the development of a monitoring system for a newly developed PCSP system equipped with web-based application. The system was designed includes the devices used in the measurement of electrical quantities, data communication, and a software applications for remote monitoring. Finally, the results of the consumed power from the remote monitoring system in relation to the use several machinery are presented and discussed.
THE 4th INTERNATIONAL CONFERENCE ON THEORETICAL AND APPLIED PHYSICS (ICTAP-2014) 16-17 October 2014, Denpasar-Bali, Indonesia
DESIGN AND DEVELOPMENT Pulse Combustion Spray Pyrolysis Spray pyrolysis is a process in which raw material (precursor solution) in the form of droplets are decomposed into smaller particles then leads to nucleation and particle formation. Spray pyrolysis works by spraying a carrier gas to form precursor solution into small droplets, with attention to the gas temperature, while the solvent is evaporated and the dissolved substances deposited in the droplet. Pulse combustion is used as a heating process in the spray pyrolysis reactor in which the heat generated to thermally decompose the precursor and formed particles [1]. The devices in PCSP that need to monitor their electric consumption are pumps, scrubber, mixer, sprayer and heaters as shown in Fig.1.
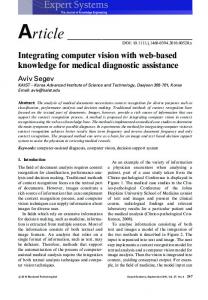
Designing the Monitoring System Power Monitor Power monitor is a system to measure electrical energy or electrical power consumed by various loads in PCSP as shown in Fig. 1. The system also provides separate monitoring for others electric variables such as currents, voltages and frequency. Briefly, a power monitoring system is a process to collect real time data of electric consumption from various devices used in PCSP. The KM50-E1-FLK is a power monitoring device was applied for a system of threephase and four wires where it communicate with PLC by a serial communication system RS-485. Current transformer (KM20-CTF-50A) was applied as a current sensor where the flows of the secondary current was associated with the ratio and the magnitude of the primary current. This magnetic sensors works on the principle of faraday and Hall Effect. Programmable Logic Controller (PLC) PLC is simply a computer which is designed for special purposes as a controller for a process system such as in PCSP. Memory in the PLC is used to store instructions and execute special functions including on/off control, timers, counters and arithmetic operations [2]. The PLC (modicon340) is interface to a computer as server in a local Area Networking (LAN) system.
FIGURE 1. Power Line Controller in the PLC
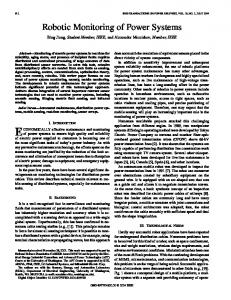
THE 4th INTERNATIONAL CONFERENCE ON THEORETICAL AND APPLIED PHYSICS (ICTAP-2014) 16-17 October 2014, Denpasar-Bali, Indonesia 3 Phase
CT-600/5A
KM20-CTF-5A MOTOR MOTOR MOTOR
RS-485
….. Other Loads
KM50-E1-FLK Server Computer LAN
PLC
FIGURE 2. Monitoring System Block Diagram in PCSP Database The database is defined as a collection of integrated data and arranged so that the data can be manipulated, retrieved and searched quickly. In this design a MySQL software was used as back end application for a RDBMS (Relational Database Management System) or a database server that can manage the database very quickly, can hold data in very large quantities, and can be accessed by multiple users [3]. In the front end application, the Microsoft Access database object had been designed includes seven forms, tables, queries, reports, pages, macros and modules. This front end application display the electrical data in the form of power consumes, voltages, currents and frequency from the monitoring menu in the PCSP power monitoring application system. In addition, this application also provide the application for the user to set various controlled variables in PCSP. In the back end, the MySQL database was used to set the menu according to the values inserted by user such as variables to set values for heaters, blower, mixer, power bag filter, MFC1 and MFC2 [4]. In addition, the XAMPP MySQL was applied when a standalone server (local host) mode was operated. Remote Monitoring and Communication System When the system dedicated for the remote monitoring and control, a network of communication system was design as shown in Fig. 3. In contrast to the standalone system, in the remote monitoring system a Java programming language was developed for an application that can be run on a standalone computer or in a network environment. The applied communication systems were a serial communication system and LAN. The type of applied serial communication system was a RS-485 with modbus communication protocol. Serial communication system was designed to transmit data from KM50-E1-FLK to the PLC as shown in Fig. 2. The data of power monitoring was stored in the computer server pass through LAN communication. Those data can be accessed remotely by using the developed JAVA applications and named this system as web-based power monitoring system.
LAN PLC
Database Access
http://espelab.fmipa.unpad.ac.id/ped ca/test_plc.xml
C#
Web (Network)
JAVA
FIGURE 3. The block diagram of the developed network-based application
THE 4th INTERNATIONAL CONFERENCE ON THEORETICAL AND APPLIED PHYSICS (ICTAP-2014) 16-17 October 2014, Denpasar-Bali, Indonesia
RESULTS AND DISCUSSION Figure 4 shows a real time measurement of three-phase electric power against time when all units of PCSP was on. The results shows that the electrical sources was stable after 20 minutes. In contrast, the T voltage source in threephase system resulted the most stable voltage due to lowest loads compare to other sources. Contrary, the R voltage source was the most unstable voltage due to highest load applied to this source. Both R and S sources were stable after 20 minutes though the values were lower compare the T source. This results also confirm in Fig. 5 when all loads were switched, a very high current flows in R source since two heater were applied as loads. In addition, Fig. 5 also showed the rise time of the applied current of heater is 20 minutes. Then it was also observed that the current was reached a stable current after 20 minutes. In contrast, lower current overshoot were observed respectively for S and T sources compare to R source. This results indicated that the developed monitoring system can also be applied as a tools to observe the performance of the controllers. 250
VOLTAGE (V)
200
150
VOLTAGE_R VOLTAGE_S VOLTAGE_T
100
50
0 0
5
10
15
20
25
30
TIME (MINUTES)
35
40
45
50
55
FIGURE 4. The real time measurement of voltages when all units of PCSP was on. 25
CURRENT_R CURRENT_S CURRENT_T
CURRENT (A)
20
15
10
5
0 0
5
10
15
20
25
30
35
40
45
50
55
TIME (MINUTES)
FIGURE 5. The real time measurement of currents in three-phase system when all the unit was on.
THE 4th INTERNATIONAL CONFERENCE ON THEORETICAL AND APPLIED PHYSICS (ICTAP-2014) 16-17 October 2014, Denpasar-Bali, Indonesia 52
FREQUENCY (Hz)
51.5
51
50.5
50
49.5
49 0
5
10
15
20
25
30
35
40
45
50
55
TIME (MINUTES)
FIGURE 6. The real time measurement of the frequency when the each device was on sequentially. Figure 6 shows the real time measurement of the electrical frequency of the applied electrical power. The result showed that the frequency was stable at the beginning, however, after 30 minutes the frequency was unstable. This result indicated that the rotation of the electric motor was stable where inverter was applied as a speed controller (unit: rotation per minute). However, when other devices were switched on such as mixer, blower and pump, the frequency turned to unstable. This may due to the devices were operated without controller which derived instability of the rotation of the electric motor. 1.2
POWER CONSUMPTION (KWh)
HEATER
1
MIXER BLOWER PUMP SCRABER
0.8
0.6
0.4
0.2
0 0
5
10
15
20
25
30
35
40
45
50
55
TIME (MINUTES)
FIGURE 7. The comparison of power consumption for various devices in the PCSP system. Figure 7 showed the power consumption comparison of various devices in PCSP system. It was found that additional heaters in the PCSP was consumed highest energy compare to other devices such as blower, mixer, pump and scrubber. Instability of the consumed power by heater may due to the R phase loaded by two heaters which have higher power. Thus it observed that the consumed power for the heater is significantly higher compare to other loads. It is common phenomena when consumed power is large may cause large loading effect and turn to generate instability of the power sources. High consumed power by heater may affect the significant overall power consumption of the PCSP system. Therefore, additional of heaters in the PCSP system need to be consider in the feasibility study since high power consumption may cause cost-ineffective product.
CONCLUSION It was concluded that the developed power monitoring system for a pulse combustion spray pyrolysis system able to perform real time monitoring and to calculate the energy consumption which is required in the feasibility study of the system. It was found that additional heaters in the PCSP was consumed highest energy compare to other devices such as blowers, mixers, pump and scrubber. In addition, the developed system allows a remote power monitoring which is not only important for the energy consumption but also for safety of the system during operation.
THE 4th INTERNATIONAL CONFERENCE ON THEORETICAL AND APPLIED PHYSICS (ICTAP-2014) 16-17 October 2014, Denpasar-Bali, Indonesia
ACKNOWLEDGMENT We would like to acknowledge the Directorate of Higher Education of the Republic of Indonesia for the financial support under the schema of Penelitian Unggulan Strategis Nasional (Contract No: 203/SP2H/PL/DIT.LITABMAS/ V/2013 ).
REFERENCES 1. M. Joni, A. Purwanto, F. Iskandar, M. Hazata and K. Okuyama, Chem. Eng. J. 155 (1-2), 433-441 (2009). 2. C. P. Young, W. L. Juang and M. J. Devaney, Instrumentation and Measurement, IEEE Transactions 49 (3), 579– 584 (2000). 3. L. Benini, A. Bogliolo, and G. De Micheli, Very Large Scale Integration (VLSI) Systems, IEEE Transactions 8 (3), 299–316 (2000). 4. W. T. Sung and Y. C. Hsu, Expert Systems with Applications 38 (4), 4522–4529 (2011). 5. C. Şahin and E. D. Bolat, Specification, Standards and Information Management for Distributed Systems 31 (5), 984–993 (2009). 6. Z. Aydogmus and O. Aydogmus, Education, IEEE Transactions 52 (1 ), 126–132, 2008 7. F. Petruzella, Programmable Logic Controller 3rd edition, New York : McGraw-Hill Higher education, 2005, pp 20-40. 8. R. Sanjaya, Pengolahan Database MYSQL 5 dengan Java 2, Yogyakarta: Andi Publisher, 2006, pp 30-35. 9. Madcoms, Aplikasi Web Database dengan Dreamweaver dan Php-MySQL, Yogyakarta: Andi, 2011, pp 20-25.