Arch. Med. Vet. 37, Nº 2, 2005
TRIPLOIDIZATION, CYTOMETRY, MICROSCOPY, IMAGE PROCESSING
ARTICULO ORIGINAL
Di- and triploid erythrocyte identification by multi-parameter image analysis:
A new method for the quantification of triploidization rates in rainbow trout
(Oncorhynchus mykiss) Identificación de di- y triploidización por análisis multiparamétrico de imágenes:
Un nuevo método para la cuantificación de la tasa de triploidización en trucha arcoiris
(Oncorhynchus mykiss)
S Härtel1*, R Rojas2, C Räth3, M I Guarda4, O Goicoechea5 1 Centro
de Estudios Científicos (CECS). 2 Xperts Ltda., Yerbas Buenas. 3 Max-Planck-Institut für Extraterrestrische Physik. 4 Institute of Physics. 5 Institute of Embryology, Universidad Austral de Chile.
RESUMEN La creciente competencia internacional ha forzado a la industria del salmón a la incorporación de técnicas innovadoras. El cultivo de hembras triploides tiene múltiples ventajas sobre poblaciones diploides. En la actualidad, no existe un método simple, exacto y de bajo riesgo para la cuantificación de tasas de triploidización. En este trabajo presentamos un método que combina microscopía de campo claro convencional (con marcación GIEMSA) con el análisis multiparamétrico de imágenes, denominándolo como microscopía morfológica cuantitativa (QMM). Se utilizó citometría de flujo (FC) como un método de referencia para determinar el contenido de ADN en eritrocitos diploides y triploides extraídos de truchas arco iris inmaduras (Oncorhynchus mykiss). Además, se aplicó microscopía de fluorescencia cuantitativa (QFM), usando los marcadores de ADN: 4,6-diamidina-2-fenilindol (DAPI), Yoduro de Propidio (PI), y Naranja de Acridina (AO). Nuestros datos muestran que QMM posee una capacidad discriminante comparable o incluso superior a FC o QFM. El método desarrollado ofrece una nueva perspectiva para clasificar objetos microscópicos, con muchas posibles aplicaciones. Key words: triploidization, cytometry, microscopy, image processing. Palabras clave: triploidización, citometría, microscopía, imagen procesada.
INTRODUCTION The economic sitution has forced the salmon industry to maximize production rates, improve fillet quality, and minimize breeding costs. The use of all-female, triploid lines provides advantages in comparison to non-sterile diploid females, male, or sexually mixed populations (Utter et al 1983, Wlasow et al 2004, Friars et al 2001). Female triploid salmons do not develop ovaries, nor do they express the characteristic phenotypic changes of the sexual maturation of the diploid species (Happe et al 1988). Methods for triploidization include the application of high pressure or hyperthermia after the fertilisation procedures. Presently, high pressure treatment is preferred because it yields better triploidization and surviving rates. Since young di- and triploid fishes cannot be distinguished by their phenotypes, triploidization rates are determined on a cellular basis with different protocols (Thititananukij
Aceptado: 07.06.05. * Corresponding author: Dr. Steffen Härtel,
[email protected], Centro de Estudios Científicos (CECS), Arturo Prat 514, Valdivia, Chile, Tel/Fax: (56) + 63 234589/17.
el al 1996, Boron 1994, Child and Watkins 1994, Wattendorff 1986, Ewing and Scalet 1991, Cozier and Moffett 1989, Al-Sabti 1995, Thomas and Morrison 1995). Due to its precision, the reference method for the quantification of the nuclear DNA content is based on fluorescent staining of the cellular chromatin in combination with flow cytometry (FC) (Utter et al 1983). The main disadvantages of FC are high costs and the handling of hazardous DNA binding fluorescent dyes, such as acridine orange (AO), propidium iodide (PI), or 4',6 diamidino-2-phenylindole (DAPI). So far, an easy, preci se, and non-hazardous method for the quantification of triploidization rates has not been developed. Applied methods are based on the fish to fish determination of triploidy in erythrocytes by trained specialists who classify up to 100 samples in order to obtain statistically significant results. In this work we present a microscopic bright field technique for the classification of di- and triploide erythrocytes of O. mykiss. This technique takes advantage of image processing routines in combination with multiple component analysis. The results obtained with quantitative morphologic microscopy (QMM) or quantitative fluorescent microscopy (QFM) are comparable or even superior to the FC-data. QMM substitutes fluorescence 147
S HÄRTEL Y COL
parameters for pure morphologic features of the erythrocyte nuclei which can be contrasted by simple GIEMSA staining procedures. QMM offers a precise, non hazardous, inexpensive, and relatively simple method for classification of di- and triploid erythrocytes of O. mykiss. MATERIAL AND METHODS Triploidization method & collection of blood samples: Triploidization of rainbow trout (Oncorhynchus mikiss, Smith and Stearly 1989) was induced by hyperthermia (28ºC for 10 min), 40 min after fertilisation. Blood samples (1 ml) were collected from immature fishes (350 í 50 g) by piercing the caudal vein. Heparin (Sigma) was added to inhibit blood coagulation. Discrimination of di- and triploid erythrocytes by flow cytometry (FC): Following the method described by Darzynkiewicz et al (1979), 100 ol blood suspension (105 erythrocytes) was mixed with 200 ol of acid detergent (0.1 % Triton X-100, 0.08 N HCl, 150 mM NaCl). After 30 s, 600 ol of the acridine orange (AO) staining solution was added (100 ml contained 1.2 mg AO (Sigma), 29 mg ethylene-diamine-tetra-acetic acid (EDTA), 150 mM NaCl, 0.1 M C6H8O7H2O, and 0.2 M Na2HPO4). All steps were performed in a 0ëC ice water bath. After 10 min, the DNA content of 5000 cell nuclei was determined by FC as described by Ojeda et al (1992). Excitation of DNA bound AO was performed with a 50 mW laser at 488 nm, while the emission intensity was recorded at 515-575 nm for each individual cell. Additionally, side scattering (90ë) and forward scattering were recorded for each cell. The setup of the FC, designed at the Institute of Physics of the Universidad Austral de Chile by Flavio Ojeda, is described in Ojeda et al (1992). Discrimination of di- and triploid erythrocytes by quantitative fluorescence microscopy (QFM): Blood suspensions (5 ol) were pipetted onto different microscopic slides. Erythrocyte nuclei were stained with AO staining solution (see above), propidium iodide (PI) (Molecular Probes, Eugene, OR, USA) staining solution (50 og/ml), or 4',6-diamidino-2-phenylindole dihydro chloride (DAPI) staining solution (50 mg/ml). For AO and PI staining, 5 ol of acid detergent was added to the slides in order to permeabilize the plasma membranes of the erythrocytes. After 5 min, 5 ol of the corresponding staining solutions were added. For DAPI staining, 5 ml staining solution was added directly to the erythrocytes, since the small dye diffuses freely into the chromosomal region. After an incubation time of 10 min, samples were covered with slide covers and observed on a Leica epifluorescence microscope DM LB, equipped with a type A filter set and a CS 50 W-4/L2 lamp for the fluorescent and the bright field mode. Gray scale images (8-bit, 701 ´ 480 pixels) were recorded using a CCD camera (CE, Model OS70D HR, Taiwan) and GrabIT frame grabber soft- and hardware (AIMS Lab., USA). 148
Discrimination of di- and triploid erythrocytes using bright field quantitative morphological microscopy (QMM): Small aliquots of blood samples were spread out on microscopic slides and dried at room temperature. Samples were covered with May Grünwalds solution (SIGMA) for 1 min, covered with aqdest for 3 min, washed with aqdest, covered with GIEMSA solution (SIGMA, 50 ol/ml aq) for 15 min, and washed with aqdest. Finally, samples were covered with cover slides and images were recorded in the bright field mode with the microscopic setup described above. Segmentation and parameterization of erythrocyte nuclei: Interactive routines for cellular image analysis and multivariate data processing (SCIAN) were written in IDL® 5.4 (Interactive Data Language, Research Systems, CO, USA). SCIAN (www.scian.cl) contains a library of different filters which allow the segmentation of complex structures (Fanani et al 2002, Härtel et al 2005), cells (Jessel et al 2002, Härtel et al 2003), or higher biological samples (Alvarez et al 2004/2005). For fluorescent images, threshold segmentation in the intensity-histogram yielded excellent results. For bright field images, either threshold segmentation in the intensity-histogram (figu re 1) or a modified scaling index method (SIM) was applied. SIM was originally introduced by Räth and Morfill (1997) as a pixel-wise non linear transformation. We introduced the weighting vector p in [2] and [3] in order to optimize the segmentation results: α ( xi , yi | r1 , r2 ) ?
log[N (r2 )] − log[N (r1 )] log(r2 ) − log(r1 )
[1]
r N ( xi , yi | r1 ) ? ∑ Θ r1 − pi − p ⋅ 1 p − p i x, y
*
+
r pi − p ⋅ 1 , p − p i N ( xi , yi | r2 ) ? 〈 x , y r ∑ Θ r2 − pi − p ⋅ 2 pi − p , x, y
[2]
∑ Θ*r1 −
+
pi − p ≤ r1
*
+
pi − p @ r1
[3]
Vector p is defined at each picture position (x,y) as p = [x, y, I(x,y)]. Θ Is the Heaviside Function and || the Euclidean Norm. We defined r1 and r2 with 4 parameters [r’1 < r’2, f1 ≤ f2], yielding (r1/2)2 = (r’1/2)2 + (f1/2)2. Σ Is defined for (xi - x)2 + (yi - y)2 ≤ r’2. Nuclei are segmented by selecting a threshold value in the transformed picture α(x,y). Consecutive erosion and dilation operators correct remaining segmentation defects. Debris and nuclei which touch the image borders are removed by morphological filters which identify the pure nuclei population (figure 1b/c). For each segmented nucleus, morphological and intensity dependent parameters were calculated (table 1). Ten pictures containing 1500 to 4500 nuclei were used for QFM and QMM.
TRIPLOIDIZATION, CYTOMETRY, MICROSCOPY, IMAGE PROCESSING
Principal Component Analysis (PCA) of FC-, QFM-, and QMM-data: Fluorescent and morphologic parameters were determined for di- and triploids erythrocyte populations as described above. The parameters Pi of the di- and triploid population were centred and normalised by Pi ' ? * (Pi − P) sd (P)+ . Eigen Values (λ) and Eigen Vectors (V) were calculated for each cell population (table 2). The probability that the members of each cell population are sorted correctly into the corresponding group (a and b) was quantified by discriminating capacities (CD, D = X/X,Y/X,Y,Z for 1/2/3 dimensions, figure 2): *d a + D C D ? ∑ * d a + D ⋅ * d a + D - * d b + D D
[4]
(da/b)D represent normalised density distributions for group a and b. CD becomes 1 for entirely separated density distributions and 0.5 for identical distributions. We further calculated the signal to noise ratios (SNRDI/TRI) of the most discriminant parameters of FC, QFM, and QMM: SNRDI / TRI ?
x DI − xTRI
sd ( x DI / TRI )
[5]
For the classification of unknown cell populations, parameters were transformed into the coordinate system of each calibration set (a and b). Then, the Mahalanobis Distance (MD) (Taguchi and Jugulum, 2002) was calculated for each cell in respect to each coordinate system and the minimum distance criteria min(MDa,MDb) was used to classify the cell into group a or b. MDa,b ?
∑ * P(a,b )i i
λ( a,b )i +
2
[6]
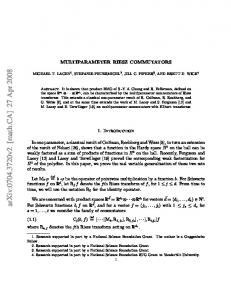
RESULTS Figure 1. Segmentation and morphologic filtering of GIEMSA stained triploid erythrocyte nuclei of O. mykiss. [a] Original image as recorded by the CCD camera (8 bits, 634´428 pixels). [b] White regions are segmented in a fist segmentation step. The inset shows the intensity-histogram of the original image. The selected threshold-interval I(x,y) Î [0, 88] is marked by a bar below the plot. [c] White regions show triploid erythrocyte nuclei after the application of two morphologic filters. Insets show the frequency histograms of the morphologic parameter size (upper histogram) and P≤/A (lower histogram). Selected threshold-intervals are marked by bars below the plots. Triploid nuclei cover an area of 36-80 pixels and provide characteristic P2/A-values between 8-17. Bars in the upper right corner of the images scale 25 om. Segmentación y filtrado morfológico de núcleos de eritrocitos triploides de O. mykiss. [a] Imagen original digital (8 bits, 634x428 píxeles). [b] Estructuras segmentadas marcadas en blanco después del primer paso de segmentación. El histograma interior muestra las frecuencias de las intensidades de la imagen original. El umbral seleccionado I(x,y) ε [0, 88] para la segmentación está marcada con una barra. [c] Estructuras marcadas en blanco muestran los núcleos de eritrocitos después de la aplicación de dos filtros morfológicos. Los histogramas interiores mues tran el filtro del tamaño del parámetro morfológico (recuadro superior) y P2/A (recuadro inferior). Los histogramas contienen los umbrales usados para filtrar estructuras perinucleares.
Segmentation of erythrocyte nuclei of O. mykiss from digital images was achieved in the bright field mode and in the fluorescent mode of the microscopic setup. Figure 1 shows the basic steps of a representative segmentation of GIEMSA-stained triploid nuclei which are also valid for the segmentation of diploid nuclei (results not shown). First, a threshold-interval is selected interactively in the intensity-histogram of the digital image (figure 1a and 1b, inset). The segmented regions of interest (white pixels in figure 1b) include erythrocyte nuclei, but also cellular debris and membrane residues. Two morphologic filters based on object size and circularity (shape sensitive parameter P2/A, see table 1) separate the nuclei from the undesired structures (figure 1c). The insets of figure 1c show that cellular debris and membrane residues are smaller and less circular (high P2/A-values) than the nuclei. 149
S HÄRTEL Y COL
Table 1. Morphological, texture, and fluorescence dependent parameters available in SCIAN for the classification of segmented objects in digital images (figure 1c). Parámetros dependientes de morfología, textura y fluorescencia dentro de SCIAN para la clasificación de objetos segmentados en imáge nes digitales (figura 1c).
Morphology, Texture, and Fluorescence Dependent Parameters: Size (A).
Number of pixels identifying each erythrocyte nuclei.
Perimeter (P) of the trajectory of the object boundary.
Boundary pixels (4-connected contour, Young et al 1997) of the nuclei were translated into chain code according to Freeman (1979). Boundary length was then determined according to Vossepoel (1982).
P2/A.
Dimensionless, zoom, and rotation invariant circularity parameter.
Minimum border distance (D) and D.
D ? ⋅∑ d min i and D ?
A
i?1
1 A ⋅ ∑ dmin i , A i ?1
|dmin| is the minimum Euclidean Distance between each pixel of an object and its nearest boundary pixel (Danielson, 1978). Boundary energy (EC). Normalized boundary energy (EC).
2 EC ? ∫ K ( p) dp and E C ?
1 2 K ( p) dp were introduced by Young et al. (1974). ∫ P
K ( p) ? 1 r( p) is the curvature, and r(p) is the radius of the curvature of the boundary trajectory p.
Number of turning points (2nd_d) and 2nd_d.
Turning points of the boundary trajectory can be identified when K(p) = 0 and the circle touching the trajectory tangentially, switches the side of the boundary. 2nd d, is the number of turning points for each boundary trajectory and 2nd_d is the ratio 2nd_d / P.
Fluorescence intensity (I) and fluorescence density (I’).
I?
Normalised translation and rotation invariant moments (o’jk) and (Io’jk).
o' jk ?
Eccentricity (Ecc) and I-Eccentricity (I-Ecc).
∞ ∞
∞ ∞
−∞ −∞
−∞ −∞
∫
∫ I ( x' , y' )dx' dy' , and I' ? 1 A ⋅ ∞ ∞
∫ ∫ (x' − x)
j
−∞ −∞
⋅ ( y' −y) k ⋅ f ( x' , y' )dx' dy' . Were calculated for each nucleus after
transformation on its principal axis and in relation to its centre of gravity (Castleman 1996). For morphological invariant moments o’ of order jk, f(x’,y’) is set to 1. For texture or fluorescence invariant moments Io’, f(x’,y’) is set to the intensity value I(x’,y’) of the fluorescent or of the bright field picture. Moments up to the 5th order were calculated.
( I − ) Ecc ?
( I )o' 20
( I )o' 02 , were (I)o’ are the invariant second order normalised moments
(Gonzales and Woods 2002).
Morphological and intensity dependent parameters of segmented nuclei were calculated and the data were analysed by multi-parameter techniques (table 1 and 2, figure 2). As figure 2 shows, di- and tri-ploid (*) erythro cyte populations were separated by FC (figure 2a), QFM (figure 2b), and QMM (figure 2c). The results are plotted in bivariate histograms with area normalised density distributions. All three methods clearly distinguish between the diploid and the triploid erythrocyte population. The corresponding CD-values were calculated for 1-, 2-, and 3-dimensions and plotted next to each
150
∫ ∫ I ( x' , y' )dx' dy'.
histogram. The CX-values are highest for the FC-data (AO intensity), followed by the QMM-data (area), and the QFMdata (DAPI-intensity). For QFM, staining with DAPI, PI, or AO yielded comparable results (not shown). For the 2 and 3-dimensional analysis, the CD-values are almost identical. The calculation of the SNR with respect to the most discriminant parameters yielded: SNRDI/TRI = 4.5/3.1 (AO-intensity for FC), SNRDI/TRI = 2.5/2.1 (DAPI-intensity for QFM), and SNRDI/TRI = 4.0/2.0 (area for QMM). Additional insight in the interdependence between the parameters is obtained by multi parameter analysis of the
TRIPLOIDIZATION, CYTOMETRY, MICROSCOPY, IMAGE PROCESSING
Table 2. Principal component analysis of FC-, QFM-, and QMM-data. The first row contains the correlation coefficients (r) between the X-, Y-, and Z-axis parameters used to calculate the discriminating capacities CD in figure 2. The second row contains r calculated for the intensity dependent and pure morphological parameters of the QFM-data. The third row contains parameter groups (A-M) formed by parameters with r > 0.95 of the QMM-data. The last row contains the participation of these parameter groups (A-M) in the composition of the first three principal axis (Eigen Vectors). For the first three principal axes, the Eigen Values (li) represent the importance of each axes for the calculation of the Mahalanobis Distance. Análisis de componentes principales para datos de FC, QFM y QMM. La primera fila contiene los coeficientes de correlación (r) entre los ejes X, Y y Z, utilizados en calculo de la capacidad discriminatoria CD en la figura 2. La segunda fila contiene r calculado a partir de parámetros dependientes de la intensidad y parámetros puramente morfológicos obtenidos por QFM. La tercera fila agrupa parámetros obtenidos por QMM que presentan un r > 0,95 (A-M). La ultima fila contiene el porcentaje de participación de estos grupos (A-M) en la composición de los primeros tres ejes principales (Auto Vectores). Para los primeros tres ejes principales los Auto Valores (λi) representan la importancia de cada eje en el cálculo del criterio de la mínima distancia según Mahalanobis.
Correlation coefficient (r) between X-/Y-/Z-axis parameters, figure 2
FC
QFM
QMM
X/Y: r = 0.5837 X/Z: r = 0.0723 Y/Z: r = 0.3594
X/Y: r = 0.3637 X/Z: r = 0.1944 Y/Z: r = 0.1749
X/Y: r = 0.0545 X/Z: r = 0.3443 Y/Z: r = 0.1124
QFM
Correlation coefficient (r) between intensity dependent and morphological parameters
Diploid cells
Triploid cells
I/A: r = 0.998 I/D: r = 0.985 I/P: r = 0.963 I-Ecc/Ecc: r = 0.997
I/A: r = 0.998 I/D: r = 0.969 I/o’22: r = 0.964 I-Ecc/Ecc: r = 0.998 QMM
Diploid cells
Triploid cells
[o’22 ], [o’44 ] ____ EC, EC, 2nd_d, 2nd_d [o’04 ] D A D [o’40 ] [o’03 ], [o’05 ] [o’33 ], [o’55 ] [o’30 ], [o’50 ] Ecc P2/A P
A: B: C: D: E: F: G: H: I: J: K: L: M:
Groups formed by the morphologic parameters with correlation coefficients r > 0.95
A: B: C: D: E: F: G: H: I: J: K: L: M:
Participation of the parameter groups A-M in the 1st, 2nd, and 3rd principal axes together with the size of the Eigen Values (λ) of each axis in relation to the sum of all λs
1st axis, λ1 = 0.42: A: 16.8%, C: 11.9%, E: 16.3%, F: 15.2%, M: 16.4% 2nd axis, λ2 = 0.2: G: 10.0%, H 11.1%, K: 28.4%, L: 25.9% 3rd axis, λ3 = 0.1: I: 50.3%, J: 48.9%
FC-, QFM-, and QMM-data (table 2). The correlation coefficients (r) between the X-, Y-, and Z-axis parameters (figure 2) are plotted in the first row of table 2. The correlation coefficient for the X/Y-axis of the FC-data is higher than the correlation coefficients of the QFM- and the QMM-data. This explains why the CXY-values for the
A, D, [o’22 ], [o’44 ] EC, EC [o’04 ] D 2nd_d, 2nd_d [o’33 ] [o’40 ] [o’03 ], [o’05 ] [o’55 ] [o’30 ], [o’50 ] Ecc P2/A P
1st axis, λ1 = 0.38: A: 17.1%, C: 15.5%, G: 12.8%, M: 18.0% 2nd axis, λ2 = 0.16: F: 42.9%, I: 43.1% 3rd axis, λ3 = 0.14: B: 11.5%, D: 14.0%, E: 15.8% K: 26.7%, L: 12.0%
QFM- and the QMM-data finally vary little from the CXY value of the FC-data, although the CX- and the CY-values of the FC-data are higher than the corresponding values for the QFM- and the QMM-data. The second column of table 2 shows the correlation coefficients calculated between fluorescence intensity-dependent parameters (I 151
S HÄRTEL Y COL
side scattering
FC data:
X-axis: AO-intensity
Y-axis: side-scattering at 90º (Z-axis: forward-scattering) Discriminative capacities CD: CX: 0.9395 CY: 0.7365 CZ: 0.5273 CXY: 0.9598 CXYZ: 0.9755
AO-intensity [a.u.]
I-eccentricity
QFM data:
X-axis: DAPI-intensity
Y-axis: I-eccentricity (I-Ecc) (Z-axis: Io’[0,3]) Discriminative capacities CD: CX: 0.8653 CY: 0.6555 CZ: 0.614 CXY: 0.9542 CXYZ: 0.99
DAPI-intensity [a.u.]
Eccentricity
QMM data: X-axis: area (A) Y-axis: eccentricity (Ecc) (Z-axis: o’[0,3]) Discriminative capacities CD: CX: 0.9059 CY: 0.5475 CZ: 0.5560 CXY: 0.9629 CXYZ: 0.9857
area [pixel]
Figure 2. Comparison of FC [a], QFM [b], and QMM [c] based multi parameter analysis of di- and triploid erythrocyte nuclei of O. mykiss. Bivariate histograms show area normalised density distributions with contour lines. Triploid nuclei are marked by *. The maximal density in each histogram is set to the maximal grey level of the colour bars at the top of each plot. Densities were calculated in 86 intervals for each dimension. At the right side of each plot, the CD-values are listed for the most discriminant parameters in X, Y, and Z (Z-axis not shown in the plots). Comparación entre los parámetros obtenidos por FC [a], QFM [b] y QMM [c]. Los histogramas bivariatos contienen líneas de contorno para las poblaciones de eritrocitos di- y triploides (*). La den sidad máxima en cada histograma fue escalada con el valor máximo de gris según la escala en el margen superior de cada gráfico. Las densida des fueron determinadas en 86 intervalos en cada dimension. Las capa cidades de discriminación (CD) para los ejes X, Y, y Z (no graficado) se indican a la derecha.
and I-Ecc) and pure morphological parameters (A, P, D, o’22, and Ecc) of the QFM-data. Since r-values are close to one, fluorescence dependent parameters can be substituted by pure morphological parameters; the latter can be obtained by ordinary light microscopy and QMM. The third column of table 2 shows the interdependence among fluorescence intensity independent parameters extracted for GIEMSA-stained erythrocytes with QMM. Parameter groups (A-M) with r > 0.95 are formed in order 152
to reduce the dimensions of the matrix for PCA-analysis to 13 x 13 (grouped parameters contain redundant information). PCA can be applied to the QMM-data since the extracted parameters yield a gauss-like distribution. Due to the different nuclear morphology, parameter groups formed by the diploid cell population differ in part from the groups formed by the triploid set. In consequence, the compositions of the first three principal axes which result from the PCA (table 2, bottom) are similar but not identical for the di- and the tri-ploid erythrocyte populations (only parameter groups with a participation > 10% were plotted). For both erythrocyte populations, the calculated Eigen Values (λ) for the first principal axis (λ1) are more than twice as high as those for the second principal axis (λ2). The ratio of the standard deviation ( sd ? λ ) of the diploid nuclei in relation to the first two principal axis λ1 λ 2 ? 1.47 defines the relative importance of the major in respect to the minor principal axis for the classification of sample erythrocytes. This outlines the advantage of the Mahalanobis Distance over the simple Euclidean Distance: The weights compensate for the nonhomogeneous distributions of the cellular parameters in relation to each principal component. Accordingly, the Mahalanobis Distance represents a reliable measure for the classification of unknown objects into well-known populations. DISCUSSION In 1991 Kamentsky and Kamentsky reported that quantitative cytomeric data obtained with fluorescence microscopy is comparable to data obtained with FC. Many different applications have emerged since then which take advantage of quantitative fluorescence microscopy or quantitative morphological microscopy, QFM or QMM (e.g. Fanani et al 2002, Härtel et al 2003/2005, Alvarez et al 2004/2005). As we report here, the relative DNA content of erythrocytes of O. mykiss can be quantified with FC (AO-staining) or QFM (AO-, DAPI-, or PI staining). The discriminating capacities CD indicate that the relative DNA content in erythrocytes can be determined by QFM with a precision close to the FC-data (the reference method in quantitative cytometry). Unfortunately, determination of morphological parameters with FC is not reliable; side- and the forward-scattering of the laser beam resemble surface properties or the dimension of the objects in a very rough manner. As we show, the correlation coefficients between the parameters of the FC-data are higher than the coefficients of the QFM or QMM-data, and we observe that the CXY- and CXYZ values for QFM and QMM catch up to or are even greater than the FC-data. In consequence, the strength of the image processed microscopic methods QFM and QMM lies in the precise determination of more than one parameter coupled to the fluorescence (QFM) or to the morphology (QMM) of objects.
TRIPLOIDIZATION, CYTOMETRY, MICROSCOPY, IMAGE PROCESSING
To our surprise, the integral fluorescence intensities of the di- and triploid erythrocyte nuclei correlate almost perfectly with basic morphologic properties (r > 0.99 for I and A). The correlation between the relative DNA content and the nuclear size suggests a homogeneous packing of the chromatin inside the nuclear membrane. In consequence, the relative DNA content in erythrocytes can be estimated indirectly by the size of the nuclei. This conclusion reveals why cell size and morphology have been used as discriminant parameters for the identification of di- and triploid salmon populations (Phillips et al 1986, Wlasow et al 2004). In addition to the correlation between relative DNA content and the nuclear size, further intensity coupled parameters can be substituted by their morphologic counterparts (r > 0.99 for I-Ecc and Ecc). Since morphologic parameters are calculated directly from the binary mask of the objects, fluorescence staining of the nuclei becomes unnecessary and can be substituted by simple, inexpensive, and non hazardous contrast staining procedures like GIEMSA in combination with bright field microscopy. For the morphological discrimination between erythrocyte populations with QMM, size, eccentricity (a measure for circularity), and invariant moments were shown to be the most accuratet parameters (table 2, figure 2). This result is supported by the visual impression: diploid nuclei are small and circular in comparison to the curved, bean-like triploid nuclei; see Small and Benfey (1987) for diploid erythrocytes and figure 1 or Wlasow et al (2004) for triploid samples. Without PCA, visual multi-parameter analysis becomes a difficult task when more than two parameters are considered. For n parameters, n(n-1)/2 two-dimensio nal histograms have to be monitored in order to find an optimal representation. With increasing n, the task becomes time- consuming if not impossible. As shown, QMM in combination with PCA performs excellent feature extraction for di- and triploid erythrocyte populations (table 2, bottom). PCA bundles redundant information and reduces the dimension of the parameter space to a minimum. Besides PCA, alternative methods like principal component regression, partial least square regression, and artificial neuronal networks have been tested by Davey et al (1999) for FC classification of different micro-organism with up to 7 parameters. The authors reported that artificial neuronal networks provided the best discriminating capacities in most experiments. For QMM, we preferred PCA in combination with the Mahalanobis Distance, because it presents a very clear classification criterion. In conclusion, QMM can quantify triploidization rates in rainbow trout in a reliable, fast, and innovative way. The results are comparable or even superior to the existing reference method, FC. Since di- and tri-ploid rainbow trout do not show significant variations of erythrocyte density in the blood (data not shown), aliquots of blood samples
can be mixed into a single sample. This way, the time and cost-intensive analysis of many individual blood samples can be reduced to a single step. The developed method opens a perspective for the classification of microscopic objects with many possible applications. ABSTRACT Growing international competition is forcing salmon farmers to incorporate innovative techniques into the production process. The use of triploid, all-female breeding populations offers multiple advantages over diploid populations. Currently, an exact, simple, and non- hazardous method for the quantification of diploid- and triploid salmon erythrocytes does not exist. We present a method that combines a standard microscopic bright field technique (contrast staining with GIEMSA) with multi parameter image analysis and termed it quantitative morphologic microscopy (QMM). We used flow cytometry (FC) as the reference method to determine the DNA content of di- and triplod erythrocytes from immature rainbow trout (Oncorhynchus mykiss). Additionally, we applied quantitative fluorescence microscopy (QFM), using the DNA stains 4',6-diamidino-2 phenylindole (DAPI), propidium iodide (PI), and acridine orange (AO). Our data show that QMM possess comparable or even superior discriminating capacities than FC or QFM. The developed method opens a perspective for the classification of microscopic objects with many possible applications.
ACKNOWLEDGEMENTS S.H. is supported by Fondecyt 3030065 (Chile). Institutional support of the Centro de Estudios Científicos (CECS) from Empresas CMPC is gratefully acknowledged. CECS is a Millennium Science Institute and is funded in part by grants from Fundación Andes and the Tinker Foundation. RR thanks the DAAD, the University of Bremen, and the Universidad Austral de Chile for a travel-funds. C.R. thanks the DLR for financial support. O.G. thanks DID-UACH 160404-01/EN for financial support.
REFERENCES Al-sabti K. 1995. Detection of triploidy in fish using the cytokinesis-blocked method for erythrocyte and hepatic cells. Cytobios 82, 181-187. Alvarez M, R Godoy, W Heyser, S Härtel. 2004. Surface bound phosphatase activity in living hyphae of ectomycorrhizal fungi of Nothofagus obliqua. Mycologia 96, 479-487. Alvarez M, R Godoy, W Heyser, S Härtel. 2005. Anatomical physiological determination of surface-bound phosphatase activity in ectomycorrhiza of Nothofagus obliqua based on image processed confocal fluorescence microscopy. Soil Biol Biochem 37, 125-132. Boron A. 1994. Use of erythocyte measurements to detect natu ral triploids of spined loach Cobitis taenia (L.). Cytobios 78, 197-202. Castleman K R. 1996. Digital Image Processing. Prentice Hall, Englewood Cliffs, NJ, USA. Cozier W W, I J Moffett. 1989. Application of an electrophoretically detectable genetic marker to ploidy
153
S HÄRTEL Y COL
testing in brown trout (Salmo trutta L.) triploidized by heat shock. Aquaculture 80, 231-239. Child A R, H P Watkins. 1994. A simple method to identify triploid molluscan bivalves by the measurement of cell nucleus diameter. Aquaculture 125, 199-204. Danielson P E. 1978. A New Shape Factor. Comp Image Process 7, 292-299. Davey H M, A Jones, A Shaw, D Kell. 1999. Variable selection and multivariate methods for the identification of micro organisms by flow cytometry. Cytometry 35, 162-168. Ewing R R, C G Scalet. 1991. Flow-cytometric identification of larval triploid walleyes. Progress in fish culture 53, 177-180. Fanani M L, S Härtel, R G Oliveira, B Maggio. 2002. Bidirectional control of sphingomyelinase activity and surface topography in lipid monolayers. Biophys J 83, 3416-3424. Friars G W, I McMillan, V M Quinton, F M Oflynn, S A McGeachy, T J Benfey. 2001. Family differences in relative growth of diploid and triploid Atlantic salmon (Salmo salar L.). Aquaculture 192, 23-29. Happe A, E Quillet, B Chevassus. 1988. Early life history of triploid rainbow trout (Salmo gairdneri Richardson). Aquaculture 71, 107-118. Härtel S, M Zorn-kruppa, S Tikhonova, P Heino, M Engelke, H Diehl. 2003. Staurosporine-induced Apoptosis in Human Cornea Epithelial Cells in Vitro. Cytometry 08, 15-23. Härtel S, M L Fanani, B Maggio. 2005. Shape transitions and lattice structuring of ceramide-enriched domains generated by sphingomyelinase in lipid monolayers. Biophys J 88, 287-304. Gonzales R C, R E Woods. 2002. Digital Image Processing. Addison-Wesley, MS, USA. Jessel R, S Härtel, C Socacio, S Tykhonova, H Diehl. 2002. Kinetics of apoptotic markers in exogeneously induced apoptosis of EL4 cells. J Cell Mol Med 6, 82-92. Kamentsky L A, L Kamentsky. 1991. Microscope-based multi parameter laser scanning cytometer yielding data compara ble to flow cytometry data. Cytometry 12, 381-387.
154
Ojeda F, M I Guarda, C Maldonado, H Folch. 1992. A flow cytometric method to study DNA fragmentation in lymphocytes. J Immunol Methods 152, 171-176. Phillips R B, K D Zajicek, P E Ihssen, O Jonson. 1986. Application of silver staining to the identification of triploid fish cells. Aquaculture 54, 313–319. Räth C, G Morfill. 1997. Texture detection and texture discrimination with anisotropic scaling indices. J Optical Soc Amer 14, 171-176. Small S A, T J Benfey. 1987. Cell size in triploid salmon. The J Exp Zool 241, 339-342. Taguchi G, R Jugulum. 2002. The Mahalanobis-Taguchi Strategy. Wiley, New York, USA. Thomas P, R Morrison. 1995. A method to assess triploidy in swim-up rainbow trout. Aquaculture 9, 62-63. Thititananukij S, R Vejaratpimol, T Pewnim, A W FAST. 1996. Ethidium bromide nuclear staining and fluorescence microscopy: An alternative method for triploidy detection in fish. J World Aquac Soc 27, 213-217. Utter F M, O W Johnson, G Thorgaard, P S Rabinovitch. 1983. Measurement and potential applications of induced triploidy in pacific salmon. Aquaculture 35, 125-135. Wlasow T, H Kuzminski, P Woznicki, E Ziomek. 2004. Blood Cell Alteration in Triploid Brook Trout Salvelinus fontinalis (Mitchill) Acta Vet Brno 73, 115-118. Wattendorff R J. 1986. Rapid identification of triploid grass carp with a Coulter Counter and Channelyzer. Prog Fish Cult 48, 125-132. Young I T, J E Walker, J E Bowie. 1974. An Analysis Technique for Biological Shape. Inf Control 25, 357-370. Young I T, J J Gerbrands, L J Van Vliet. 1997. Fundamentals of Image Processing, Cip-Data-Koninklijke Bibliotheek Den Haag, ISBN 90-75691-01-7, 19-32.