Diagnostic and prognostic signatures from the small non-coding RNA ...
Recommend Documents
Sep 2, 2014 - Nasopharyngeal Carcinoma and Their Prognostic Value ... Nasopharyngeal Carcinoma, Sun Yat-Sen University Cancer Center, 651 Dongfeng ...
Oct 26, 2010 - Envelope Reverse 1 (SER1), and SARS Spike Reverse 4 (SSR4) and those with primers designed for mouse 18S gene using the same strains ...
H19, but also RB1-E2F1 function and β-catenin activity as essential upstream ... the relevance of H19-macroH2A interaction in CDK8 regulation remains to be ...
Apr 21, 2017 - Many long noncoding RNAs (lncRNAs) are deregulated in cancer and ...... were classified into non-basal like and basal-like according to Earl et ...
... of Rochester, Rochester, New York 14627, USA; 3Department of Chemistry and Center for Research ... Supplemental material is available at http://www.genesdev.org. .... Mics and the parental Mac are destroyed (5); and cells resume.
1A [stage 5], J,K). Then, it disappeared before DNA elimination occurred. (â¼14 h post-mixing) (Fig. 1L). Similar transitions of local- ization from the old Mac to the ...
Feb 2, 2018 - Multivariate cox regression analyses revealed that the RRS is an ... nosed cancer and the arch-criminal of cancer death among women. ... cases will occur, and 40,610 of them will die in 2017, accounting for 30% of new cases ...
May 23, 2013 - Breast Surgery, Sun Yat-sen Memorial Hospital, Sun Yat-sen University, Guangzhou 510120, China, 3 Medical Research Center Sun Yat-Sen ...
Aug 31, 2016 - EVs were isolated from cell culture media using the Total Exosome ..... Proteomics, transcriptomics and lipidomics of exosomes and ecto-.
Jan 20, 2016 - 1RNA Biology Group, Institute for Molecular Infection Biology (IMIB), University of Wu¨ rzburg, Josef-Schneider-Strasse 2, 97080 Wü rzburg,.
Apr 24, 2009 - ming in humans and other complex organisms. However, ..... bodies. Antisense and siRNA knockdown. [218]. SCA8. Predicted gene product ...
terization of a novel small non-coding RNA: NrsZ ... Environmental Microbiology published by Society for Applied Microbiology and John Wiley & Sons Ltd.
Oct 17, 2012 - Abstract. Background: Small RNAs have proven to be essential regulatory molecules encoded within eukaryotic genomes. These short RNAs ...
Oct 17, 2012 - James Lindsay, Dawn M. Carone, Judy Brown, Laura Hall, Sohaib Qureshi, Sarah E. ..... ted to that gene, but is not a proxy for the quantitative.
Sep 5, 2013 - a double-stranded miRNA molecule. ... target of the miRNA, miRNAs do not have a high specificity for their ... of siRNA-mediated mRNA degradation, based on the observation that ... suggesting the cooperation between mir-17-19b and c-Myc
Sep 29, 2013 - Ismael A Vergara4, Elai Davicioni4, Nicholas Erho4, Mercedeh Ghadessi4, Robert B Jenkins5, Timothy J Triche4, ...... Pflueger, D. et al. ... Trapnell, C., Pachter, L. & Salzberg, S.L. TopHat: discovering splice junctions with.
Nov 19, 2018 - Vasculogenic mimicry (VM) gives rise to tumor neovascularization that is ... reproduction in any medium, provided you give appropriate credit to ...
Aug 13, 2018 - (2014) 142(1):32â8. doi:10.1111/imm.12227. 35. Xin J, Li J, Feng Y, Wang L, ... 1155â67. doi:10.1158/0008-5472.CAN-16-1508. 37. Michalik ...
Feb 15, 2017 - many highly-connected genes, including XLOC_058593, BMP3, MYOD1, and LAMP3. This study provides a valuable resource for chicken ...
Aug 26, 2013 - Minghui Zhu,1 Guoyong Chen,1 WeiWei Wang,1 Fred G. Biddle,4 and Jianqin Gu3. 1 Clinical Research Center, People's Hospital of ...
Jin et al (10) suggested that ..... Liu and Xiao (24) reported that hypoxia promotes hypoxia inducible ..... Zhang C, Liu J, Jin N, Zhang G, Xi Y and Liu H: SiRNA.
stage of the lymph nodes. The patients with non-small cell lung cancer. (NSCLC) stage IIIA (invasion of mediastinal lymph nodes â N2+) represent a heterogenic ...
Diagnostic and prognostic signatures from the small non-coding RNA ...
Jul 18, 2011 - 2012 Macmillan Publishers Limited All rights reserved 0950-9232/12 www.nature.com/ .... cancer group in a pairwise fashion. From these, 80.
Oncogene (2012) 31, 978–991
& 2012 Macmillan Publishers Limited All rights reserved 0950-9232/12 www.nature.com/onc
ORIGINAL ARTICLE
Diagnostic and prognostic signatures from the small non-coding RNA transcriptome in prostate cancer ES Martens-Uzunova1,5, SE Jalava2,5, NF Dits1, GJLH van Leenders3, S M ller4, J Trapman3, CH Bangma1, T Litman4, T Visakorpi2 and G Jenster1 1 Department of Urology, Josephine Nefkens Institute, Erasmus MC, Rotterdam, The Netherlands; 2Institute of Medical Technology, University of Tampere and Tampere University Hospital, Tampere, Finland; 3Department of Pathology, Josephine Nefkens Institute, Erasmus MC, Rotterdam, The Netherlands and 4Exiqon A/S, Vedbaek, Denmark
Prostate cancer (PCa) is the most frequent male malignancy and the second most common cause of cancer-related death in Western countries. Current clinical and pathological methods are limited in the prediction of postoperative outcome. It is becoming increasingly evident that small non-coding RNA (ncRNA) species are associated with the development and progression of this malignancy. To assess the diversity and abundance of small ncRNAs in PCa, we analyzed the composition of the entire small transcriptome by Illumina/ Solexa deep sequencing. We further analyzed the microRNA (miRNA) expression signatures of 102 fresh-frozen patient samples during PCa progression by miRNA microarrays. Both platforms were cross-validated by quantitative reverse transcriptase–PCR. Besides the altered expression of several miRNAs, our deep sequencing analyses revealed strong differential expression of small nucleolar RNAs (snoRNAs) and transfer RNAs (tRNAs). From microarray analysis, we derived a miRNA diagnostic classifier that accurately distinguishes normal from cancer samples. Furthermore, we were able to construct a PCa prognostic predictor that independently forecasts postoperative outcome. Importantly, the majority of miRNAs included in the predictor also exhibit high sequence counts and concordant differential expression in Illumina PCa samples, supported by quantitative reverse transcriptase–PCR. Our findings provide miRNA expression signatures that may serve as an accurate tool for the diagnosis and prognosis of PCa. Oncogene (2012) 31, 978–991; doi:10.1038/onc.2011.304; published online 18 July 2011 Keywords: prostate cancer; microRNA; microarray; deep sequencing; Q–PCR
snoRNA;
Correspondence: Dr G Jenster, Department of Urology, Josephine Nefkens Institute, Erasmus MC, Room Be362a, PO Box 2040, 3000 CA Rotterdam, Holland, The Netherlands. E-mail: [email protected] 5 These authors contributed equally to this work. Received 17 January 2011; revised 16 May 2011; accepted 7 June 2011; published online 18 July 2011
Introduction Prostate cancer (PCa) is the most common malignancy and the second cancer-related cause of death among Western men (Ferlay et al., 2007). Fatal outcome from PCa is generally preceded by local tumor infiltration beyond the prostate and metastasis to lymph nodes. Although a majority of PCa patients are diagnosed with curable, organ-confined disease, more than a quarter of them experience a relapse within 5 years after surgery (Wright and Simon, 2003). Owing to their heterogeneous character, it is difficult to distinguish indolent from more-aggressive prostate neoplasms (Marberger, 2009). Accurate identification of patients with an increased risk of postsurgical PCa recurrence is of major importance for the determination of adequate adjuvant therapy. Current prediction models are based on standard clinical variables like preoperative prostatespecific antigen, Gleason score and pathologic stage. However, their performance is unsatisfactory regarding preoperative evaluation of treatment choice and postsurgical clinical outcome. A better understanding of the biologic mechanisms of PCa formation and progression is crucial for the discovery of new markers for this disease. In recent years, it has become apparent that different non-coding RNAs (ncRNAs) are also implicated in PCa. Several microRNAs (miRNAs) are now associated with the progression and classification of this and other malignancies (Lu et al., 2005; Volinia et al., 2006; Porkka et al., 2007; Shi et al., 2007; Ozen et al., 2008; Prueitt et al., 2008; Tong et al., 2009). Evidence is accumulating that small nuclear RNA and small nucleolar RNA (snoRNA) are also employed in cis and trans gene regulation and alternative splicing besides their established function in ribosomal RNA modification (Reis et al., 2004; Mattick and Makunin, 2006; Dong et al., 2008; Ender et al., 2008). Nevertheless, the assessment of the complete small ncRNA transcriptome involved in the formation and differentiation of different types and subtypes of PCa has remained a challenge. In this study, we examined the expression of the entire small transcriptome in PCa using Illumina/Solexa deep sequencing. We further analyzed the expression signature of 4700 mature miRNA species during progression
The small transcriptome of prostate cancer ES Martens-Uzunova et al
979
of PCa disease by Agilent microarrays and were able to derive differential miRNA expression profiles strongly associated with PCa diagnosis and clinical outcome. A selected subset of miRNAs was further used to crossvalidate both platforms by quantitative real-time–PCR (Q–PCR).
Results Dynamics of the small transcriptome in PCa We used Illumina/Solexa deep sequencing to examine the ncRNA content in two PCa small RNA libraries: organ-confined PCa and metastatic lymph node PCa (LN-PCa). Both sequencing reactions yielded 5 547 066 unfiltered sequence reads, for PCa and 4 915 053 for LN-PCa. For PCa, 4 517 214 (81%) reads were mapped to 545 900 individual loci in the human genome. For LN-PCa, 3 524 014 (78%) reads were mapped to 395 281 individual loci. Identified loci were further classified as known miRNA, snoRNA, small nuclear RNA, ribosomal RNA, tRNA, fragments of large ncRNA, genomic repeats, mRNA and other hairpins originating from yet un-annotated genomic regions (Supplementary Table S1). MiRNAs were the most abundant RNA detected, comprising approximately 95% of the total RNA pool.
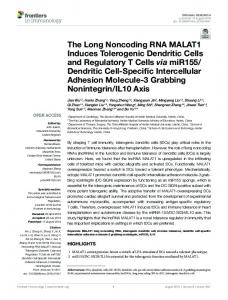
We were able to identify 725 mature miRNA species deriving from 427 known human stem-loop sequences (miRBase 12.0). Furthermore, 20 candidate miRNA sequences originating from novel genomic miRNA-loci were discovered (Supplementary Table S2). These loci correspond to novel miRNAs with very low sequence counts. In addition, two miRNAs homologous to the known rat rno-mir-320 and mouse mmu-mir-449c were detected. The overall expression of miRNA species was relatively decreased in LN-PCa as demonstrated by the noticeably lower total sequence count of miRNAs in LN-PCA (3 278 482) compared with PCa (4 232 318) (Supplementary Table S1). Strikingly, the opposite tendency was observed for sequenced fragments mapped to tRNA and snoRNA loci. The total count of tRNA and snoRNA fragments was increased 420% in LN-PCa compared with PCa. tRNA fragment levels were elevated from 58 224 to 84 709 total sequence counts, while snoRNA fragments had corresponding total sequence counts of 16 762 and 20 569, in the PCa and LN-PCa samples, respectively. Similarly, the diversity of detected snoRNA species was increased in the LN-PCa library. A search with the mapped sequences from both sample libraries against known snoRNAs identified 112, and 158 unique snoRNA loci encoding either C/D-box or H/ACA box snoRNAs (Figure 1a). This global pattern of differential expression was also observed on
Figure 1 Deep sequencing analysis of differentially expressed small ncRNAs in organ-confined and metastatic PCa. (a) Number of ncRNA species per sample pool. (b) Differentially expressed small RNAs between organ-confined PCas and metastatic LN-PCa libraries. We compared the fold change difference in the count number of sequences mapped to the same mature small nuclear RNA in PCa and LN-PCa libraries. Sequences were considered differentially expressed when the fold change in sequence counts between the tested conditions was more than four. Plotted are the log2 transformed count frequencies of each individual ncRNA in the LN-PCa library (log2 LN-PCa) and the PCa library (log2 PCa). Colored are small RNAs with a fold change bigger than four. In red—miRNA; blue—snoRNA; green—tRNA; gray—ncRNAs with a fold change o4. Only names of miRNA tested by TaqMan Q-reverse transcriptase–PCR are indicated. Oncogene
The small transcriptome of prostate cancer ES Martens-Uzunova et al
980
the level of individual small ncRNAs. Only 19 miRNAs were found to be upregulated in metastatic lymph node compared with PCa, while 69 were downregulated. Although the majority of differentially expressed ncRNAs species in PCa were miRNA, in the LN-PCa the most abundant ncRNA species were sno- and tRNAs (Figure 1b, Supplementary Table S3). Mature tRNA have a size of approximately 75 nucleotides (nt), while snoRNAs range in size from 70 to 200 nt depending of their class (C/D box or H/ACA box) and cellular function (guiding of RNA methylation or pseudourydilation). The majority of sequence reads mapped to snoRNA in both sequencing libraries had a size of 22–23 nt similarly to miRNA (Supplementary Figure S1). Most tRNA-derived fragments identified in the PCa library had a size of B18 nt, while in LN-PCa library a peak in the size range of 27 nt was observed, indicating different processing of tRNA in LN-PCa (Supplementary Figure S1). To assess whether the relative downregulation of miRNAs observed in the LN-PCa sample is mediated by alterations in the miRNA processing pathways, we examined the expression of the miRNA processing enzymes Drosha and Dicer in each one of the samples used for the generation of our deep sequencing libraries by Q–PCR. No significant change in the expression levels of these enzymes was found between PCa and LNPCa (Supplementary Figures S2a and b). This result was further confirmed by the analysis of an extended sample cohort consisting of 60 PCa and 16 LN-PCa samples (Supplementary Figures S2c and d). Transcriptional profiling of the miRNA transcriptome Class discovery of miRNAs associated with PCa. To examine changes in expression of individual miRNAs that may be relevant to the occurrence and progression of clinically significant PCa, we performed miRNA microarray analysis on a patient cohort consisting from 102 clinical tissue samples divided over six sample groups (Table 1). Using a class discovery approach, we investigated whether miRNA expression profiles can distinguish normal from malignant tissue and further discriminate different PCa subtypes. In all, 513 from the 723 human miRNAs included on the chip, displaying significant hybridization signal levels were tested for differential expression between the normal and the corresponding cancer group in a pairwise fashion. From these, 80 miRNAs were identified as significantly changing between normal and malignant tissues (Figure 2a and Supplementary Table S4). These 80 miRNAs were used for the hierarchical clustering of all samples, which clearly separated non-malignant from advanced PCa specimens and further divided organ-confined PCa samples into two groups (Figure 2a). Group I, clustering with normal adjacent prostate (NAP), normal lymph node and trans-urethral resection of the prostate (TURP-normal), contained 34 PCa tumors. In group II, 16 PCa tumors clustered together with samples derived from patients with advanced PCa (LN-PCa and Oncogene
TURP-PCa). Differences between both PCa groups reflected distinct prognostic characteristics, as group II PCa tumors were strongly associated with significantly increased rate of metastases occurrence after radical prostatectomy (Po0.0001), cancer-related death (P ¼ 0.0007), ETV1 alterations (P ¼ 0.0396) and Gleason score 46 (P ¼ 0.0272) (Figure 2b). Poor outcome of group II PCa tumors was independent of the TMPRSS– ERG fusion status, the clinical stage of the tumor or prostate-specific antigen progression. The average percentage cancer and percentage epithelium in tissue between both groups were significantly different (P ¼ 0.0010 and P ¼ 0.0261, respectively), however, no significant correlation was found between these two parameters (Supplementary Table S5). Within the data set of 80 miRNAs, 22 were identified to significantly contribute to the separation of group I and II PCa tumors (Figure 2c). Subsequent clustering based on the transcriptional profiles of these 22 miRNAs accurately separated all PCa tumors from group II in one of the branches of the hierarchical tree, while 31 of the 34 (91%) PCa group I tumors fell within the other branch suggesting that miRNAs can be used to group tumors per outcome, thus have predictive power. As group II PCa tumors were associated with clinical progression and development of metastases after radical prostatectomy, we also performed a supervised analysis for miRNAs differentially expressed between organconfined PCa tumors that did form metastases and those that did not. Supervised clustering based on metastatic status was in an overall good agreement with the results obtained from unsupervised analyses. Fourteen miRNAs were found to be common in both analyses (Supplementary Figure S3). Thus, we were able to identify distinct sets of miRNAs, which could distinguish normal from malignant samples and could be associated with disease relapse after radical prostatectomy. MiRNAs involved in PCa progression. To also examine if further alterations of miRNA expression occur during disease progression, we tested miRNAs for differential expression between PCa and LN-PCa samples, and compared the expression levels of the identified miRNAs with data obtained from primary prostate stroma cells and primary prostate epithelial cells. In all, 70 miRNAs were found significantly differentially expressed between PCa and LN-PCa (Supplementary Figure S4). From them, 51 were downregulated in LNPCa while 19 were upregulated. Comparison of the expression of these 70 miRNAs in stroma vs epithelium primary cells demonstrated that the majority of miRNAs with abolished expression in metastatic lymph node were as expected from stromal origin. Nevertheless, several miRNAs with decreased expression in group II PCa tumors were further downregulated in malignant lymph node, namely miR-1, -133a, -133b, -143, -143*, -145, -145*, -204, -221 and -222. Importantly, the same set of miRNAs was identified as strongly downregulated in LN-PCa also in our deep
The small transcriptome of prostate cancer ES Martens-Uzunova et al
981 Table 1
Clinical parameters of patient cohort for microarray analysis NAP (n ¼ 11)
PCa (n ¼ 50)
LN-normal (n ¼ 3)
LN-PCa (n ¼ 12)
TURP-normal (n ¼ 4)
TURP-PCa (n ¼ 22)
Age at treatment Average (min–max)
62 (54–72)
62 (49–73)
66 (58–69)
65 (39–72)
75.5 (71–78)
73.5 (49–90)
Follow-up (years) Average (min–max)
11.0 (2.8–16)
11.3 (1–20.1)
12.2 (4.2–16.6)
10.1 (2.3–24.6)
14.6 (12.1–16.3)
10.3 (0.8–16.6)
Gleason score 6 7 8 9
32 10 7 1
(64%) (20%) (14%) (2%)
0 2 8 2
(0%) (17%) (67%) (17%)
3 5 13 1
Clinical stage T1 T2 T3 T4
3 12 16 3
(6%) (24%) (32%) (6%)
0 2 1 1
(0%) (17%) (8%) (8%)
0 2 2 0
Pathological stage T2 T3 T4
16 (332%) 22 (44%) 12 (34%)
Preoperative PSA (n ¼ 48) Average (min–max) PSA progression
16.8 (0.3–181.4) 27 (54%)
Hormone refractory status Hormone refractory Non-hormone refractory Unknown PCa-related death Occurrence of metastases ETV1 alterations TMPRSS–ERG fusion % Epithelium in tissue Average (min–max) % Cancer in tissue Average (min–max)
1 1 0 0 68 (60–80)
8 10 3 29
(16%) (20%) (6%) (58%)
77 (60–100) 84 (60–100)
6 (50%)
1 2 0 2
(33%) (66%) (0%) (66%)
6 6 1 9
(50%) (50%) (8%) (75%)
100
90 (60–100) 100
(14%) (23%) (59%) (4.5%) (0%) (9%) (9%) (9%)
7 (32%)
0 0 0 2 73 (60–80)
7 4 11 7 8 3 11
(32%) (18%) (50%) (32%) (36%) (14%) (50%)
89 (70–100) 98 (90–100)
Abbreviations: NAP, normal adjacent prostate; PCa, organ-confined prostate cancer; LN-normal, normal lymph node; LN-PCa, metastatic lymph node; TURP-normal, non-malignant trans-urethral resection of the prostate; TURP-PCa, malignant trans-urethral resection of the prostate; PSA, prostate-specific antigen; n, number of patients in each group or category; max, maximum value; min, minimum value. Data are n (%) unless stated otherwise.
sequencing libraries (Figure 1b). MiR-145 and miR-222 were also found to be significantly downregulated in malignant compared with normal lymph node (Supplementary Table S4). Construction and performance of miRNA-derived diagnostic classifier. We further evaluated the predictive power of miRNA expression profiles by training a Bayesian Covariate Compound Predictor Algorithm (Radmacher et al., 2002). To avoid possible over-fitting, we estimated the prediction error using leave-one-out cross-validation (LOOCV) (Simon et al., 2003). We designed a diagnostic miR-classifier that can distinguish NAP from PCa samples. As an input, we used all 513 significantly expressed miRNAs in the entire microarray set. The best statistically significant miR-classifier (P ¼ 0.0130, 1000 random permutations) consisted of 54 miRNAs significantly different between the classes
(P ¼ 0.0005, random variance t-test) (Supplementary Table S6). At a posterior probability threshold of 0.7, the diagnostic miR-classifier correctly classified 54 out of 61 samples (89%). A receiver operating characteristic (ROC) curve analysis resulted in an area under the curve of 0.949, with class sensitivity of 0.636 and class specificity of 0.94 for group NAP. The positive and negative predictive values for the same group are 0.7 and 0.922, respectively. We further validated the miR-classifier on an independent data set recently reported by Schaefer et al. (2010). All 24 paired NAP and PCa samples from that study were categorized based on the expression profiles of 43 out of the 54 miRNAs included in our miR-classifier. The remaining 11 miRNAs were not included in the miRNA microarray platform used by the investigators. Using that external data set and the same testing parameters as described above, our miROncogene
The small transcriptome of prostate cancer ES Martens-Uzunova et al
982
Oncogene
The small transcriptome of prostate cancer ES Martens-Uzunova et al
983
classifier performed equally well in correctly predicting the class of the samples, achieving class sensitivity of 1 and class specificity of 0.667 for group NAP. The positive and negative predictive values for the same group are 0.75 and 1, respectively. ROC analysis revealed that miR-classifier performed equally well on both data sets with no significant difference (P ¼ 0.2534) between the derived area under the curves (Figure 3). Construction and performance of miRNA-derived prognostic predictor. Similarly to the construction of the miR-classifier we designed a diagnostic miR-predictor that could distinguish group I (good prognosis) from group II (poor prognosis) PCa samples. The best statistically significant predictor (P ¼ 0.0410, 1000 random permutations) with the lowest crossvalidation mis-classification rate consisted of 25 miRNAs (Figure 4a) significantly different between group I and group II tumors (P ¼ 0.0005, random variance t-test). Fifteen of these miRNAs are also included in miRclassifier and importantly, follow the same direction of expression change (Supplementary Figure S5). At a posterior probability threshold of 0.7, miR-predictor correctly classified 40 out of 50 samples (11 to group II and 29 to group I). Ten samples were not assigned to either of both groups (Figures 4a and c). MiR-predictor
Figure 3 Comparison of the performance of miR-classifier between this study (solid line) and the independent validation data set (Schaefer et al., 2010) (dashed line). Areas under the curves do not differ significantly (P-value ¼ 0.2534). Sensitivity, specificity, positive and negative predictive values for the validation data set are given in parentheses.
reached an area under the curve of 0.991 (Figure 4b) and had class sensitivity and class specificity of 0.912 and 0.750, respectively for group I PCa tumors with positive predictive value of 0.886 and negative predictive value of 0.800 for the same group. To assess miR-predictor as a prognostic factor, we compared its performance with that of other clinical parameters (Figure 5). For the data set described here, at an end point of 12 years the prognostic signature of miR-predictor performed better than the other tested clinical parameters with lower survival probability for patients assigned to the poor outcome group (0.3463, s.e. ¼ 0.1600) compared with Gleason score (0.4375, s.e. ¼ 0.1879), preoperative prostate-specific antigen (0.429, s.e. ¼ 0.1574) or pathological stage (0.7272, s.e. ¼ 0.1767). Comparison of Solexa deep sequencing and Agilent microarray platforms and Q-reverse transcriptase–PCR validation To cross-validate the results obtained from both platforms, we compared the miRNA expression data obtained from Illumina/Solexa deep sequencing and Agilent miRNA microarrays. We identified 725 miRNA sequences in both sequencing reactions. Agilent microarrays used in this study contain probes for 723 miRNAs. In all, 483 (67%) miRNAs were represented by both platforms (Figure 6a). The Agilent microarrays contain probes for 240 miRNAs that were not detected by deep sequencing. The hybridization signal of a substantial number of these probes (approximately 53%) was below the recognized threshold levels in all 102 samples, consequently these miRNAs were assigned absent call by the Agilent Feature Extraction Software (Agilent Technologies, Santa Clara, CA, USA). A majority of miRNAs detected by Solexa but not by microarrays were sequences for which no probes or probes for their opposite strands have been included on the miRNA microarrays. Comparison of log2 transformed data demonstrated that, despite the much broader dynamic range of deep sequencing reactions, the raw signals obtained from sequencing and microarrays are in good agreement since, as many as 51% of the miRNAs detected in PCa and 40% of the miRNAs detected in LN-PCa, had comparable expression levels (Figure 6b). After normalization to the mean, 499% of the miRNAs had a comparable scaled signal within fourfold difference between both platforms (Figure 6c). The good agreement between Illumina/Solexa deep sequencing and Agilent microarrays was further supported
Figure 2 Class discovery of miRNAs associated with PCa outcome. (a) Hierarchical clustering of 80 miRNAs differentially expressed between normal (NAP, LN-normal and TURP-normal) and cancer (PCa, LN-PCa and TURP-PCa) samples. Organ-confined PCa samples cluster in two major groups designated group I (green text) and group II (red text). Red color, upregulation; blue color, downregulation; yellow color, no change. (b) Clinical data are presented as a heat map: (1). Gleason score—yellow 6, orange 7, light red 8, red 9 or 10; (2) clinical stage—yellow T1, orange T2, light red T3, red T4; (3) hormone refractory tumor; (4) PCa-related death; (5) presence of metastases; (6) prostate-specific antigen level progression; (9) ETV1 alteration; (10) TMPRSS2:ERG fusion—yellow no, red yes; (7) % epithelium in tissue; and (8) % cancer in tissue are presented in a color range from 60 to 100%, where darker color indicates higher percentage. Grey indicates no data. (c) Unsupervised hierarchical clustering of PCa tumors based on the transcriptional profiles of miRNAs differentially expressed between group I and group II PCa tumors. Oncogene
The small transcriptome of prostate cancer ES Martens-Uzunova et al
984
Figure 4 Construction and performance of miR-predictor. (a) Predictions made for the 50 organ-confined PCa samples in the data set. Samples are ordered by their posterior probability of membership in either of each class. The upper panel represents a heat map of the relative median centered fold change in log space for each miRNA included in miR-predictor. Red color, upregulation; blue color, downregulation; yellow color, no change. Genes are arranged by hierarchical clustering. The lower panel represents the clinical data for the corresponding samples. Green color indicates good outcome, belongs to group I. Red color indicates poor outcome, belongs to group II. Blue color indicates that miR-predictor could not assign the sample to either of both groups based on their posterior probability when a probability cut-off of 0.7 was applied. Gray color indicates no available data. (b) A receiver operating characteristic curve for miR-predictor applied to organ-confined PCa samples. When sample’s posterior probability was greater than the cut-off of 0.7 sample was considered group I, otherwise it was considered group II. (c) Kaplan–Meier curves for the three tumor groups identified by miR-predictor.
by TaqMan Q-RT–PCR assays performed on a selected set of 12 miRNAs, which included 10 differentially expressed miRNAs between PCa (group I and II) and LN-PCa as identified by microarrays and/or Solexa deep sequencing (miR-1, -143, -145, -205, -210, -222, -301b, -425-5p and -451). A negative control miRNA Oncogene
(miR-558), which was not detected in either of both deep sequencing libraries and was assigned an absent call in 450% of the microarrays derived from PCa and LNPCa, and a non-changing control miRNA (miR-25) that was stably expressed and detected in the Solexa libraries and in all PCa and LN-PCa samples, were also included.
The small transcriptome of prostate cancer ES Martens-Uzunova et al
985
Figure 5 Kaplan–Meier survival curves for PCa-related death based on miR-predictor, pathological grade (Gleason score), pathological stage (PT) and preoperative prostate-specific antigen.
The overall expression ratios as determined by TaqMan Q-RT–PCR assays strongly correlated with the findings from microarrays and deep sequencing (Figure 6d) since not only the direction of change (up- or downregulation), but also the relative log2 ratios of individual differentially expressed miRNAs were well comparable.
Discussion At present, consistent data regarding alterations in the expression of miRNA in PCa are still limited (reviewed
by Coppola et al., 2010) and studies addressing the genome-wide expression profiling of other small ncRNA in this malignancy are lacking. Here, we utilized Solexa Illumina Deep Sequencing to examine the entire spectrum of small ncRNA in PCa specimens, and further screened for changes in the expression of 723 miRNAs by microarray-profiling of 102 histologically confirmed malignant and non-malignant samples from prostatectomy, lymph node and TURP origin. Comparison of miRNA expression profiling results obtained by deep sequencing and microarray analyses demonstrated a high concordance in measuring miRNA Oncogene
The small transcriptome of prostate cancer ES Martens-Uzunova et al
986
Figure 6 Comparison of miRNAs detected by Solexa Deep Sequencing and/or Agilent miRNA microarrays. (a) MiRNA detection between both platforms. (b) Comparison of the obtained expression data between Solexa deep sequencing and Agilent microarrays. The raw log2 transformed signals of 483 miRNAs are plotted. (c) Comparison of the obtained expression data between Solexa deep sequencing and Agilent microarrays. The mean scaled log2 transformed signals of 483 miRNAs are plotted. Yellow indicates fold change p2, red indicates fold change between 2 and 4, blue indicates fold change between 4 and 8, green indicates fold change 48. (d) Quantitativereverse transcriptase–PCR expression analysis of selected miRNAs in comparison with microarray and deep sequencing. Data are represented in normalized log2 ratio of expression. MiR-558 was used as a negative control, which was not detected in deep sequencing libraries and was assigned an absent call in 450% of the microarrays derived from PCa and LN-PCa. MiR-25 was used as a non-changing control that was stably expressed and detected in both Solexa libraries as well as in all PCa and LN-PCa samples. Oncogene
expression levels between both platforms used for this study and identified similar sets of differentially expressed miRNAs. Previously, it has been reported that absolute microarray expression measures correlate better than deep-sequencing data with RNA samplecontent when synthetic samples mimicking the human miRNA pool are used (Willenbrock et al., 2009). However, the correlation between absolute miRNA expression values determined by microarrays and by next-generation sequencing may differ strongly depending on the platform used for microarray profiling (Git et al., 2010), or on the algorithm used for processing of sequencing data. Therefore, to further confirm the validity of results obtained in our microarray and deep sequencing data sets, we also verified the expression of a set of 12 differentially expressed miRNAs by Q–PCR. Our deep sequencing experiments revealed that overall, many miRNAs have decreased expression in metastatic LN-PCa compared with organ-confined disease. These changes in expression were further confirmed by both microarray analysis and by Q–PCR on selected miRNAs. It has been suggested that alterations in the expression levels of Dicer may explain global changes of miRNA expression in prostate adenocarcinoma (Chiosea et al., 2006; Ambs et al., 2008). However, in this study we did not observe significant differences in the expression levels of Dicer or Drosha between the studied patient groups (Supplementary Figure S2). Alternatively, the decreased levels of many miRNAs observed here may be partially explained by their stromal origin and the loss of the stromal compartment in advanced and metastatic PCa. The independence of previous knowledge (that is, no required probe design, which would only cover known genes) together with the very broad dynamic range of deep sequencing (over five orders of magnitude) allowed us to detect several novel miRNA with low expression levels in our deep sequencing libraries. Additionally, we also identified many sequence fragments derived from tRNA and snoRNA transcripts. We further noticed a pronounced increase in tRNA fragments in the metastatic sample pool that can be interpreted as a direct evidence of elevated RNApolymerase III output, which in turn is a feature of transformed and cancerous cells (Marshall and White, 2008). The same was observed for several snoRNAs, providing further support for high metabolic activity and elevated protein-synthesis rate, necessary for the fast growth of tumor cells in progressing cancer. Interestingly, in addition to their function in ribosomal maturation, snoRNA species or their derivates have been implicated in processes associated with carcinogenesis, for example, alternative splicing events (Kishore and Stamm, 2006) and genomic imprinting (Royo et al., 2006). In PCa, snoRNA U50 has been reported to be a candidate tumor-suppressor gene and a mutation in its sequence has been associated with clinically significant disease (Dong et al., 2008). Recent findings have demonstrated that discrete in size snoRNA fragments are produced from a vast majority of snoRNA loci (Taft et al., 2009) and that they can also function as miRNAs
The small transcriptome of prostate cancer ES Martens-Uzunova et al
987
(Ender et al., 2008; Brameier et al., 2011). Additional research is needed to investigate whether this unconventional function of snoRNAs is a wide spread mechanism of gene regulation and whether this holds true for snoRNAs identified in this study. By performing microarray analysis, we were able to identify a miRNA signature that not only distinguished normal from malignant specimens, but also identified two subclasses within the group of patients with organconfined disease at the time of surgery. Comparison of this miRNA signature to known clinicopathologic parameters associated the separation of both subclasses with postoperative occurrence of clinical metastases and poor disease outcome. To evaluate whether the observed associations have a potential clinical diagnostic or prognostic value; we trained a diagnostic miR-classifier and a prognostic miR-predictor using the Bayesian compound covariate method followed by LOOCV analysis. The miR-classifier consists of a set of 54 miRNAs that clearly discriminated normal adjacent from PCa specimens. This miR-classifier performed equally well on the independent microarray data set used for validation (Schaefer et al., 2010) despite the differences in microarray platform, experimental design and sample size, providing evidence that the included miRNAs may have a potential value as diagnostic markers for PCa. Among the miRNAs included in the miR-classifier, miR-205 is of particular interest. This miRNA was the most strongly downregulated miRNA in PCa compared with NAP and its expression is completely abolished in metastatic lymph node and malignant TURP samples. It has been suggested that the tumorsuppressive function of miR-205 takes place through counteracting epithelial-to-mesenchymal transition and reducing cell migration and invasion in the human prostate (Gandellini et al., 2009; Majid et al., 2010). K27me3 modifications of the miR-205 locus was reported to occur in the PCa cell line PC3 (Ke et al., 2009) and in muscle-invasive bladder tumors and undifferentiated bladder cell lines (Wiklund et al., 2010). These findings, together with the early loss of miR-205 during PCa progression observed by us and others (Porkka et al., 2007; Ambs et al., 2008; Schaefer et al., 2010) present miR-205 as an attractive diagnostic marker for PCa disease. The miR-predictor consists of 25 miRNAs, from which 13 are downregulated and 12 are upregulated in PCas with poor outcome. The combined expression profiles of these prognostic miRNAs are very specific for patients at high risk of clinical relapse and their combined predictive accuracy was higher compared with other clinical variables available for the patients included in the study cohort. Unfortunately, because of the limited number of radical prostatectomy samples with a clinical follow-up that includes clinical metastasis occurrence and PCa-related death, and the low quantities of available material, it is difficult to obtain an independent validation set for miR-predictor. To our knowledge, there are no publically available data sets on genome-wide miRNA expression profiling in PCa
that comprise samples with sufficiently long follow-up needed for independent testing of miR-predictor. To partially overcome this drawback, we implied the LOOCV method to reduce over-fitting of our diagnostic and predictive models within our patient cohort. LOOCV is a validation method that iteratively chooses one sample from a given data set to be the validation sample and uses the remaining samples to build a training set. For each round of iteration, the entire model construction is repeated starting with the selection of significant miRNAs. The predictive power of each of the miRNAs included in the final model is represented as the percentage of the iteration steps in which that miRNA has been identified as predictive. In our miR-predictor, we included only miRNAs that had 100% cross-validation support and therefore were predictive for any of the tested combinations. We also controlled the misclassification error rate by calculating a label-permutation P-value that indicates the chance of obtaining the same or lower misclassification for two groups of samples when their sample labels are randomly assigned as compared with the real class labels. However, considering the small sample size of our patient cohort it should be noted that it is not an equivalent to a validation on an independent data set. Nevertheless, the robustness of the method was demonstrated by the validation of the identically constructed miR-classifier on the external data set published by Schaefer et al. (2010). Several miRNAs included in miR-predictor have been recently reported to be deregulated in clinical PCa samples. Downregulation of let-7b, miR-1, miR-133a, miR-143, miR-145, miR-221 and miR-222 and upregulation of miR-25, miR-93, mir-96, miR-183, miR-182 or miR-301b has been reported in PCa when compared with benign prostate hyperplasia or normal prostate tissue by at least one research group (Volinia et al., 2006; Porkka et al., 2007; Ozen et al., 2008; Tong et al., 2009; Schaefer et al., 2010; Spahn et al., 2010; Szczyrba et al., 2010). In addition, overexpression of miR-96 and reduced expression of miR-221 have been associated with increased risk of biochemical recurrence and aggressive PCa (Schaefer et al., 2010; Spahn et al., 2010). The concordant expression of these miRNAs could be in part explained by their genomic organization as mir1/133, mir-143/145, mir-221/222 and mir-96/182/183 are encoded in genomic clusters and most likely their expression levels are regulated by identical regulatory events. A recent analysis of the methylation signature in PCa cell lines demonstrated that indeed histone methylation leads to the silencing of the entire mir-22l/222 cluster (Ke et al., 2009). Deregulation of several of the downregulated miRNAs identified in our prognostic profile has been demonstrated also in other human malignancies or diseases such as breast (Wang et al., 2009) and colorectal cancer (Michael et al., 2003) for the mir-143/145 cluster; breast cancer (Zhao et al., 2008) and glioblastoma (Gillies and Lorimer, 2007) for the mir-221/222 cluster; and liver cancer (Datta et al., 2008) or cardiac hypertrophy (Care et al., 2007) for the mir-1/ 133 cluster. Oncogene
The small transcriptome of prostate cancer ES Martens-Uzunova et al
988
MiRNAs function in carcinogenesis and cancer progression by modulating the expression levels of, among others, tumor-suppressor genes and oncogenes. To examine the functional relevance of miRNAs identified in this study, we performed target-gene network search for the miRNAs included in miR-classifier and miR-predictor by Ingenuity Pathways Analysis (Ingenuity Systems) (Supplementary Data File 1). MiRNA target-genes were significantly enriched in gene networks associated with cancer and reproductive system disease affecting cellular development, cellular growth and proliferation, cell-to-cell signaling, cell morphology and cell cycle (Supplementary Figures S6 and S7). Several upregulated miRNAs identified in this study, for example, miR-19a, miR130a and the mir-20a/ 106/93 family, target key cancer genes involved in PCa signaling. Deregulation of these miRNAs may cause defects in cell cycle checkpoint control and further promote cell cycle progression by decreasing the expression levels of tumor suppressors PTEN, p21 and Rb1, which are commonly inactivated in PCa (reviewed by Lee et al., 2008). In addition, decreased expression of miR-27, miR-143 and miR-221/222 may promote increased expression of Notch1, MAPK kinases and cKIT, which have been associated with epithelial– mesenchymal transition, angiogenesis and metastasis in PCa (Paronetto et al., 2004; Bin Hafeez et al., 2009; Mukherjee et al., 2011). Deregulation of miRNAs in response to altered androgen signaling in PCa has been studied previously (reviewed by Catto et al., 2011). However, based on cell line and xenograft studies, only few miRNAs have been suggested to be androgen regulated. Within the miRNAs included in miR-classifier and miRpredictor, only miR-21, miR-32, miR-141, miR-221 and miR-375, demonstrate changes of expression concordant with previously published data. For example, it has been shown that elevated expression of miR-21 can enhance PCa tumor growth in vivo and, is sufficient for androgen-dependent tumors to overcome castration-mediated growth arrest (Ribas et al., 2009). We recently identified miR-21 together with miR-32, miR-141, miR-221 and miR-375 as differentially expressed during dihydrotestosterone stimulation of different PCa cell lines or 13 intact-castrated pairs of PCaxenografts (Waltering et al., 2011). It has been reported that the mir-221/222 cluster is upregulated in matched androgen-dependent and androgen-independent PCa cell lines (Sun et al., 2009). In the patient cohort presented in this study, the expression of the diagnostic and prognostic miR-221/222 is strongly downregulated during disease progression. Similar downregulation was observed for PCa cell lines (Waltering et al., 2011). In the latest study, only four miRNAs showed similar regulation in both, cell lines and xenograftpairs, and only miR-141 demonstrated concordant expression in castration resistant PCa clinical specimens when compared with PCa. The dissimilarity between the response of different miRNAs to androgen stimulation in cell lines and xenograft models and when compared with expression in clinical samples, Oncogene
may be explained by the direct response to androgens in in vitro studies compared with the long-term effects of androgen deprivation in vivo (Waltering et al., 2011). In addition, the diagnostic and prognostic profiles obtained in this study are based on clinical samples derived early, from patients with organ-confined disease, years before clinical relapse and androgen deprivation therapy. Taken together, our findings support the role of miRNAs, and implicate snoRNAs in prostate oncogenesis. The discovery of a subset of miRNAs, which is associated with the aggressiveness of the tumors, suggests that this regulatory system is, at least, partly responsible for the progression of the disease. Our miRNA predictor forecasts PCa recurrence after radical prostatectomy in the early organ-confined stage before clinical progression. Compared with other prognostic models currently applied in clinical practice, miR-predictor demonstrates enhanced accuracy and suggests novel directions into prognostic prediction of PCa. It is now warranted to evaluate whether this panel of miRNA could be clinically useful in optimizing the treatment strategies for the PCa patients.
Materials and methods Patient samples, clinical database and cell lines For microarray analysis, 102 freshly frozen clinical samples were obtained from the tissue bank of the Erasmus University Medical Center. Clinical parameters of the patient cohort are listed in Table 1. Collection of patient samples has been performed according to national legislation concerning ethical requirements. Use of these samples has been approved by the Erasmus MC Medical Ethics Committee according to the Medical Research Involving Human Subjects Act (MEC-2004-261). Two sample pools each comprising four individual patient samples were used for Solexa/Illumina deep sequencing (Supplementary Table S7). Primary PCa and normal prostate samples were obtained by radical prostatectomy. Samples were snap frozen and stored in liquid nitrogen. Histological evaluation and Gleason grading were performed independently by two pathologists on hematoxylin/eosin-stained frozen sections for all analyzed material. Tumor samples in which at least 60% of the cells were cancerous and containing at least 60% ducts were selected for the analysis. The non-tumor samples contained 0% tumor cells and at least 60% ducts. The latter samples were considered ‘normal’ for this study, although they were derived from prostates that contained adjacent tumor epithelium. Primary human prostate stromal cells and primary human prostate epithelial cells were purchased and cultured according to the manufacturer’s guidelines (Clonetics Human and Animal Cell Systems, Cambrex Bio Science Walkerville Inc., Walkerville, MD, USA). RNA isolation Total RNA was isolated from frozen tissue samples using RNABee reagent (Campro Scientific, GmbH, Berlin, Germany) according to the manufacturer’s protocol.
The small transcriptome of prostate cancer ES Martens-Uzunova et al
989 Illumina/Solexa small RNA library preparation, genome mapping and annotation Total RNA sample pools for small RNA library preparation and sequencing on the Illumina 1G Genome Analyzer was outsourced to ServiceXS, Leiden, The Netherlands. RNA library preparations were performed according to the ‘Small RNA Sample Prep v1.5.0 (Prerelease protocol, Rev-D)’, (Illumina Inc., http://www.illumina.com). Shortly, total RNA pools were size fractionated on 15% Tris/Borate/EDTA urea polyacrylamide electrophoresis gel, and the small ncRNA fraction in the size range of 18 to 30 nt was extracted and purified. After 50 and 30 adapter ligation, complementary DNA library ready for sequencing was constructed by reverse transcription with SuperScript II Reverse Transcriptase (Invitrogen, Carlsbad, CA, USA) followed by 15 cycles of PCR by Phusion DNA Polymerase (Finnzymes Oy, Espoo, Finland) as previously described (Morin et al., 2008). Raw reads obtained after sequencing were processed using the mir-Intess pipeline by InteRNA Genomics BV, The Netherlands (http://www.internagenomics.com), which provided annotation of miRNA reads according to Homo sapience genome (NCBI build 36) as well as identification of novel miRNA candidate genes (Berezikov et al., 2006; Wit et al., 2009). Mapping and annotation of aligned non-miRNA reads with a minimum sequence length of 18 nt (Supplementary Figure S1), which contained at least three recognizable nucleotides from the 30 adapter sequence was performed by MEGABLAST, according to genomic loci annotations retrieved from the UCSC database: hg18 (http://genome. ucsc.edu/) trak tables for sno/miRNA, tRNA and ncRNA genes, and miRBase version: 12.0 (http://www.mirbase.org/) as previously described (Morin et al., 2008). MiRNA microarrays and analysis Microarray analysis of miRNA expression was performed using Human miRNA V2 microarrays (Agilent Technologies, Santa Clara, CA, USA) that contain probe sets for 723 human miRNAs from the Sanger MiRBase, v.10.1 (http://www. mirbase.org/). Microarray processing and analysis are described in Supplementary Data File 1. The array data were submitted using Tab2MAGE to the ArrayExpress database (http://www.ebi.ac.uk/microarray-as/ae/) with accession number E-TABM-794.
The amount of target gene expressed was normalized to U6 and Z30 endogenous controls by the delta Ct method. Statistical analysis of clinical data The significance of contingency for categorical clinical data was examined by Fisher’s exact test (alpha level 0.05). Continuous variables between different groups were compared using two-tailed nested t-test (alpha level 0.05). Pearson correlation coefficient was used to evaluate possible correlation between clinical parameters. Kaplan–Meier survival curves and log-rank tests were used to assess the predictive values of different prognostic approaches. MiR-classifier and miR-predictor construction and evaluation MiR-classifier and miR-predictor were constructed using identical algorithm. Models for utilizing gene expression for class prediction of future samples were developed using the Compound Covariate predictor implemented in the software package ‘BRB array tools’ developed by Dr Richard Simon and BRBArrayTools Development Team (Wright and Simon, 2003). The models incorporated genes that were differentially expressed at the 0.001 significance level as assessed by the random variance t-test. We estimated the prediction error of each model using LOOCV (Simon et al., 2003). For each LOOCV training set, the entire model building process was repeated, including the gene selection process. We also evaluated whether the cross-validated error rate estimate for a model was significantly o1 would expect from random prediction. The class labels were randomly permuted and the entire LOOCV process was repeated. The significance level was defined as the proportion of the random permutations that gave a cross-validated error rate no greater than the cross-validated error rate obtained with the real data. In all, 1000 random permutations were used. Conflict of interest Dr Litman and Dr M ller have been employed by Exiqon A/S and own stocks in that company. The remaining authors declare no conflict of interest. Acknowledgements
TaqMan Q–PCR Quantitative real-time RT–PCR analysis was done with an ABI Prism 7700 Sequence Detection System using TaqMan MicroRNA Reverse transcription kit and TaqMan Universal PCR Master Mix, No AmpErase UNG according to the manufacturer’s specifications (Applied Biosystems, Foster City, CA, USA). Mature miRNA expression in the same total RNA pools as used for deep sequencing was assessed using specific TaqMan MicroRNA Assays (Applied Biosystems).
We thank Theo van der Kwast for histo-pathological examination of patient samples. We also thank Mark Wildhagen for providing the coded clinical data. We acknowledge the European Community’s Seventh Framework Program (FP7/ 2007-2013), grant agreement No HEALTH-F2-2007-201438, the Academy of Finland; Cancer Society of Finland; Reino Lahtikari Foundation; Sigrid Juselius Foundation; and the Medical Research Fund of Tampere University Hospital for their support.
References Ambs S, Prueitt RL, Yi M, Hudson RS, Howe TM, Petrocca F et al. (2008). Genomic profiling of microRNA and messenger RNA reveals deregulated microRNA expression in prostate cancer. Cancer Res 68: 6162–6170. Berezikov E, Thuemmler F, van Laake LW, Kondova I, Bontrop R, Cuppen E et al. (2006). iversity of microRNAs in human and chimpanzee brain. Nat Genet 38: 1375–1377.
Bin Hafeez B, Adhami VM, Asim M, Siddiqui IA, Bhat KM, Zhong W et al. (2009). Targeted knockdown of Notch1 inhibits invasion of human prostate cancer cells concomitant with inhibition of matrix metalloproteinase-9 and urokinase plasminogen activator. Clin Cancer Res 15: 452–459. Brameier M, Herwig A, Reinhardt R, Walter L, Gruber J. (2011). Human box C/D snoRNAs with miRNA like functions: Oncogene
The small transcriptome of prostate cancer ES Martens-Uzunova et al
990 expanding the range of regulatory RNAs. Nucleic Acids Res 39: 675–686. Care A, Catalucci D, Felicetti F, Bonci D, Addario A, Gallo P et al. (2007). MicroRNA-133 controls cardiac hypertrophy. Nat Med 13: 613–618. Catto JW, Alcaraz A, Bjartell AS, De Vere White R, Evans CP, Fussel S et al. (2011). MicroRNA in prostate, bladder, and kidney cancer: a systematic review. Eur Urol 59: 671–681. Chiosea S, Jelezcova E, Chandran U, Acquafondata M, McHale T, Sobol RW et al. (2006). Up-regulation of dicer, a component of the microRNA machinery, in prostate adenocarcinoma. Am J Pathol 169: 1812–1820. Coppola V, De Maria R, Bonci D. (2010). MicroRNAs and prostate cancer. Endocr Relat Cancer 17: F1–17. Datta J, Kutay H, Nasser MW, Nuovo GJ, Wang B, Majumder S et al. (2008). Methylation mediated silencing of microRNA-1 gene and its role in hepatocellular carcinogenesis. Cancer Res 68: 5049–5058. Dong X-Y, Rodriguez C, Guo P, Sun X, Talbot JT, Zhou W et al. (2008). SnoRNA U50 is a candidate tumor-suppressor gene at 6q14.3 with a mutation associated with clinically significant prostate cancer. Hum Mol Genet 17: 1031 . Ender C, Krek A, Friedla¨nder MR, Beitzinger M, Weinmann L, Chen W et al. (2008). A human snoRNA with microRNA-like functions. Mol Cell 32: 519–528. Ferlay J, Autier P, Boniol M, Heanue M, Colombet M, Boyle P. (2007). Estimates of the cancer incidence and mortality in Europe in 2006. Ann Oncol 18: 581–592. Gandellini P, Folini M, Longoni N, Pennati M, Binda M, Colecchia M et al. (2009). miR-205 exerts tumor-suppressive functions in human prostate through down-regulation of protein kinase Cepsilon. Cancer Res 69: 2287–2295. Gillies JK, Lorimer IAJ. (2007). Regulation of p27Kip1 by miRNA 221/222 in glioblastoma. Cell Cycle 6: 2005–2009. Git A, Dvinge H, Salmon-Divon M, Osborne M, Kutter C, Hadfield J et al. (2010). Systematic comparison of microarray profiling, realtime PCR, and next-generation sequencing technologies for measuring differential microRNA expression. RNA 16: 991–1006. Ke XS, Qu Y, Rostad K, Li WC, Lin B, Halvorsen OJ et al. (2009). Genome-wide profiling of histone h3 lysine 4 and lysine 27 trimethylation reveals an epigenetic signature in prostate carcinogenesis. PLoS One 4: e4687. Kishore S, Stamm S. (2006). The snoRNA HBII-52 regulates alternative splicing of the serotonin receptor 2C. Science 311: 230–232. Lee JT, Lehmann BD, Terrian DM, Chappell WH, Stivala F, Libra M et al. (2008). Targeting prostate cancer based on signal transduction and cell cycle pathways. Cell Cycle 15: 1745–1762. Lu J, Getz G, Miska EA, Alvarez-Saavedra E, Lamb J, Peck D et al. (2005). MicroRNA expression profiles classify human cancers. Nature 435: 834–838. Majid S, Dar AA, Saini S, Yamamura S, Hirata H, Tanaka Y et al. (2010). MicroRNA-205-directed transcriptional activation of tumor suppressor genes in prostate cancer. Cancer 116: 5637–5649. Marberger M. (2009). Prostate cancer 2008: challenges in diagnosis and management. Eur Urol, Supplements 8: 89–96. Marshall L, White RJ. (2008). Non-coding RNA production by RNA polymerase III is implicated in cancer. Nat Rev Cancer 8: 911–914. Mattick JS, Makunin IV. (2006). Non-coding RNA. Hum Mol Genet 15(Spec No 1): R17–R29. Michael MZ, SM OC, van Holst Pellekaan NG, Young GP, James RJ. (2003). Reduced accumulation of specific microRNAs in colorectal neoplasia. Mol Cancer Res 1: 882–891. Morin RD, O’Connor MD, Griffith M, Kuchenbauer F, Delaney A, Prabhu AL et al. (2008). Application of massively parallel sequencing to microRNA profiling and discovery in human embryonic stem cells. Genome Res 18: 610–621. Mukherjee R, McGuinness DH, McCall P, Underwood MA, Seywright M, Orange C et al. (2011). Upregulation of MAPK pathway Oncogene
is associated with survival in castrate-resistant prostate cancer. Br J Cancer 104: 1920–1928. Ozen M, Creighton CJ, Ozdemir M, Ittmann M. (2008). Widespread deregulation of microRNA expression in human prostate cancer. Oncogene 27: 1788–1793. Paronetto MP, Farini D, Sammarco I, Maturo G, Vespasiani G, Geremia R et al. (2004). Expression of a truncated form of the c-Kit tyrosine kinase receptor and activation of Src kinase in human prostatic cancer. Am J Pathol 164: 1243–1251. Porkka KP, Pfeiffer MJ, Waltering KK, Vessella RL, Tammela TLJ, Visakorpi T. (2007). MicroRNA expression profiling in prostate cancer. Cancer Res 67: 6130–6135. Prueitt RL, Yi M, Hudson RS, Wallace TA, Howe TM, Yfantis HG et al. (2008). Expression of microRNAs and protein-coding genes associated with perineural invasion in prostate cancer. Prostate 68: 1152–1164. Radmacher MD, McShane LM, Simon R. (2002). A paradigm for class prediction using gene expression profiles. J Comput Biol 9: 505–511. Reis EM, Nakaya HI, Louro R, Canavez FC, Flatschart AV, Almeida GT et al. (2004). Antisense intronic non-coding RNA levels correlate to the degree of tumor differentiation in prostate cancer. Oncogene 23: 6684–6692. Ribas J, Ni X, Haffner M, Wentzel EA, Salmasi AH, Chowdhury WH et al. (2009). miR-21: an androgen receptor-regulated microRNA that promotes hormone-dependent and hormone-independent prostate cancer growth. Cancer Res 69: 7165–7169. Royo H, Bortolin ML, Seitz H, Cavaille´ J. (2006). Small non-coding RNAs and genomic imprinting. Cytogenet and Genome Res 113: 99–108. Schaefer A, Jung M, Mollenkopf H-J, Wagner I, Stephan C, Jentzmik F et al. (2010). Diagnostic and prognostic implications of microRNA profiling in prostate carcinoma. Int J Cancer 126: 1166–1176. Shi X-B, Xue L, Yang J, Ma A-H, Zhao J, Xu M et al. (2007). An androgen-regulated miRNA suppresses Bak1 expression and induces androgen-independent growth of prostate cancer cells. Proc Natl Acad Sci USA 104: 19983–19988. Simon R, Radmacher MD, Dobbin K, McShane LM. (2003). Pitfalls in the use of DNA microarray data for diagnostic and prognostic classification. J Natl Cancer Inst 95: 14–18. Spahn M, Kneitz S, Scholz CJ, Stenger N, Rudiger T, Strobel P et al. (2010). Expression of microRNA-221 is progressively reduced in aggressive prostate cancer and metastasis and predicts clinical recurrence. Int J Cancer 127: 394–403. Sun T, Wang Q, Balk S, Brown M, Lee GS, Kantoff P. (2009). The role of microRNA-221 and microRNA-222 in androgen-independent prostate cancer cell lines. Cancer Res 69: 3356–3363. Szczyrba J, Loprich E, Wach S, Jung V, Unteregger G, Barth S et al. (2010). The microRNA profile of prostate carcinoma obtained by deep sequencing. Mol Cancer Res 8: 529–538. Taft RJ, Glazov EA, Lassmann T, Hayashizaki Y, Carninci P, and Mattick JS et al. (2009). Small RNAs derived from snoRNAs. RNA 15: 1233–1240. Tong AW, Fulgham P, Jay C, Chen P, Khalil I, Liu S et al. (2009). MicroRNA profile analysis of human prostate cancers. Cancer Gene Ther 16: 206–216. Volinia S, Calin GA, Liu C-G, Ambs S, Cimmino A, Petrocca F et al. (2006). A microRNA expression signature of human solid tumors defines cancer gene targets. Proc Natl Acad Sci USA 103: 2257–2261. Waltering KK, Porkka KP, Jalava SE, Urbanucci A, Kohonen PJ, Latonen LM et al. (2011). Androgen regulation of micro-RNAs in prostate cancer. Prostate 71(6): 604–614. Wang S, Bian C, Yang Z, Bo Y, Li J, Zeng L et al. (2009). miR-145 inhibits breast cancer cell growth through RTKN. Int J Oncol 34: 1461–1466. Wiklund ED, Bramsen JB, Hulf T, Dyrskjot L, Ramanathan R, Hansen TB et al. (2010). Coordinated epigenetic repression of the miR-200 family and miR-205 in invasive bladder cancer. Int J Cancer 128: 1327–1334.
The small transcriptome of prostate cancer ES Martens-Uzunova et al
991 Willenbrock H, Salomon J, Sokilde R, Barken KB, Hansen TN, Nielsen FC et al. (2009). Quantitative miRNA expression analysis: comparing microarrays with next-generation sequencing. RNA 15: 2028–2034. Wit E, Linsen SEV, Cuppen E, Berezikov E. (2009). Repertoire and evolution of miRNA genes in four divergent nematode species. Genome Res 19: 2064–2074.
Wright GW, Simon RM. (2003). A random variance model for detection of differential gene expression in small microarray experiments. Bioinformatics 19: 2448–2455. Zhao J-J, Lin J, Yang H, Kong W, He L, Ma X et al. (2008). MicroRNA-221/222 negatively regulates estrogen receptor{alpha} and is associated with tamoxifen resistance in breast cancer. J Biol Chem 283: 31079–31086.
Supplementary Information accompanies the paper on the Oncogene website (http://www.nature.com/onc)