Diagramming Information Structures Using 3D Perceptual Primitives POURANG IRANI University of New Brunswick and COLIN WARE University of New Hampshire
The class of diagrams known collectively as node-link diagrams are used extensively for many applications, including planning, communications networks, and computer software. The defining features of these diagrams are nodes, represented by a circle or rectangle connected by links usually represented by some form of line or arrow. We investigate the proposition that drawing threedimensional shaded elements instead of using simple lines and outlines will result in diagrams that are easier to interpret. A set of guidelines for such diagrams is derived from perception theory and these collectively define the concept of the geon diagram. We also introduce a new substructure identification task for evaluating diagrams and use it to test the effectiveness of geon diagrams. The results from five experiments are reported. In the first three experiments geon diagrams are compared to Unified Modeling Language (UML) diagrams. The results show that substructures can be identified in geon diagrams with approximately half the errors and significantly faster. The results also show that geon diagrams can be recalled much more reliably than structurally equivalent UML diagrams. In the final two experiments geon diagrams are compared with diagrams having the same outline but not constructed with shaded solids. This is designed to specifically test the importance of using 3D shaded primitives. The results also show that substructures can be identified much more accurately with shaded components than with 2D outline equivalents and remembered more reliably. Implications for the design of diagrams are discussed. Categories and Subject Descriptors: H.5.2 [Information Interfaces and Presentation]: User Interfaces—evaluation/methodology General Terms: Human Factors, Design Additional Key Words and Phrases: 3D diagrams, information visualization
1. INTRODUCTION Diagrams have become indispensable tools for documenting information systems. One particular class of diagrams is called node-link diagrams. These consist of nodes, often drawn as outline boxes or circles, and links usually drawn as Authors’ addresses: P. Irani, Department of Computer Science, University of Manitoba, 556 Machray Hall, Winnipeg, Manitoba R3T 2N2, Canada; email:
[email protected]; C. Ware, University of New Hampshire. Permission to make digital/hard copy of part or all of this work for personal or classroom use is granted without fee provided that the copies are not made or distributed for profit or commercial advantage, the copyright notice, the title of the publication, and its date appear, and notice is given that copying is by permission of the ACM, Inc. To copy otherwise, to republish, to post on servers, or to redistribute to lists, requires prior specific permission and /or a fee. ° C 2003 ACM 1073-0616/03/0300-0001 $5.00 ACM Transactions on Computer-Human Interaction, Vol. 10, No. 1, March 2003, Pages 1–19.
2
•
P. Irani and C. Ware
lines that connect the nodes. Both the nodes and the links can have attributes and these attributes are coded according to various graphical conventions. Often different shapes differentiate different types of nodes and sometimes the linking lines have symbols attached, and are dashed or dotted to represent different types of relationships. Examples of node-link diagrams are dataflow diagrams, flow charts, software structure charts, data network diagrams, and the diagrams that make up the Unified Modeling Language (UML). One reason why diagrams are so useful is that people find it difficult to internally manipulate complex mental images. Diagrams act as cognitive “externalizations” enhancing our problem-solving ability by both providing a kind of working memory extension and by enabling us to directly perceive solutions through pattern identification [Scaife and Rogers 1996]. A study by Larkin and Simon [1987] illustrates reasons as to why diagrams can be effective. In their study they set up a range of physics problems and compared the efficiency of solving these problems with and without diagrams. They looked at the effort of search, recognition, and inference, for diagrammatic representations versus sentential descriptions of the problem. They found that diagrams can be useful in three major ways: searching for elements is reduced as diagrams group together related information, matching symbolic labels is avoided as diagrams typically use location to group information about a single element, and perceptual inferences that are automatically supported by diagrams can be read directly. However, not all diagrams are equivalent; certain mappings of information to graphical display are more effective than others [Ware 2000; Hahn and Kim 2000; Zhang 1997]. One of the variables that has been studied is whether 3D diagrams are more effective. 1.1 Studies of 3D Diagrams Studies of the effectiveness of 3D diagrams have reported mixed results. Lee and MacLachian [1986] have shown that reducing the number of diagrams by using the added dimension in a 3D presentation could result in efficient decision making. They compared the accuracy and speed of decision making using stereoscopic 3D displays of scattergrams and block diagrams. They found that 3D scattergrams increased accuracy and facilitated faster decision making, as more 2D scattergrams were required to present the equivalent information of a single 3D scattergram. Ware and Franck [1996] used a path-tracing task to evaluate 3D versus 2D node-link diagrams. They found a 60% advantage with stereoscopic viewing and a 130% advantage with motion parallax depth cues. Studies of bar and pie charts suggest that 3D versions provide no advantage. For example 3D block diagrams did not have any effects on accuracy or speed of decision making compared to 2D tabular reports [Lee and MacLachian, 1986] and if the 3D features are overly decorative this may be detrimental [Carswell et al. 1991]. To measure the effectiveness of recalling information from 3D displays, Watson and Driver [1983] presented 3D perspective graphs and 2D tabular displays to business students. They did not find any difference between recall for the 3D perspective graphs compared to the 2D tabular presentations. ACM Transactions on Computer-Human Interaction, Vol. 10, No. 1, March 2003.
Diagramming Information Structures
•
3
Fig. 1. Despite having very different shapes in their images, the objects a and b shown above are readily identifiable as being the same. According to image-based recognition theories a and c should be seen as most similar because their images match more closely than images a and b.
However, there may be ways of mapping information to 3D solid components that provides a better match to human perceptual mechanisms. In the present article we explore the idea that diagrams constructed with interconnected 3D shape primitives will be easier to interpret and remember. The simple geometric shapes and lines commonly used in node-link diagrams may not be optimally matched to human visual capabilities. This idea is based on the theory of structural object perception developed by Marr and Nishihara [1978] and later by Biederman [1987]. According to this theory 3D objects are decomposed by the human visual system into 3D shape primitives together with a topological connecting “skeleton.” If we can visually present information in such a way that the structure is automatically extracted by the visual system this will result in diagrams that can be more rapidly and accurately interpreted with a lower cognitive load. We first discuss the theory of structured object perception and show how it can be used to define guidelines for constructing diagrams. We introduce a method for evaluating diagrams called substructure identification and apply it to evaluate diagrams constructed from 3D shape primitives, together with a simple memory test. 1.2 Structural Object Perception Theory There are two general classes of current theories of object perception. One class emphasizes the properties of the visual image and suggests that we recognize objects based on the similarities of the image they present with the images of previously viewed objects [Edelman 1995]. Image-based theories account for the fact that upside-down faces are much harder to recognize than right-side up faces. The other class of theory emphasizes viewpoint independent analysis of object structure. To illustrate, Figure 1 shows two images that are immediately seen as different views of the same object, even though the images are very different, whereas two very similar images are perceived as depicting different objects. To explain this, and other similar effects researchers have proposed ACM Transactions on Computer-Human Interaction, Vol. 10, No. 1, March 2003.
4
•
P. Irani and C. Ware
Fig. 2. Theories of structural object perception propose a series of processing stages, culminating in object recognition.
that the visual system builds structural 3D models. Current evidence suggests that the visual system supports both image-based and structural object recognition—they need not be mutually exclusive—and so we believe that aspects of both theories should be taken into account when constructing diagrams. Figure 2 is intended to capture the broad outlines of structural object perception theory. Object recognition is accomplished in a series of stages. At the first stage, the visual image is everywhere analyzed into primitives of edge elements, color, and texture. This information is then used to segment the image so that the boundaries of objects can be extracted. Elementary shape-from-shading information also is used in simple object components [Ramachandran 1988] or “blobs” [Biderman 1987]. At the same time a structural skeleton is identified, containing information about how the components are interconnected [Marr 1982; Biederman and Gerhardstein 1993]. Ultimately, all of the information is combined in object identification. In the following paragraphs we discuss the role of silhouette shape, shading, and surface features in somewhat more detail. Silhouettes are especially important in determining how we perceive objects. Children tend to draw objects based on their most salient silhouettes; for example, profiles of animals are chosen in preference to other views [Halverston, 1992]. Marr [1982] argued that “buried deep in our perceptual machinery” are processes that determine how silhouettes are interpreted. He argued that there are several rules embedded in this perceptual machinery. 1. Each line of sight touching a silhouette grazes the surface only once. The set of such points is the contour generator. 2. Adjacent points on the contour arise from adjacent points on the viewed object. ACM Transactions on Computer-Human Interaction, Vol. 10, No. 1, March 2003.
Diagramming Information Structures
•
5
Fig. 3. According to Marr the perceptual system makes assumptions that occluding contours are smoothly connected and lie in the same plane at right angles to the line of sight. Adapted from Marr [1982].
Fig. 4. According to Marr and Nishihara [1978] concave sections of the silhouette define subparts of the object. These points are critical in defining a structural skeleton. Adapted from Marr and Nishihara [1978].
3. All of the points on the contour generator lie on a single plane. The idea of a contour generator is illustrated in Figure 3. Marr and Nishihara [1978] proposed that concave sections of the silhouette contour are critical in defining how different parts of an object are segmented. Figure 4 illustrates a crudely drawn animal that we nevertheless readily perceive as having distinct head, legs, torso, and tail parts. They also proposed a mechanism whereby the axes of the parts become cognitively connected to draw a structural skeleton. According to Marr, the 3D primitives that are identified are a set of generalized cones. Biederman developed a more elaborate set of 36 3D primitives he called “geons.” These are also defined by image properties on the silhouette according to a set of rules based on colinearity, symmetry, parallelism, curvature, and cotermination (the contours meet at a point, e.g., a cone) of parts of the silhouette. Some of Biederman’s geons are illustrated in Figure 5. Biederman’s concept of a structural skeleton is more elaborate than that of Marr although both point out that different combinations of geons can result in different objects being recognized. Biederman identified certain relationships between pairs of geons as being particularly significant. For example, in the structural description of a human, the head geon is normally on top of the torso geon, and the arm geon is attached to the upper side of the torso geon. In Figure 5, the mug and the pail have the same geon components but are identified as different because of the different connections between them. Elementary shape-from-shading information is also important in the recognition of an object’s structural components. Enns and Rensink [1990] showed that simple shading information can be processed preattentively, suggesting that it is extracted very early in human visual processing. Ramachandran ACM Transactions on Computer-Human Interaction, Vol. 10, No. 1, March 2003.
6
•
P. Irani and C. Ware
Fig. 5. (a) Geons are object primitives in Biederman’s theory; (b) when connected in a particular structural relationship they can define an object; (c) different corrections of the same geons can result in different objects as the figure shows.
Fig. 6. On the left, the same object silhouette, a rectangle can result from two very differently structured objects as shown above and below. The images on the right show the same objects without shading.
[1988] has shown that shading and contour can combine to strongly influence the shape of an object. Indeed, Figure 6 shows how shading information can cause two objects with the same silhouette to be interpreted quite differently. This shows that shape-from-shading processes feed both into the 3D shape primitives and into the definition of a structural skeleton. There is evidence from a number of sources that surface color and surface texture are processed relatively independently from the object structural description. According to theory these surface attributes are considered to be secondary properties of objects [Triesman 1980; Biederman 1987]. Thus in Figure 2 the basic information about color and texture bypasses the processes involved ACM Transactions on Computer-Human Interaction, Vol. 10, No. 1, March 2003.
Diagramming Information Structures
•
7
in forming 3D primitives and building structural description, only becoming associated with the object at the final stage.
2. APPLYING STRUCTURED OBJECT PERCEPTION THEORY TO DRAWING DIAGRAMS In general, a goal of visualization is to present information in such a way that important information is automatically extracted by the visual system. Thus if we have visual machinery to extract 3D primitives and a structural description it may make sense to present data using these primitives. The geons proposed by Biederman present a rich set of shapes that can be used to represent different classes of entities in a node-link diagram. Relationships can be represented by the way that geons are attached directly to one another. Alternatively elongated geons can be used to show relationships. The secondary attributes of entities and relationships can be mapped to the secondary visual attributes of geons, namely, color and surface texture. The following rules define what we call a “geon diagram.” We have used Biederman’s term “geon” as it nicely describes the idea of a 3D shape although we do not necessarily endorse the particular set of 3D shape primitives in Biederman’s theory. We define five rules relating to the use of geons as 3D primitives, and three additional rules that relate to the layout of the geon structure. G1: Major entities of a system should be presented using simple 3D shape primitives (geons). A primary concept in modern software engineering is the “object.” Mapping these abstract objects to elementary visual objects may make them more readily understood. G2: The links between entities can be represented by the connections between geons. Thus the geon structural skeleton represents the data structure. Geon theory proposes that the visual system will automatically extract the structural skeleton making the data structure available to cognition. G3: Minor subcomponents are represented as geon appendices, small geon components attached to larger geons. Mapping object importance to object size seems intuitive. It may have a perceptual basis and it certainly is a commonly used graphical convention. G4: Geons should be shaded to make their 3D shape clearly visible. This rule follows from studies showing the importance of shading in object identification G5: Secondary attributes of entities and relationships are represented by geon color and texture and by symbols mapped onto the surfaces of geons. This rule follows directly from the perceptual theory suggesting that color and texture are secondary properties of geons. Although geons are 3D shape primitives, theories of shape extraction rely heavily on a clear silhouette. For this reason a good 2D layout will also be important in determining how easily a geon structural description can be identified. Thus we add the following layout rules. ACM Transactions on Computer-Human Interaction, Vol. 10, No. 1, March 2003.
8
•
P. Irani and C. Ware
L1: All geons should be visible from the chosen viewpoint. This rule is directly taken from Biedermans theory. L2: Junctions between geons should be made clearly visible. This is necessary to ensure that the structural connections can be identified. L3: The geon diagram should be laid out predominantly in the plane orthogonal to the view direction. This provides a simple method for making geons and the connections between them foreshortening clearly visible. It also reduces the confusion that foreshortening effects might cause. From the above it can be seen that geon diagrams are based on a combination of 3D and 2D rules. They incorporate 3D information in the shapes used to represent information, but it is recommended that they be laid out, as much as possible, in the 2D plane orthogonal to the line of sight. 2.1 Geon Toolkit We constructed a toolkit using the OpenGL 3D graphics standard to explore the effectiveness of geons in node-link diagrams. Using the toolkit we can create geon diagrams according to the principles given previously. At present the geon toolkit is designed to be a research tool rather than a diagramming utility and as such lacks many of the features essential in a usable system (such as the ability to attach text labels). The toolkit has the following capabilities. —It equipped with a set of 24 geons for building diagrams. —The geons can have surface properties such as color, texture, shading, and transparency. —It provides for metric associations with the use of varying sizes and shapes of objects and their positioning in space. —It provides for symbolic associations via surface properties. —It formulates topological associations by the structural composition of geons.
3. EVALUATION OF GEON DIAGRAMS The remainder of this article describes five different experiments designed to test the hypothesis that geon diagrams are easier to interpret and remember than 2D UML diagrams and 2D versions of geon diagrams. To measure the ease of interpretation we devised a task requiring the identification of subcomponents of a larger diagram. This requires a kind of visual parsing that is an analytic skill. We measured both speed and accuracy for this task. To measure how easy geon diagrams are to remember, we evaluated the subject’s ability to recall briefly presented diagrams. In the first three experiments the geon diagrams were compared to UML equivalents. UML was chosen as it is a rich diagramming notation that combines several diagramming techniques and is a de facto standard for many diagrams used in software engineering. From the wide range of UML diagrams, we chose to compare the geon objects to notations of UML class diagrams as these have the most extensive set of notations. ACM Transactions on Computer-Human Interaction, Vol. 10, No. 1, March 2003.
Diagramming Information Structures
•
9
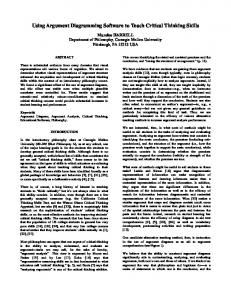
Fig. 7. Mapping between geon and UML Components for Experiments 1 and 2. Colors on geon components are used to map to different object names in UML. For example, an orange ellipsoid maps to Class A and a red ellipsoid maps to Class B. Also in the cases of Association/Ordered Association, Composition/Ordered Composition, and Aggregation/Ordered Aggregation the only differentiating factor was the texture of the geon components.
The first experiments have a practical rather than theoretical motivation. They can say nothing about whether using 3D primitives is actually better, only that one complex set of conventions (geon diagram) is better or worse than another (UML). The final two experiments were designed to look at the issue of whether using 3D primitives is superior. In Experiments four and five, the geon diagrams were compared to 2D silhouettes of the same diagrams. Note that a partial report of the first two experiments was previously given at the Advanced Visual Interfaces Conference [Irani and Ware 2000].
4. EXPERIMENT 1: SUBSTRUCTURE IDENTIFICATION WITH GEON VERSUS UML DIAGRAMS The purpose of the first experiment was to determine the ease with which people can parse geon diagrams in comparison to equivalent UML diagrams. To do this we measured the time and error rate for a subject to recognize a substructure of a diagram. We hypothesized that it should be possible to identify substructures faster and more accurately with geon diagrams. To make an equivalent set of UML and geon diagrams we devised a mapping convention of geon elements to UML objects (Figure 7). 4.1 Method for Experiment 1 In Experiment 1 subjects were first shown a substructure and later asked to identify its presence or absence in a series of diagrams. 4.1.1 Diagrams. Two sets of 10 UML diagrams were drawn using Rational RoseTM and an equivalent set of geon diagrams was constructed using the geon toolkit. Rational RoseTM is a commercial software engineering package that ACM Transactions on Computer-Human Interaction, Vol. 10, No. 1, March 2003.
10
•
P. Irani and C. Ware
Fig. 8. An example of a geon diagram and its UML equivalent used in Experiment 1.
Fig. 9. Substructures of the diagrams shown in Figure 8.
supports UML diagrams. Figure 8 gives an example. For each set a substructure was constructed; for the first sets the substructure contained two nodes and for the second sets it contained four nodes (Figure 9). A diagram was defined as containing a substructure if the substructure’s components and their connections were present. However, the substructure layout could be different so that substructure recognition could not be performed by a simple template match. The substructure only was present in half the diagrams. The UML diagrams were artificial in the sense that they did not depict any particular system but included most of the boxes and arcs used in UML class diagrams. The UML diagrams also used text to denote the names of classes and the type of the class (i.e., Parameterized Class A, or Utility Class B, etc.). The geon diagrams did not use any text labels and instead made use of color and ACM Transactions on Computer-Human Interaction, Vol. 10, No. 1, March 2003.
Diagramming Information Structures
•
11
Table I. Summary of Results of Experiment 1 Identification Time (sec) Error Rate
Geon Diagram 4.3 13.33%
UML Diagram 7.1 26.33%
texture to distinguish between the different types of classes. For example, if the UML diagram contained Class A and Class B as two separate entities, our mappings produced an equivalent geon diagram with a red ellipsoid for Class A and a blue ellipsoid for Class B. For this experiment all the diagrams were presented on a computer screen. 4.1.2 Procedure. On each trial the subject was first shown the substructure for 15 seconds and was then given three practice trials in which they were shown the substructure that appeared in three complete diagrams. After completing the practice, the program selected a diagram randomly from the set of 10 diagrams and presented it to the subject. For each diagram the participant pressed the “Y” key if the substructure was present or the “N” key if it was not. The response time of the user was captured along with the correctness of the response. The order in which the sets were presented to subjects was randomly selected from one of the sequences {G1, U1, U2, G2}, {U1, G1, G2, U2}, {U1, G1, U2, G2}, {G1, U1, G2, U2}, where G denotes a set of geon diagrams and U a set of UML diagrams: The 15 subjects were all computer science students. 4.2 Results of Experiment 1 The results are summarized in Table I. These show that substructures were identified both faster and more accurately with the geon diagrams. From the 15 subjects, 11 subjects correctly identified the substructure in more geon than UML diagrams, 1 subject identified the substructure equally often with the geon diagrams as with the UML diagrams, and the remaining 3 were more accurate with the UML diagrams. A sign test shows this difference to be significant ( p < 0.05). On average the subjects took 4.3 seconds to identify (correctly or incorrectly) the presence of the substructure in the geon diagram and 7.1 seconds for the UML diagrams. Of the set of 15 subjects, 13 identified the geon substructure faster than the UML substructure. A t-test shows this difference to be highly significant ( p < 0.005). These results support the hypothesis that geon diagrams are easier and faster to interpret than 2D UML diagrams. 5. EXPERIMENT 2: RECALL OF GEON VERSUS UML DIAGRAMS The purpose of the second experiment was to determine whether geon diagrams could be remembered more easily than UML diagrams. Under certain circumstances human memory for images is remarkably good although not for abstract images [Bower et al. 1995]. We hypothesized that because geon ACM Transactions on Computer-Human Interaction, Vol. 10, No. 1, March 2003.
12
•
P. Irani and C. Ware
diagrams more resemble real-world structures they might be more readily recalled after a brief exposure than comparable UML diagrams. 5.1 Method for Experiment 2 This experiment was formulated to compare the accuracy of recalling geon diagrams versus equivalent UML diagrams. 5.1.1 Diagrams. A set of 14 UML diagrams was developed using Rational RoseTM . Using our mapping convention of geons to UML entities, an equivalent set of 14 geon diagrams was produced using the geon toolkit. Both sets of diagrams were printed in color on 8.5 by 11 inch transparencies. 5.1.2 Subjects. The experiment was conducted using two sets of students in senior-level computer science courses. If a student had previously performed a similar experiment he or she was asked to indicate that on the results sheet handout and those data were later discarded. All the students were familiar with UML notation. 5.1.3 Procedure. At the beginning of the lecture the first set of students was shown half (7) of the set of geon diagrams in random order for 15 seconds per diagram. After presenting the first half of geon diagrams they were then presented with 7 UML diagrams at intervals of 15 seconds. At the end of the lecture, approximately 50 minutes later, the students were shown the full set of 14 geon diagrams and 14 UML diagrams. Each diagram was shown for 10 seconds and the subject indicated on a printed sheet whether that diagram had been part of the initial set. As a counterbalance, the same procedure was applied to the second set of students with the UML diagrams being presented first and the geon diagrams second. There were 18 students who participated with geon diagrams first and 17 students who participated with UML diagrams first, giving a total of 35 subjects. 5.2 Results of Experiment 2 Subjects made less than half the errors in recalling geon diagrams than they did for the equivalent UML diagrams: 18% error rate for the geon diagrams versus 39% for the UML diagrams. This difference is especially striking considering that chance performance is 50%. From the 35 subjects, 26 recalled correctly more geon than UML diagrams, 5 recalled correctly the same number of geon diagrams as UML diagrams, and 4 subjects recalled correctly more UML diagrams. A sign test showed this difference to be highly significant ( p < 0.005). These results support the hypothesis that geon diagrams are easier to remember. 6. EXPERIMENT 3: RECALL OF GEON VERSUS UML DIAGRAMS (WITHOUT SURFACE ATTRIBUTES) The geon diagrams used in Experiments 1 and 2 used geons that were distinguishable using color and surface texture as well as 3D geon shape. It might therefore be the case that color and texture were more important than the use ACM Transactions on Computer-Human Interaction, Vol. 10, No. 1, March 2003.
Diagramming Information Structures
•
13
Fig. 10. Mapping used for Experiment 3.
of 3D geons in making these diagrams more effective. The third experiment was designed to determine whether geon diagrams without surface attributes would still be better than the recall of UML diagrams. The one-to-one mapping between geon elements and UML objects is shown in Figure 10. We hypothesized that geon diagrams would be more readily recalled after a brief exposure than comparable UML diagrams. 6.1 Method for Experiment 3 The procedure was the same as for Experiment 2. The first group of students was first shown the UML diagrams and the second group of students was shown the geon diagrams first. There was a total of 25 students in the first group and 17 students in the second. The data from those students who had performed a similar experiment before were discarded as well as three randomly chosen result sets to bring the total number of subjects to 35 as in Experiment 2. 6.2 Results of Experiment 3 Subjects on average had an error rate of 22.5% for recalling the geon diagrams and 42% for recalling the equivalent 2D UML diagrams, or almost half the error rates were observed with the geon diagrams. From a total of 35 subjects, 25 recalled more geon diagrams, 2 recalled the same number of geon diagrams as UML diagrams, and 8 subjects recalled more UML diagrams. This difference is significant ( p < 0.01). The results strongly support the hypothesis that remembering geon diagrams is easier than remembering UML diagrams even when the geon diagrams are not presented with surface attributes. 7. INTRODUCTION TO EXPERIMENTS 4 AND 5 Although the first three experiments strongly support the idea that using 3D primitives in diagrams can make them easier to interpret and remember than ACM Transactions on Computer-Human Interaction, Vol. 10, No. 1, March 2003.
14
•
P. Irani and C. Ware
Fig. 11. One-to-one mapping between geon primitives and 2D silhouettes used in Experiments 4 and 5.
UML diagrams, they do not allow us to make the generalization that it was the 3D aspect of geons that made the difference. There were many other differences between the 3D geon-based diagrams and 2D UML diagrams, in particular, the outline shapes of the elements used. Thus the results may be due to factors other than the use of shaded 3D primitives. The next two experiments specifically address the issue of whether shaded 3D components are more effective than 2D diagram components. Our experiments were designed to test the hypothesis that geon diagrams are easier to visually interpret and remember than diagrams that have elements with the same 2D outlined shapes. The one-to-one mapping between geons and 2D outlines of the shapes used for the experiments is shown in Figure 11. The fourth experiment was designed to test our ability to interpret these kinds of diagrams. To do this we measured the amount of time it takes a subject to identify a substructure in a diagram. We also measured the accuracy with which the user identified the substructure. The fifth and last experiment investigated the accuracy of recalling geon diagrams in comparison to 2D equivalents. 8. EXPERIMENT 4 : SUBSTRUCTURE IDENTIFICATION WITH GEON VERSUS 2D SILHOUETTE DIAGRAMS The purpose of this experiment was to determine the ease with which people can identify substructures in geon diagrams in comparison with equivalent 2D silhouette diagrams. We measured the time and error rate for a subject to recognize a substructure of a diagram. We hypothesized that it should be possible to identify substructures faster and more accurately with geon diagrams, in comparison to diagrams made from flat 2D shapes having the same outline shapes. 8.1 Method for Experiment 4 The method for this experiment was identical to that for Experiment 1. ACM Transactions on Computer-Human Interaction, Vol. 10, No. 1, March 2003.
Diagramming Information Structures
•
15
Fig. 12. Example of diagrams used for Experiments 4 and 5.
Fig. 13. Substructures to identify in Experiment 4.
8.1.1 Diagrams. Two sets of 10 2D silhouette diagrams were drawn using Adobe PhotoshopTM and equivalent sets of geon diagrams were constructed using the geon toolkit. Examples are shown in Figure 12. For each set a substructure diagram was constructed; the substructure of the first set contained 3 components and that of the second set contained 5 components (Figure 13). The diagrams included a variety of combinations of the primitives in each case. Neither set of diagrams was equipped with surface attributes or labels because we wanted to look only at the 2D versus 3D issue. Diagrams were presented on a computer screen. 8.1.2 Procedure. The procedure used for this experiment was identical to that used for Experiment 1. Subjects were first presented the substructure and subsequently had to indicate if the substructure was present in a series of ACM Transactions on Computer-Human Interaction, Vol. 10, No. 1, March 2003.
16
•
P. Irani and C. Ware Table II. Summary of Results of Experiment 4 Identification Time (s) Error Rate
Geon Diagram 4.1 12.11%
2D Silhouette 5.3 19.24%
larger diagrams. The 16 subjects were all computer science students who had not participated in previous studies. 8.2 Results of Experiment 4 Results are summarized in Table II. These show that substructures were identified both faster and more accurately than the geon diagrams. Of the 16 subjects, 9 correctly identified the substructure in more geon than 2D silhouettes, 3 subjects identified the substructure equally often with the geon diagrams as with the 2D silhouettes, and the remaining 4 were more accurate with the 2D silhouettes. A sign test shows this to be significant ( p < 0.1). On average the subjects took 4.1 seconds to identify (correctly or incorrectly) the presence of the substructure in the geon diagram and 5.3 seconds for the 2D silhouettes. Of the set of 16 subjects, 14 identified the geon substructure faster than the 2D substructure. A t-test on the average time for each subject shows this difference to be significant ( p < 0.005). 9. EXPERIMENT 5: RECALL OF GEON VERSUS 2D SILHOUETTE The purpose of this experiment was to determine whether geon diagrams could be remembered more easily than 2D silhouette diagrams. We hypothesized that geon diagrams might be more accurately recalled after a brief exposure than comparable 2D diagrams. 9.1 Method for Experiment 5 The method was the same as for Experiments 2 and 3. 9.1.1 Diagrams. Using our one-to-one mapping convention of geons to 2D shapes, a set of 14 geon diagrams was produced using the geon toolkit and a set of equivalent 2D silhouettes was drawn using Adobe PhotoshopTM . Both sets of diagrams were printed in black and white on 8.5 by 11 inch transparencies. 9.1.2 Procedure. The experiment was conducted using two groups of students in senior-level courses. The experiment was performed in a classroom setting with a class of students who had not seen these diagrams before (if a student had performed a similar experiment in a previous lecture, he or she was asked to indicate that on the handout and the result was later discarded). At the beginning of the lecture the students in the first group were shown half (7) of the set of geon diagrams in random order for 15 seconds per diagram. After viewing the first half of the geon diagrams, they were then presented with 7 2D silhouette diagrams at intervals of 15 seconds. At the end of the lecture, approximately 50 minutes later, the students were shown the full set of 14 geon ACM Transactions on Computer-Human Interaction, Vol. 10, No. 1, March 2003.
Diagramming Information Structures
•
17
diagrams, then 14 2D silhouettes. Each diagram was shown for 10 seconds and the subject indicated on a printed sheet whether that diagram had been part of the initial set. To counterbalance the first set of results, the same procedure was applied to a second set of students with the 2D silhouette diagrams being presented first and the geon diagrams second. There were 15 students who participated where the geon diagrams were presented first and 19 students that participated with the 2D silhouettes presented second giving a total of 34 subjects. 9.2 Results of Experiment 5 The results show that subjects made fewer errors in recalling geon diagrams than they did for the equivalent 2D silhouettes: there was a 21.7% error rate for the geon diagrams versus 31.2% for the 2D silhouettes. From the 34 subjects, 25 recalled correctly more geon than 2D diagrams, 4 recalled correctly the same number of geon diagrams as 2D silhouette diagrams, and 5 subjects recalled correctly more 2D silhouette diagrams. A sign test shows this difference to be significant (p < 0.05). These results favor the hypothesis that geon diagrams are easier to remember than their equivalent 2D silhouette diagrams. 10. CONCLUSION We have argued that 3D diagrams using geon primitives may provide a better input to processes that occur in human object recognition and because of this they should be easier to interpret and remember. Our experiments generally support this hypothesis. Experiment 1 showed that users are quicker in identifying the geon substructure in comparison with an identically structured UML diagram. Experiment 2 showed that geon diagrams are much easier to remember than UML diagrams, however, the use of color and texture might have accounted for this advantage as much as the use of 3D primitives. For Experiment 3 the geon diagrams were not equipped with any surface attributes and, to make them equivalent, the UML diagrams did not contain any labels to distinguish the objects. The only relevant factor of this experiment was the use of shaded 3D primitives. Results from this experiment also showed that users are able to better memorize the structure of the diagrams constructed using geon primitives. The first three experiments suggest that UML diagrams can be improved but do not allow us to claim to have demonstrated, in any rigorous way, that the use of 3D primitives is the key factor. One factor that might have been important is that we mapped the text labels of the UML diagrams to color and texture codes. This may have possibly reduced the cognitive load, although we are aware of no prior research showing that interpreting text labels requires more cognitive resources than color coding. The fourth and fifth experiments specifically compared 2D versus 3D diagram primitives. Although the results are not quite as dramatic as the comparison with UML, the 3D diagrams result in substantially higher performance. This supports the hypothesis that structures defined with the 3D shaded geon primitives are easier to identify ACM Transactions on Computer-Human Interaction, Vol. 10, No. 1, March 2003.
18
•
P. Irani and C. Ware
and remember than equivalent 2D primitives because they better stimulate the object identification mechanisms in the brain. There is much research to be done. Biederman’s theory claims that the geon structural description is rich; for example, connection relations between geons such as “to-the-left-of,” “on-top-of,” are perceived as different. This information should also be included in the mapping of data semantics to geon diagrams. The mapping of data attributes to color, texture, and possibly transparency, also deserves investigation. Another issue that must be addressed when using geon diagrams is how to effectively label the relationships and nodes. Text is an important part of most diagrams. Ways must be found to display text effectively on geon structures. Although our results strongly support the use of 3D shape primitives in diagrams, there are inevitable trade-offs. They may not be as compact, and so conventional line and box diagrams may be better if the information structure is large. Conventional line and box diagrams may also be more compatible with the use of the text that is a component of most diagrams. Text fits easily inside a box but may be less clear wrapped around a 3D shaded surface. However, these trade-offs remain to be explored. Aside from the research presented here, another reason to be positive about the future of 3D diagrams is that a partially 3D style of diagramming is already appearing in popular literature such as business and science magazines. Rectangular boxes and circles are giving way to shaded cylinders and spheres. As discussed in the Introduction, 3D bar and pie charts appear to confer no real benefits [Lee and MacLachian 1986; Carswell et al. 1991]. However, our results suggest if structural links between the 3D elements are important, then the use of 3D shapes may make the information more easily understood. REFERENCES BARFIELD, W. AND ROBLESS, R. 1989. The effects of two- and three-dimensional graphics on the problem-solving performance of experienced and novice decision-makers. Behav. Inf. Technol. 8, 369–385. BERTIN, J. 1981. Graphics and Graphic Information Processing. de Gruyter, Berlin. BIEDERMAN, I. 1987. Recognition-by-components: A theory of human image understanding. Psychol. Rev. 94, 2, 115–147. BIEDERMAN, I. AND GERHARDSTEIN, P. C. 1993. Recognizing depth-rotated objects: Evidence and conditions for three-dimensional viewpoint invariance. J. Exper. Psychol. Hum. Perception Perform. 19, 1162–1182. BIEDERMAN, I. AND GEHARDSTEIN, P. C. 1995. Viewpoint-dependent mechanisms in visual object recognition: Reply to Tarr and Bulthoff (1995). J. Exper. Psychol. 21, 6, 1506–1514. BOWER, G. H., CARLIN, M. B., AND DUEK, A. 1995. Comprehension and memory for pictures. Memory Cogn. 3, 2, 216–220. CARSWELL, C. M., FRANKENBERGER, S., AND BERNHARD, D. 1991. Graphing in depth: Perspectives on the use of three-dimensional graphs to represent lower-dimensional data. Behav. Inf. Technol. 10, 6, 569–474. EDELMAN, S. 1995. Representation of similarity in 3D object discrimination. Neural Comput. 7, 407–422. ENNS, J. T. AND RENSINK, R. A. 1990. Sensitivity to three-dimensional orientation in visual search. Psychol. Sci. 1, 5, 323–326. FOWLER, M. 1996. UML Distilled: Applying the Standard Object Modeling Language. AddisonWesley, Reading, Mass. ACM Transactions on Computer-Human Interaction, Vol. 10, No. 1, March 2003.
Diagramming Information Structures
•
19
HAHN, J. AND KIM, J. 1999. Why are some diagrams easier to work with? Effects of diagrammatic representation on the cognitive integration process of systems analysis and design. ACM Trans. Comput.-Hum. Interact. 6, 3, 181–213. HALVERSTON, J. 1992. The first pictures, perceptual foundations of Paleolithic art. Perception 21, 389–404. HAREL, D. 1995. On visual formalisms. In Diagrammatic Reasoning: Cognitive and Computational Perspectives, J. Glasgow, N. H. Narayanan, and B. Chandrasekaran, Eds. MIT Press, Cambridge, Mass., 235–272. IRANI, P. AND WARE, C. 2000. Diagrams based on structured object perception. In Proceedings of Advanced Visual Interfaces AVI’2000 (Palermo, Italy, May), 61–67. HUMMEL AND BIEDERMAN, I. 1992. Dynamic binding in a neural network for shape recognition. Psychol. Rev. 99, 480–517. KOFFKA, K. 1935. Principles of Gestalt Psychology. Harcourt, New York. KOSSLYN, S. M. 1994. Elements of Graph Design. W. H. Freeman, New York. LARKIN, J. H. AND SIMON, H. A. 1987. Why a diagram is (sometimes) worth ten thousand words. Cogn. Sci. 11, 65–99. LEE, J. M. AND MACLACHIAN, J. 1986. The effects of 3D imagery on managerial data interpretation. MIS Quart. (Sept.), 257–269. MARR, D. 1982. Vision: A Computational Investigation into the Human Representation and Processing of Visual Information. Freeman, San Francisco. MARR, D. AND NISHIHARA, H. K. 1978. Representation and recognition of the spatial organization of three-dimensional shapes. Proc. Roy. Soc. London, B 200, 269–294. PRESSMAN, R. S. 1992. Software Engineering: A Practitioner’s Approach. McGraw-Hill, New York. RAMACHANDRAN, V. S. 1988. Perception of shape from shading. Nature 331, 163–166. SCAIFE, M. AND ROGERS, Y. 1996. External cognition: How do graphical representations work? Int. J. Hum. Comput. Stud. 45, 185–213. TRIESMAN, A. 1980. Preattentive processing in vision. Comput. Vis. Graph. Image Process. 31, 156–177. ULLMAN, S. 1989. Aligning pictorial descriptions: An approach to object recognition. Cognition 32, 193–254. WARE, C. AND FRANCK 1996. Evaluating stereo and motion cues for visualizing information nets in three dimensions. ACM Trans. Graph. 15, 2, 121–140. WARE, C. 2000. Information Visualization: Perception for Design. Morgan Kaufman, San Mateo, Calif. WATSON, C. J. AND DRIVER. R. W. 1983. The influence of computer graphics on the recall of information. MIS Quart. (March), 45–53. ZHANG, J. 1997. The nature of external representation in problem solving. Cogn. Sci. 21, 2, 179– 217. Received February 2001; revised April 2002; accepted September 2002
ACM Transactions on Computer-Human Interaction, Vol. 10, No. 1, March 2003.