Donatello Materassi Murti V. Salapaka. AbstractâThere is extensive literature on the description of joint probability distributions via graphs, where each node.
2016 American Control Conference (ACC) Boston Marriott Copley Place July 6-8, 2016. Boston, MA, USA
Graphoid-based methodologies in modeling, analysis, identification and control of networks of dynamic systems Donatello Materassi
Murti V. Salapaka
Abstract— There is extensive literature on the description of joint probability distributions via graphs, where each node represents a random variable and the edges describe a form of coupling among the variables. The connections in these graphical models do not necessarily represent forms of input/output relations among the variables involved. Instead, they typically represent a convenient factorization of their joint probability distribution. For these factorizations to be mathematically meaningful, the underlying graph structure is required to have no directed cycles. Thus, graphical models of random variables typically deal with directed acyclic graphs (DAGs). Conversely, in the area of dynamic systems, and especially control theory, it is common to find network models involving stochastic processes that influence each other according to a directed graph. In this case the graph connections do indeed represent a input/output relations and feedback loops may be present, as well. As a consequence, the network structures underlying graphical models of random variables and networks of dynamic systems differ fundamentally. Furthermore, it is not a straightforward task to unify or reconcile these two semantically different graph descriptions. Indeed, introducing a notion of factorization in networks of dynamic systems would present technical difficulties due not only to the potential presence of loops, but also to the fact that stochastic processes involve an infinite number of random variables. Despite these differences, it has become evident during recent years that methodologies can be borrowed from probabilistic graphical models and used for the analysis, identification and control design in the domain of networks of dynamic systems and viceversa. Some of these methodologies can be imported with no significant modifications, while others need to be substantially revisited. This article is an attempt to bridge the conceptual and methodological gap between graphical models of random variables and networks of dynamic systems, creating a single unified language and theoretical framework for these two different classes. This is achieved by drawing parallels between similar approaches and highlighting their main differences.
I NTRODUCTION Graph theory has a widespread use as a modeling tool in science. Graphs are commonly used to explain complex multivariate phenomena in terms of correlation, statistical dependence and also causal connectivity among their different parts. We find examples in many areas, such as Economics (see e.g. [1], [2]), Sociology (see e.g. [3]) Biology (see e.g. [4], [5], [6]), Cognitive Sciences (see e.g. [7]), and Geology (see e.g. [8], [9]). A prevalent semantic for the description of networks is provided by graphs in which nodes typically represent distributed entities and edges represent a notion of dependence Murti Salapaka is with Department of Electrical and Computer Engineering, University of Minnesota. Donatello Materassi is with Department of Electrical Engineering and Computer Science, University of Tennessee.
978-1-4673-8682-1/$31.00 ©2016 AACC
or influence. Two approaches making an extensive use of this semantic are the graphical model approach (see for example [10], [11], [12], [13]) and the system theoretic approach (see for example [14], [15], [16], [17], [18], [19]). Under the graphical model approach each entity is modeled as a random variable while the underlying graph describes the sparsity pattern of a factorization of the joint probability distribution into the product of conditional distributions of lower order. Within this framework, since the graph has to describe a recursive factorization, no cycles can be present. Also, dealing with random variables, the time variable is usually not taken into account within this formalism. Under the system theoretic framework, mostly developed by control and communication researchers, entities are seen as “black boxes” processing input signals in order to provide output signals. Since the output of each entity is the potential input of another, the graph that describes the input/output structure of the whole system is usually taken as the graphical representation of the network. Within the system theoretic framework, the relations of the various entities are generally defined using dynamic operators (i.e. integrators, delays, transfer functions) necessarily requiring an underlying notion of “time”. Also, feedback loops are common since regulating mechanisms could indeed be present. Remarkably, despite these differences, both approaches tend to share similar problems, theoretical frameworks, and methodologies [20]. Indeed, many statistical and probabilistic methodologies have been developed in order to understand the causal effect of a random variable on another given the partial knowledge of a graphical model [21], [22], [23]. However most of these techniques rely on the fact that the underlying graphical representation of the network has no cycles. The main contribution of this article is to bridge the conceptual and methodological gap between graphical models of random variables and networks of dynamic systems creating a single unified language and theoretical framework for these two different classes of models. This is achieved by drawing parallels between similar approaches and highlighting the main differences. The paper is articulated in six main sections. Section I describes the main semantic differences between graphical models of random variables and networks of dynamic systems. Section II illustrates how similar methods provide exact guarantees on the reconstruction of tree-like networks both in the graphical model approach and the dynamic graph approach. Section III shows how the results of Section II generalize to the case where not all the nodes are observables. Section IV introduces the basic notion of d-separation
4661
in graphs, its use in the theory of graphical models and shows how such a concept can be adapted to networks of dynamic systems. Section V discusses advanced structure identification algorithms derived from the properties of dseparation for the reconstruction of directed acyclic graphs and provides fundamental limits to the classes of structures that can be identified. Section VI is about the identification of individual transfer functions in networks of dynamic systems with partially known structure extending the notion of dseparation to networks with loops. I. D IFFERENCES IN SEMANTICS BETWEEN NETWORKS OF RANDOM VARIABLES AND NETWORKS OF DYNAMIC SYSTEMS
The main goal of this section is to highlight the main differences between the representation of a joint probability distribution of random variables via a graph and the connection structure of a network of dynamic systems. A. Graphical representations of random variables The allocation of memory to store a joint probability distribution p(x1 , ..., xn ) of n random variables x1 , ..., xn requires, in general, an amount of space that grows exponentially with the number of considered variables. Indeed, if each random variable xi , for i = 1, ..., n, can assume r different values, storing the joint probability distribution p requires the storing of rn distinct values. If it is known that the n variables are statistically independent, the jointQprobability n distribution can be written as p(x1 , ..., xn ) = i=1 pi (xi ) where pi (xi ) is the probability distribution of the individual random variable xi . In this case the joint probability p can be stored using only nr numbers, namely the probabilities of the r values for each of the n random variables. Then, the value of p(x1 , ..., xn ) can be recovered by multiplying the stored values pi (xi ), for i = 1, ..., n. However, it is desirable to consider other forms interdependence among the variables whose description can be efficiently stored. For example, Chow and Liu [24] were interested in probability distributions that could be written, apart from a possible appropriate reordering of the variables x1 , ..., xn , according to the factorization p(x1 , ..., xn ) = p1 (x1 )
n Y j=2
pj|i(j) (xj |xi(j) )
(1)
where i(·) is a function that maps each element of {2, ..., n} into {1, ..., n − 1} with the property that i(j) < j and pj|i(j) (xj |xi(j) ) denotes the conditional probability of xj given xi(j) . If a probability distribution admits a factorization of the form (1), it can be efficiently stored by using only the conditional probability distribution of the variable xj given the variable xi(j) (a second order statistic) for j > 1, and the marginal probability distribution of x1 . For such a factorization, xi(j) is also called the parent of the variable xj because of the graphical interpretation that given to Equation (1). Indeed, a graph can be defined where the nodes are the variables x1 , ..., xn and there is a directed link from xi(j) to xj for all j 6= 1. It is easy to show that since i(j) < j for
all j > 1, the resulting graph is a rooted tree with root in x1 . Definition 1: A rooted tree is a directed graph which is a tree and where each node has exactly one parent with the exception of one node that is called root. More generally, a joint probability distribution p(x1 , ..., xn ) of n random variables x1 , ..., xn can always be factorized as n Y p(x1 , ..., xn ) = p1 (x1 ) pj|P (j) (xj |xP (j) ) (2) j=2
where this time P (j) ⊆ {1, ..., j − 1}, xP (j) := {xi |i ∈ P (j)} and the pj|P (j) (xj |xP (j) ) denotes the conditional probability of xj given the set of variables xP (j) . In this case each variable xj , for j > 1, has a set of parents xP (j) . Again, it is possible to associate a graph to the factorization (2) where each variable xj , for j = 1, ..., n, is a node in the graph and there are edges from each element of xP (j) to the node xj , for j > 1. Since P (j) ⊆ {1, ..., j −1}, the resulting graph has no directed loops, namely it is a directed acyclic graph. As it can be easily verified, the sparsity of the graph associated with a factorization directly relates with the amount of memory necessary to store the joint probability distribution p(x1 , ..., xn ). At the same time, notice that for the same probability distribution p(x1 , ..., xn ) it is possible to generate many different factorizations (for example by reordering the random variables) that represent different possible graphs of p. Each such graph is said to be compatible with p. Thus, this representation does not assume a unique underlying generative model for the data. Instead, many models are compatible with the specific probability distribution in consideration. In this respect, we stress that the edges in the representation of a graphical model do not necessarily have any form of causal meaning. B. Networks of dynamic systems: Dynamic Influence Models (DIMs) In contrast to the previous classes of models for joint probability distributions of random variables, the semantics behind networks of dynamic systems is quite different. Indeed, here most models of networks assume that data are being generated by a unique interconnection graph that represents the actual input/output (or influence) relations among the different parts of the system. Within this framework directed cycles in the structure are typically allowed in order to describe feedback loops. Furthermore, in the domain of dynamic system the involved variables are random processes rather than simple random variables. First, consider a scenario where, for two processes xi , xj with i, j ∈ {1, ..., n} and i 6= j, the sequence xj is a function of the sequence xi , described by xj (t) = fj (t, ej (·), xi (·))
for all t.
(3)
In (3) the stochastic process xj is determined by the map fj where xj at time t can depend on, the past, present and potentially future of xi , and on the external sequence ej (·)
4662
which represents a form of autonomous behavior for xj . Furthermore, fj can depend explicitly on time t. The timedependence can accommodate two qualitative behaviors: one where there is a structural change in the interconnection of the various agents, where fj switches from being present to absent and second where the function depends continuously on the time variable t which can be used to model, for example, systems that involve periodic or cyclostationary signals. More generally, a set Pj ⊆ {1, ...n} of agents may influence the agent j where xj (t) = fj (t, ej (·), xPj (t) (·)),
for all t
(4)
where xPj (t) (·) denotes the sequences associated with the agents of the set Pj (t). The set Pj ≡ Pj (t) can change with time and thus (4) can accommodate a qualitative change in the structure of the interconnection between various agents. By considering relations of the form (4) for all agents j = 1, ..., n, we have obtained the mathematical description of n subsystems influencing each other. Since the sequences ej , for j = 1, ..., n are introduced to represent the autonomous behavior of the sequences xj , for j = 1, ..., n, it is also natural to assume that the sequences ej are independent from each other in some sense yet to be defined. This motivates the following definition for a class of dynamical systems, named Dynamic Influence Models. Definition 2: (Dynamic Influence Models (DIMs)) Consider a space E of sequences with values in Ω parametrized by the time variable t. Let E be equipped with a notion of inner product. A Dynamic Influence Model is defined as a 3-ple ({ej (·)}nj=1 , {Pj (t)}nj=1 , {fj (·, ·, ·)}nj=1 ) where n • {ej (·)}j=1 is a set of n sequences in E n • {Pj (t)}j=1 are n subsets of {1, ..., n} such that j ∈ / Pj (t) for all t. n • {fj (·, ·, ·)}j=1 are n functions defining the dynamics of the system xj (t) = fj (t, ej (·), xPj (t) (·))
(5)
for all t, and for j = 1, ..., n. Also, if the sequences {ej (·)}nj=1 are mutually orthogonal according to the inner product of E we say that the Dynamic Influence Model is “unconfounded”. Every Dynamic Influence Model admits an immediate graphical representation in terms of a standard oriented graph [25], as provided by the following definition. Definition 3 (Associated Graph): Given a Dynamic Influence Model({ej (·)}nj=1 , {Pj (·)}nj=1 , {fj (·, ·, ·)}nj=1 ), its associated graph at time τ is an oriented graph (V, E(τ )) where the set of nodes V is the set {x1 , ..., xn } and the set of edges E has the property that the oriented edge (xi , xj ) ∈ E(τ ) if and only if i ∈ Pj (τ ). As evident from the definition in the associated graph, there is an edge from xi to xj if and only if the agent i influences directly the agent j. The definition of DIMs and associated graphs includes cases where the associated graph is not static, but instead evolves with time. If E(·) does not change with time, the graph structure is time-invariant. Most results in
the scientific literature assume a generative model given by an unconfounded time-invariant DIM defined by linear operators. Under these assumptions we say that the DIM is a Linear Dynamic Graph. Definition 4 (Linear Dynamic Graph): A Linear Dynamic Graph G is defined as a pair (H(z), e) where T • e = (e1 |...|en ) is a vector of n related random vector processes e1 , ... en of dimensions n1 , ..., nn respectively with N = n1 + ... + nn , such that Φe (z) is block diagonal, namely Φei ej = 0 for i 6= j. The vector of positive integers (n1 , ..., nn ) is the “partition” of the LDG. • H(z) is a N × N transfer matrix partitioned in n × n blocks such that Hji is of dimension nj × ni for i, j ∈ {1, ..., n}. H(z) is termed as the “dynamics” of the LDG. n The output vector Pn processes {xj }j=1 of the LDG are defined as xj = ej + i=1 Hji (z)xi , or in a more compact way x(t) = e(t) + H(z)x(t)
(6)
where x = (x1 |...|xn )T . Observe that the graphical representation of a LDG provides partial information about the blocks of the matrix Hji (z) that are identically zero. Indeed, if (i, j) ∈ / E then Hji (z) is definitely zero. Since the dynamics of both DIMs and LDGs rely on implicit relations, a form of well-posedness has to be guaranteed in order for the dynamic systems to have welldefined trajectories. For LDGs, which are going to be the main scope of this article, the well-posedness condition is an immediate consequence of Mason’s rule [26]. Definition 5: A LDG G is well-posed if I − HII (z) is invertible for every set of indeces I ⊆ {1, ..., n} and HII (z) is the submatrix of H(z) obtained by selecting the entries (i1 , i2 ) of H(z) for i1 , i2 ∈ I. Thus, for both graphical models of random variables and for networks of dynamic systems it is possible to associate a directed graph. In the case of graphical models of random variables it represents the factorization of a joint probability distribution, while in the case of networked systems it represents input/output relations. In the following, for the case of structure identification of both graphical models and networked systems, we will rely on the notion of skeleton of a directed graph. Definition 6: The skeleton of a directed graph G is the graph obtained by removing the orientation from all its edges. II. F ULLY OBSERVABLE NETWORKS WITH POLYTREE STRUCTURE
This section explores the analogies between the following two problems: • determining an optimal approximation of a joint probability distribution with a probability distribution that admits a rooted tree factorization • identifying the structure of a network of dynamic systems under the assumption that it has a tree configuration.
4663
The first problem belongs to the domain of graphical models of random variables, has been considered in [24] and revisited in [10] under a more modern approach. The second problem is formulated in [27] for applications in networks of financial systems. We will show that in both cases a distance function can be defined in order to evaluate the “closeness” of two nodes of the graph so that the Minimum Spanning Tree (MST) [25] computed according to such a distance as a weight for the graph edges provides the solution of the problem. A. Chow-Liu approximation for a probability distribution function Given a nominal probability distribution p(x1 , ..., xn ) Chow and Liu provide an algorithm to find a probability distribution p(x1 , ..., xn ) with minimal Kullback-Leibler divergence from p such that, apart from a reordering of the variables, it can be factorized according to (1). Thus, the joint probability function p(x1 , ..., xn ) is the optimal approximation of p(x1 , ..., xn ) with an associated graph that is a rooted tree. Chow and Liu’s algorithm is as follows: Chow-Liu Tree Algorithm 1) For all pairs (xi , xj ), define the distance
loss of generality, that x2 has the root x1 as its parent, we can apply Bayes theorem and obtain p1 (x1 )
n Y j=2
pj|i(j) (xj |xi(j) ) =
= p1 (x1 )p2|1 (x2 |x1 ) = p2 (x2 )p1|2 (x1 |x2 )
n Y j=3 n Y j=3
pj|i(j) (xj |xi(j) )
(9)
pj|i(j) (xj |xi(j) ).
(10)
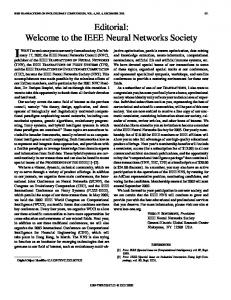
This last factorization has the same skeleton of the original one, but now the orientation of the link x1 → x2 in the associated graph has been reversed, as represented in Figure 1. Iterating this argument it is possible to move the root to any x1
x1 x2
(a)
x2
(b)
Fig. 1. (a) Graphical model associated with the factorization of Equation (9); (b) Graphical model associated with the factorization of Equation (10).
d(xi , xj ) := −I(xi , xj ) where I(·, ·) is the mutual information between xi and xj 2) Find the Minimum Spanning Tree associated with the distance d(·, ·) and let x1 be its root 3) For each node xj , with j > 1, let i(j) be the parent of i(j) according to the minimum spanning tree rooted in x1 4) The approximating probability distribution is p(x1 , ..., xn ) = p1 (x1 )
n Y j=2
pj|i(j) (xj |xi(j) )
(7)
where pj|i(j) (xj |xi(j) ) is the conditional distribution of xj given xi(j) . Theorem 7: Chow-Liu Tree Algorithm determines a probability distribution p(x1 , ..., xn ) that minimizes the KullbackLeibler divergenge � � Z dp dp (8) DKL (p|p) = log dp dp dp
where is the Radon-Nikodym derivative of the probability measure p with respect to the probability measure p. Furthermore, if 0 < I(x1 , x2 ) < H(x2 ) where H(x2 ) is the information entropy of x2 for all pairs (x1 , x2 ), all the optimal probability distributions p(x1 , ..., xn ) have the same skeleton. Proof: See [24] or [10]. Observe that the choice of the node x1 as root is arbitrary. Indeed, the root could be placed in any other node obtaining an equally optimal approximation. Assuming, without any
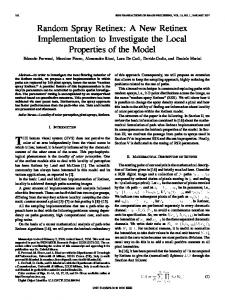
other node. Also, observe that if the nominal probability distribution p(x1 , ..., xn ) already admits a factorization with an associated graph that is a rooted tree, Theorem 7 guarantees that Chow-Liu algorithm will determine a factorization with the same undirected structure (skeleton). Rebane and Pearl have shown another interesting property of Chow-Liu Tree Algorithm related to polytree structures (directed trees with multiple roots). Definition 8: A polytree is a directed graph such that its skeleton in an undirected tree. The difference between a rooted tree and a polytree is highlighted is Figure 2. Rebane and Pearl have shown that,
(a)
(b)
Fig. 2. (a) A rooted tree has a single root (in gray). The choice of the root determines the directions of all edges in the graph. (9); (b) A polytree is a tree with directed edges, thus it can have multiple roots (in gray).
if the nominal probability distribution p(x1 , ..., xn ) admits a factorization with an associated graph that is a polytree, the skeleton of the associated graph of p(x1 , ..., xn ) matches the skeleton of the associated graph of the Chow-Liu approximation [28]. Thus, in the more general case of polytrees, the Chow-Liu Tree Algorithm does not necessarily produce an approximating probability distribution p that is equivalent to p. However, the skeletons of the two factorizations match.
4664
B. Reconstruction of networks with polytree structure from data The problem of reconstructing a tree structure from empirical data is considered in several scientific areas. For example, the Unweighted Pair Group Method with Arithmetic mean (UPGMA) [29] is one of the first techniques proposed to reveal an unknown tree topology. It is also applied to the reconstruction of phylogenetic trees, but it has also been widely employed in other areas such as communication systems and for resource allocation. UPGMA consistently identifies a tree topology relying on the observation of the leaf nodes only, theoretically guaranteeing a correct identification, but only on the assumption that an ultrametric is defined among the leaves. Definition 9: A metric d(·, ·) is an ultrametric if d(x1 , x2 ) = max{d(x1 , x3 ), d(x3 , x2 )} for all x3 in the metric space. The strength of this assumption can be immediately recognized by considering that in an ultrametric space all the triangles are necessarily isosceles. In this respect it is worth underlining that such a hypothesis is not verified in most situations and is not practical to verify it for large networks. A technique for the identification of a network for a tree topology is described in [30] for the analysis of a stock portfolio. The authors identify a tree structure which is obtained defining a metric based on the correlation index among the time-series and employing a Minimum Spanning Tree algorithm to obtain the final topology. Thus, this technique resembles Chow-Liu approach. However, in [31] a severe limit of this strategy is highlighted for the reconstruction of networks of dynamic systems in the form of LDGs. Indeed, the methodology in [30] fails to identify a network with a tree topology in the presence of dynamical connections or even simple delays among the processes. In [27] theoretical guarantees are provided for the correct reconstruction of the skeleton of a LDG with a rooted tree structure. The result is the following Theorem 10: Consider a LDG T with a rooted tree structure and scalar processes x1 , ..., xn . Define the metric d(·, ·) on its processes as �1/2 � Z π � 1 1 − Cxi xj (ω) dω (11) dcoh (xi , xj ) = 2π −π
via a Wiener filter. Let us consider two wide sense stationary zero-mean stochastic processes xi , xj and let Wji (z) be a single input single output (SISO) transfer function. Consider the problem of estimating xj by filtering xi according to the quadratic cost � � E (εQ )2 , (12) where εQ := Q(z)(xj − Wji (z)xi ) and Q(z) is an arbitrary stable transfer function weighting the error eji := xj − Wji (z)xi . ˆ ji (z) that miniThe computation of the transfer function W mizes the quadratic cost (12) is a well-known problem in scientific literature and its solution is referred to as the Wiener filter [32]. Proposition 11 (Wiener filter): Consider two wide sense stationary zero-mean stochastic processes xj and xi . The Wiener filter modeling xj by xi is the linear stable filter ˆ ji minimizing the filtered quantity (12). Its expression is W given by ˆ ji (z) = Φxi xj (z) W Φxi (z)
(13)
and it does not depend upon Q(z). For any SISO timediscrete transfer function G(z) and for any frequency ω ∈ < it holds that ˆ ji (ω)Φx x (ω)+ Φxj (ω) − W i j ∗ ˆ ˆ ji (ω)Φx (ω)W ˆ ji (ω)∗ ≤ − Φxj xi (ω)Wji (ω) + W i ≤ Φxj (ω) − G(ω)Φxi xj (ω)+
− Φxj xi (ω)G(ω)∗ + G(ω)Φxi (ω)G(ω)∗ . Moreover, the minimized cost is equal to � � min E ε2Q = Z π � 1 |Q(ω)|2 Φxj (ω) − |Φxj xi (ω)|2 Φ−1 = xi (ω) dω 2π −π and the corresponding error
where
ˆ ji (z)xi eˆji := xj − W
|Φxi xj (ω)|2 Cxi xj (ω) := Φxi (ω)Φxi (ω)
is not correlated with xi , i.e.
is the coherence function, Φxi xj (ω) is the cross-spectral density of xi and xj , and Φxi (ω) and Φxj (ω) are the spectral densities of xi and xj respectively. If 0 < dxi ,xj < 1 for all xi and xj , the MST obtained using the metric d(·, ·) is unique and provides the skeleton of T . Thus, Theorem 10 provides a reconstruction strategy that is analogous to the one provided by the Chow-Liu algorithm, but makes use of a different weighting function for the determination of the MST. The weighting function used in Theorem 10 admits an interpretation in terms of estimation
Φeˆji xi (ω) = 0 . (14) Proof: See [33], [32]. Notice that the Wiener filter can be easily computed from observed data, just by estimating the proper spectral densities under the assumption that the involved signals are wide sense stationary and ergodic in the covariance. Since the weighting function Q(z) does not affect the Wiener filter, but only the energy of the filtered error εQ , we can exploit the degree of freedom provided by Q(z) in order to operate a normalization with respect to the energy of
4665
the signals. Let us choose Q(z) equal to Fj (z), the inverse of the spectral factor of Φxj (z), that is Fj−1 (z)(Fj−1 (z))∗
Φxj (z) =
.
(15)
It is worth recalling that Fj (z) is stable and causally invertible [32]. Therefore, the minimum of cost (12) assumes the value � Z π � |Φxj xi (ω)|2 1 2 1− dω . (16) min E[εFj ] = 2π −π Φxi (ω)Φxj (ω) Observe that, due to such a choice of Q(z), the cost turns out to explicitly depend on the coherence function of the two processes: Cxi xj (ω) :=
|Φxj xi (ω)|2 . Φxi (ω)Φxj (ω)
(17)
Thus, in the case of linear dynamic systems, the reconstruction of the network skeleton is guaranteed by applying a strategy analogous to Chow-Liu algorithm where the Kullback-Leibler divergence is replaced by the metric (11) that is based on Wiener estimation. Another remarkable analogy with the Chow-Liu algorithm is that the same Wiener-based metric guarantees the reconstruction of a polytree network, as well. Indeed, [34] provides the following result that is a generalization of Theorem 10 to polytrees. Theorem 12: Consider a LDG T with processes x1 , ..., xn . Let the associated graph of T be a polytree. Define the metric d(·, ·) on its observed processes as �
1 dcoh (xi , xj ) = 2π
Z
π
−π
� 1 − Cxi xj (ω) dω
�1/2 .
(18)
The MST obtained using the metric d(·, ·) is unique and provides the skeleton of T . Proof: See [34]. Figure 3 schematically represent the general procedure of structure identification for both graphical models of random variables and networks of dynamic systems: a polytree is assumed as the underlying structure, a complete graph is defined with edges weighted according to an appropriate distance and the extracted MST consistently recovers the skeleton of the structure. Observe that, similarly to the
→
(a)
→
(b)
(c)
Fig. 3. (a) A polytree is assumed as the underlying structure. (b) A complete graph is defined with edges weighted according to an appropriate distance. (c) The extracted MST consistently recovers the skeleton of the structure.
application of the standard Chow-Liu algorithm to joint probability distributions, Theorem 12 does not allow for the reconstruction of the link orientations.
C. An application to real data The result of an application of this reconstruction technique to financial data is represented in Figure 4, as provided in [35]. A collection of 100 stocks of the New York Stock Exchange has been observed for four weeks (twenty market days), in the lapse 03/03/2008-03/28/2008 sampling their prices every 2 minutes. The selected stocks are the first 100 stocks for trading volume according to the Standard & Poors Index. A single market session can be considered a time period sufficiently short to assume that the influence of trends and seasonal factors are negligible. Thus, in our analysis, we have followed the natural approach of dividing the historical series into twenty subperiods corresponding to single days. Then, we considered the sessions separately, i.e. we have computed the coherence-based distances (18) among the stocks for every single day. Finally, we have averaged such daily distances over the whole observation horizon and the related results have been exploited to extract the MST, providing the corresponding market structure. Every node represents a stock and the color represents the business sector or industry it belongs to as provide by Google Finance that is the source of the data. It is remarkable that the companies are quite reliably grouped according to their business sectors. III. PARTIALLY OBSERVABLE NETWORKS WITH POLYTREE STRUCTURE
In the previous section we have investigated how treelike structures (either of random variables or of dynamic systems) can be consistently reconstructed by defining an appropriate distance on the edges and using the MST as a selection strategy. The underlying assumption was that all the nodes of the network were accessible. However, an important issue is that in many scenarios it is not possible to obtain measurements from all the involved processes. Instead, some of the variables are latent. In this section we investigate how appropriate distance measures, with the property of being additive along the paths of the tree structure, can help in the reconstruction of the structure of a polytree network with latent nodes. A. Identification of rooted trees of Gaussian random variables with hidden nodes The case of a network of random variables with a rooted tree structure and hidden (latent) nodes is investigated in [10] and, more recently, in [36]. Definition 13 (Latent rooted tree): A latent rooted tree graphical model is a triplet (p(·, ..., ·), O, H). The set O and H are disjoint sets named respectively the set of observable variables and the set of the hidden variables. Let V := O∪H be the set of all variables. The joint probability distribution p is a probability measure defined on V with the property that it can be factorized according to a tree graph. The problem of reconstructing a latent rooted tree consists in determining the skeleton of the associated graph of the factorization only by knowing the probability distribution p marginalized with respect to the observable variables O, with no a-priori knowledge on the set H.
4666
HAL
BHI JPM
CL
AVP
AES
C
LEH
EXC CVX
SLB
GS NYX
COF
BAC
MS
PG AEP
COP
EP
F
MER AXP
BK
KO XOM ETR
WMB
GM
USB
WFC
ATI PEP
AIG
WB
SO BUD
AA
WY
ALL
RF
CVS FDX SLE
IP HNZ
HIG
DOW
HD
CI
UNH
DD KFT
UPS BNI MO
MCD
INTC
ROK
CSCO
TGT
JNJ
NSC CAT
COV
WMT
MSFT
CPB
CCU
CBS
ORCL
DELL
MRK HON
UTX
TXN
ABT GE
DIS
HPQ
BA PFE
CMCSA
MMM
IBM
XRX
RTN
MDT
EMC BAX
BMY
TWX TYC
AAPL
GD
S
GOOG T
VZ
AMGN
Fig. 4. The approximation of a network of 100 stocks of the Standard and Poors index as obtained in [35]. The technique quite reliably groups the companies according to their business sectors represented by the color code.
When all the random variables are jointly Gaussian, the sufficient and necessary conditions under which the skeleton of a latent rooted tree (of Gaussian random variables) can be successfully reconstructed by knowing the statistics of the observable nodes are described in [10]. These conditions amount to a notion of minimality of the tree. Definition 14 (Minimal latent rooted tree): A latent rooted tree is minimal if the following two conditions are met: 1) no pair of random variables is perfectly correlated or uncorrelated (that is (ρ − 1)ρ 6= 0, where ρ is the correlation coefficient of the two random variables) 2) each hidden variable, as represented in the graphical model, has at least degree 3, where degree is the total number of links associated with the node. A minimal rooted tree and a non-minimal rooted tree are illustrated in Figure 5(a) and Figure 5(b) respectively. For h1
1
3 4
5
6
h3
h2
3
2
h4
5
6
4 (a)
Fig. 5.
1
h3
h2
2
h1
(b)
(a) A minimal rooted tree. (b) A non-minimal rooted tree.
minimal latent rooted trees, [10] provides an explicit algorithm that guarantees the reconstruction of its skeleton using only the statistics of the observed variables. Such an algorithm is based on the existence of a distance that is additive along the paths of the graph. Definition 15: Let be d(·, ·) be a distance defined on n random variables x1 , ..., xn that are jointly Gaussian. Let
p(x1 , ..., xn ) be their joint probability distribution admitting factorization with associate graph T . Let T be a rooted tree. The distance d(·, ·) is additive along paths if the fact that xk is on the path from xi to xj implies that d(xi , xj ) = d(xi , xk ) + d(xk , xj ). A distance that is additive along paths can be defined using the logarithm of the inverse of the correlation index between two variables. Proposition 16: Consider a probability distribution p(x1 , ..., xn ) of n jointly Gaussian variables that admits a factorization represented by a rooted tree graph T . Let ρij be the correlation coefficient between xi and xj , for i, j ∈ {1, ..., n}. Define the distance dρ (xi , xj ) := − log(ρij ). Then, dρ (·, ·) is additive along the paths of T . For the definition of the algorithm it is necessary to introduce the notion of terminal node in a graph. Definition 17 (Terminal node): Given a polytree (or a rooted tree), we say that its node x is terminal if its degree is exactly one. Given a distance that is additive along paths, and two observable nodes xi and xj in a latent polytree with at least three observable nodes, it is possible to construct a test to check if xi is a terminal node of the graph and xj is the node directly connected to it. Proposition 18 (1-hop terminal test): Let xi , xj be two observable nodes. Define the quantity Ψikj = dρ (xi , xk ) − dρ (xk , xj ) for all k ∈ O. The node xi is terminal and is directly connected to xj if and only if
4667
Ψikj = dρ (xi , xj )
for all k ∈ O with k 6= i. The main intuition behind this test is represented in Figure 6(a). It is also possible to define a test to check if two
xk
xk d(xh , xk )
d(xj , xk )
xh
xj
B. Identification of latent LDGs with polytree structure
d(xj , xh )
xi
d(xi , xj )
xi
(a)
Theorem 20 (Reconstruction of minimal latent rooted trees): The Latent Rooted Tree Reconstruction Algorithm consistently reconstructs a minimal latent rooted tree of Gaussian variables. Proof: See [10]. The algorithms illustrated in [36] are based on the same ideas of Latent Rooted Tree Reconstruction Algorithm, but are more efficient in the reconstruction avoiding redundant tests.
d(xi , xh )
xj (b)
Fig. 6. (a) If the node xi is terminal and connected to xj , because of the additivity of the distance we have that d(xi , xk ) = d(xi , xj ) + d(xj , xk ) for all xk ; (b) If the nodes xi and xj are both terminal and connected to latent node xh , because of the additivity of the distance we have that d(xi , xk ) = d(xi , xh ) + d(xh , xk ) and d(xj , xk ) = d(xj , xh ) + d(xh , xk ) for all xk , implying |d(xi , xk ) − d(xj , xk )| = C < d(xi , xj ).
observable nodes xi and xj are both terminal and connected to the same hidden node xh . Proposition 19 (2-hop terminal test): Let xi , xj be two observable nodes in a latent rooted tree (p, O, H) and let d(·, ·) be a distance additive along paths. Define the quantity Ψikj = dρ (xi , xk ) − dρ (xk , xj ) for all k ∈ O. The nodes xi and xj are both terminal connected to xh ∈ H if and only if |Ψikj | = C < dρ (xi , xj ) for all k ∈ O with k 6= i. Also, dρ (xh , xk ) = dρ (xi , xk ) − [C + dρ (xi , xj )]/2 for all k ∈ O with k 6= i. The main intuition behind this test is represented in Figure 6(b). The algorithm for the detection of the skeleton of the rooted tree makes use of both the 1-hop terminal test and the 2-hop terminal test. Latent Rooted Tree Reconstruction Algorithm 1) Assign E := ∅, O := {x1 , ..., xno }, ` = 0, and V = ∅ 2) If there are only 2 nodes xi , xj in O a) add xi and xj to V b) add (xi , xj ) to E c) return the graph (V, E) 3) For all triplets xi , xj , xk ∈ O compute Ψikj 4) If 1-hop terminal test is positive for some xi and xj a) add (xi , xj ) to E b) move xi from O to V c) go to 2 5) If 2-hop terminal test is positive for some xi and xj a) ` ← ` + 1 b) add the new node xno +` to O c) compute d(xno +` , xk ) for al k ∈ O d) add (xi , xno +` ) and (xj , xno +` ) to E e) move xi and xj from O to V f) go to 2
Results in [37] provide an improved version of the Latent Rooted Tree Reconstruction Algorithm capable of reconstructing LDGs with polytree structure and hidden variables. Definition 21 (Latent rooted tree): A Latent Linear Dynamic Polytree (LLDP) is a triplet (G, O, H). G is a linear dynamic graph with an associated graph that is a polytree. The set O and H are disjoint sets named respectively the set of observable variables and the set of the hidden variables of the LLDP with the property that V := O ∪ H is the set of processes of G. The problem of reconstructing the structure of a LLDP consists in determining the skeleton of its associated graph. The main difference between a polytree and a tree is in the fact that a polytree has multiple roots. However, for each root of a polytree it is possible to define a subtree. Definition 22 (Subtrees of a polytree): Given a polytree, the rooted tree given by a root of the polytree and all its “descendants” is a subtree of the polytree. A graphical representation of a polytree with three roots and the associated sub-rooted trees is given in Figure 7. Following [10], we extend the definition of minimality to
Fig. 7.
A polytree and the subtrees associated with its roots.
LLDPs (in this case the graph is directed and consists of stochastic processes). Definition 23 (Minimal Latent Linear Dynamic Polytree): A LLDP is minimal if the following three conditions are met • for all distinct processes xi , xj of the LLDP it holds that Z π 1 0< (1 − Cxi xj (iω))dω < 1 2π −π
4668
• •
each hidden node has degree (number of edges connected to the node) greater than or equal to 3 each hidden node has outdegree (number of edges with a tail end connected to the node) greater than or equal to 2
The Figure 8 show a minimal latent polytree and a nonminimal latent polytree.
1
2 h2
1
h1
4
5
h3
6
3
7 (a)
2 h2
determine the distance between every newly added hidden node xh and every other detected node xk in V using dh,k = di,k − [Ψijk + di,j ]/2
as in Proposition 19. for each node xi identified as terminal at this pass, update di,k = dk,i = dj,k = dk,j = +∞ for every xk such that dj,k dk,i < ∞. d) check if a pair (xi , xj ) is such that di,j < +∞, and dj,k = di,k = +∞ for every xk 6= xi , xj and in such a case connect them. Theorem 25: The Latent Polytree Reconstruction Algorithm consistently identifies the skeleton of a minimal LLDP using only second order statistics of the observable nodes. Proof: See [37]. •
5
h3
6
3 h1
4
•
7 (b)
Fig. 8. (a) A minimal latent polytree. (b) A non-minimal latent polytree (the node h1 has outdegree equal to 1).
The algorithm that is formulated in [37] is a generalization of [10] to the case of polytrees of dynamic systems using a distance that is additive along paths on a subtree of a polytree. Proposition 24: Consider a minimal LLDP T with processes x1 , ..., xn . Define the distance Z π � 1 dlogc (xi , xj ) := − log Cxi xj (ω) dω. 2π −π The distance dlogc (·, ·) is additive along paths when restricted to a subtree of the polytree T . Also, observe that dlogc (xi , xj ) > 0 if and only if there is a subtree containing both xi and xj . Another key point is that the tests defined in [10] and referred to in this article as the 1-hop and the 2-hop terminal tests only detect nodes that are terminal in a subtree of the polytree. In [10], a node identified as terminal can be “eliminated” from the set of nodes and the algorithm can be applied recursively on the remaining nodes. In the case of polytrees, this “elimination” procedure can not be performed because the node to be eliminated in one subtree could still have some edges that have not been detected linking it to other subtrees. Thus, the generalization of the Latent Rooted Tree Reconstruction Algorithm to the polytree case has to perform a “selective elimination” of a node only in certain subtrees. This is obtained in [37] with following algorithm by setting the distance of the node to be eliminated to +∞ only with the nodes of the subtree it has to be removed from. Latent Polytree Reconstruction Algorithm 1) Initialize V with the observed nodes V = {x1 , ...xno } 2) Initialize di,j ← dlogc (xi , xj ) for all pairs of observed nodes 3) Repeat, until the reconstructed topology is connected, a) Compute Ψijk = dik − djk for any triplet (xi , xj , xk ) b) Run the 1-hop test to determine if a pair (xi , xj ) is directly connected with xi being a terminal node in a subtree. In such a case redefine di,k = dk,i = +∞ for every k such that dj,k dk,i < ∞. c) Run the 2-hop test and determine if a pair (xi , xj ) is directly connected to a hidden node. In such a case • introduce the new detected hidden nodes xh in the graph with the detected edges
C. Parallels between the two scenarios In Section III-A we have described technique provided in [10] to reconstruct the skeleton of graphical model of random variables with associated graph given by a minimal latent rooted tree. In Section III-B we have described a similar technique to reconstruct the skeleton of network of dynamical systems with connectivity given by a polytree, as obtained in [37]. Both methodologies follow the same approach by defining an appropriate distance that is additive along paths. Furthermore, the same algorithm described in Section III-B could be modified to guarantee the reconstruction of graphical models of random variables with polytree factorization. Indeed, as it will be shown in the following, graphical models of random variables and networks of dynamic systems share a deeper algebraic structure, that will allow us to define methodologies that are effective in both scenarios. IV. N OTIONS OF SEPARATION IN GRAPHS The methodologies described so far to analyze and reconstruct a structure are exclusively limited to trees. Despite showing striking similarities with each other, we have still treated the two application domains of graphical models and of networks of dynamic systems separately. In this section we introduce notions of “irrelevance” and of “separation” that will allow us to unify the theory of structural identification under a single framework. Furthermore, we will be able to extend the class of identifiable structures from polytrees to directed acyclic graphs. A. From a distance to a notion of separation Both in the case of polytrees of random variables and in the case of polytrees of dynamic systems, the definition of an appropriate distance has proved to be a useful tool for the reconstruction of the skeleton of a structure using only data statistics. Now, we intend to generalize this perspective. First we introduce a graphical notion of separation for directed graphs [10]. Definition 26: (d-separation) Consider three disjoint set of vertices X, Z, Y in a directed graph. The set Z is said to d
4669
separate X and Y if every path between a pair of vertices, one from X and another from Y , meets at least one of the following conditions 1) the path contains a chain xi → xm → xj where xm ∈ Z. 2) the path contains a fork xm−1 ← xm → xm+1 with xm in Z. 3) the path contains an inverted fork (or collider) at xm given by xm−1 → xm ← xm+1 where neither xm nor its descendants belong to Z. If Z d-separates X and Y we write dSepG (X, Z, Y ) otherwise we write ¬dSepG (X, Z, Y ). Observe that d-separation represents just a relation among nodes in a directed graph. Given the importance of this notion in the following of this article, we illustrate it with some examples. If G is the graph of Figure 9, we have dSepG (1, {2, 4, 5}, 3), however ¬dSepG G(1, {2, 4, 5, 6}, 3) since the path 1, 2, 6, 3 is unblocked by the presence of the collider 6. Also, we have that dSepG (1, ∅, 9) because every path linking the nodes 1 and 9 passes through one of the two colliders in 7 and 8. For the same reason we have dSepG (3, ∅, 9). Furthermore, we have ¬dSepG (3, {7}, 9), ¬dSepG (3, {8}, 9) and ¬dSepG (3, {7, 8}, 9). Finally notice that dSepG (1, {3}, 9) and dSepG (1, {2, 4, 6}, 7), but ¬dSepG (1, {4, 6}, 7).
4 1
2 5
Fig. 9.
7 3 6
9 8
Graph used for the illustration of the notion of d-separation.
For a generic set with a finite number of elements we define a relation of “irrelevance” on triplets of disjoint sets and we provide this relation with a set of axioms. Definition 27 (Semi-graphoid): Consider the set V = {x1 , ..., xn }, with a relation of “separation” I(X, Y, Z) defined for 3-tuples of disjoint subsets of χ. The pair (V, I) is a semi-graphoid if the following properties are met • • • •
Symmetry: I(X, Z, Y ) ⇔ I(Y, Z, X) Decomposition: I(X, Z, Y ∪ W ) ⇒ I(X, Z, Y ) Weak union: I(X, Z, Y ∪ W ) ⇒ I(X, Z ∪ W, Y ) Contraction: I(X, Z ∪ Y, W ) and I(X, Z, Y ) ⇒ I(X, Z, Y ∪ W )
where X, Y, Z ⊆ V are three disjoint subsets. The relation I(X, Z, Y ) is read as “the set X is irrelevant for the set Y given the set Z in the model I”. Now, the main idea is to define a directed graph where the notion of d-separation implies the statements provided by the semi-graphoid I(·, ·, ·).
Definition 28 (I-graph): A directed graph G = (V, E) provides an irrelevance graph (or I-graph) on a semigraphoid (V, I) if every d-separation of vertices in the graph implies a separation in the model I. Thus dSep(X, Z, Y ) =⇒ I(X, Z, Y ). If removing any link from G creates a new graph that is not an I-graph anymore, G is called a minimal I-graph. We remark that a minimal I-graph need not capture all separations in the model I. To describe a situation where a graph G represent exactly the the separation in a semigraphoid we introduce the notion of faithfulness Definition 29: If for the graph G = (V, E) we have that I(X, Z, Y ) ⇔ dSep(X, Z, Y ), we say that G is faithful to I (or that G is a perfect map for I). The following theorem is a fundamental consequence of the algebraic structure provided by a semi-graphoid. Theorem 30 (Pearl-Verma Theorem): Consider a finite set V and an ordering on V given by x1 , . . . , xn . The sets Ai := {x1 , . . . , xi−1 } form the predecessors of xi in this order. Suppose P(i) ⊆ Ai separates xi from all other predecessors in the model I and P(i) is the smallest such set. Form a DAG by assigning as parents of xi all vertices in P(i) . Then, the DAG so created will be a minimal I-graph of the model I. Proof: The proof follows from [38]. Theorem 30 provides a constructive way of creating a Directed Acyclic Graph G from a relation I that satisfies the axioms of a semi-graphoid by following the steps 1) Consider any ordering x1 , . . . , xn of the elements in V. 2) Determine for each i the minimal subset P(i) ⊂ Ai where Ai = {v1 , . . . , vi−1 } such that I(xi , Pi , Ai ⊆ xi ) 3) Create a graph such that for each i, the only parents of xi are the elements of P(i) . Theorem 30 guarantees that G will be a minimal I-graph for I. B. Conditional independence and Wiener-projections induce semi-graphoids This section provides results that will allow to anchor graphical models of random variables and network of dynamic systems to the unifying theoretical framework provided by semi-graphoids. For joint probability distributions, we induce a notion of irrelevance by using conditional independence. Definition 31: Let X, Y and Z be disjoint subsets in a set of random variables. We say that X is conditionally independent from Y given Z if px,y|Z (x, y|Z) = p(x|Z)p(y|Z) for all x ∈ X and y ∈ Y . We denote this relation as ICI (X, Z, Y ). Such a notion of irrelevance is a semi-graphoid. Theorem 32: ICI (·, ·, ·) is a semi-graphoid. Proof: See [38].
4670
In the case of network of dynamic systems in the form of LDGs, the semi-graphoid will be induced by projections obtained using Wiener-filtering on the stochastic processes. We remind the multivariate formulation of the Wiener filter. Proposition 33: Let v and x1 , ..., xn be wide-sense stationary stochastic processes. Define x := (x1 , ...., xn )T and the space Q := {
n X i=1
Wi (z)xi |Wi (z) are transfer functions}.
Consider the problem inf kv − qk2
q∈Q
(19)
where k · k is derived from the inner-product < v, q >= E[v T q]. If Φx (eiω ) > 0, for ω ∈ [−π, π], then the solution vˆ ∈ X exists, is unique and is given by vˆ = W (z)x where W (z) = Φvx (z)Φx (z)−1 . Moreover, vˆ is the only element in Q such that, for any q ∈ Q, < v − vˆ, q >= 0. (20) This projection can be used to define a relation of irrelevance among triplets of subsets of stochastic processes in a LDG. Definition 34: Consider a LDG with processes V = {x1 , ..., xn }. Let X, Y, Z be three disjoint subsets of V . For every xi ∈ X let x ˆi|Z be the estimate of xi obtained by Wiener-filtering the processes Z. For every xi ∈ X let x ˆi|Z,Y be the estimate of xi obtained by Wiener-filtering the processes Z and Y . We say that Z Wiener-separates X and Y if x ˆi|Z,Y = x ˆi|Z and we write IW (X, Z, Y ). The relation IW (·, ·, ·) defined on a LDG is a semi-graphoid. Theorem 35: Let V be a set of stochastic processes of a LDG and let IW (·, ·, ·) be the separation relation induced by the Wiener-separation. (V, I) is a semi-graphoid. Proof: See [39]. In this way we have obtained a common framework for both graphical models of random variables and LDGs. In the next section we will explore several consequences of this unified formulation, in particular for the case of directed acyclic structures. V. R ECONSTRUCTION OF D IRECTED ACYCLIC G RAPHS , AND FUNDAMENTAL LIMITATIONS
The goal of this section is to use the theory of semigraphoids in order to replicate several powerful structure identification results for network of dynamic system that have already been obtained for standard graphical models. Specifically we will derive results for the reconstruction of the skeleton of a LDG with no feedback loops, along with fundamental limitations on the class of structures that can be identified.
Definition 36: We define a Linear Dynamic Directed Acyclic Graphs (LDDAG) as a LDG with an associated graph that has no directed cycles. First observe that the graph underlying a LDDAG satisfies the following property. Theorem 37: The associated graph G of a LDDAG G = (H(z), e) is an I-graph for the semi-graphoid generated by the processes of G under Wiener-separation. Proof: Since G is a DAG, it defines a partial order on the processes where a node is a predecessor of another it is one of its ancestors. Define a global order V = {x1 , ..., xn } that is compatible with the partial order determined by G. For every xi define B(i) as the parents of xi . Observe that IW (xi , B(i) , {x1 , xi−1 } \ Bi ) from the diagonal structure of Φe (z). The application of Theorem 30 gives the assertion. Thus, assuming that the underlying graph G of a LDDAG G, is a perfect map of G opens the possibility of recovering G only by using the second order statistics of the processes necessary to compute the Wiener projections. This is possible, according to the proof of Theorem 37, if a global order on the processes that is compatible with the partial order defined by the DAG G were known. Unfortunately such information is in general not available. Since the DAG obtained from Theorem 30 is order dependent, this procedure is not viable. There is also a deeper reason why, only from Wienerseparation, an exact reconstruction of the underlying graph of a DAG is not possible: different DAGs can d-separate the same subsets. So they can not be distinguished from each other. Definition 38: Two DAGs with the same set of vertices have the same pattern if they have the same skeleton and the same inverted forks. Theorem 39: Let D1 and D2 be two DAGs with the same pattern. Let X, Y amd Z be three disjoint subsets of the set of vertices of D1 and D2 . If Z d-separates X and Y in D1 , then Z d-separates X and Y in D2 . Proof: This theorem is proven in [40]. Given this result, the reconstruction of the topology of a LDDAG can not go beyond the pattern of its underlying graph. Indeed, since DAGs with identical patterns d-separate the same sets, from the knowledge of the semi-graphoid associated with the LDG it is not possible to determine the original DAG. A pattern can be represented as semidirected graph where the only directed edges are the ones creating an inverted fork (see Figure 10(a)). A DAG belongs to the class of equivalence defined by a pattern if, by orienting the unoriented edges, no new inverted forks are originated (see Figure 10(b,d)). In [40], an algorithm is provided that allows to obtain from a semi-graphoid the pattern of a DAG, if this DAG is a perfect map of the semigraphoid. The reconstruction of the pattern of a LDDAG can be performed by the Inductive Causation (IC) algorithm (see [40]). Inductive Causation Algorithm
4671
1) Initialize the set of edges E = ∅.
1
1 2
3
3 (a)
(a)
(b)
(c)
Fig. 11.
(d)
Fig. 10. A pattern represented as semi-directed graph (a) and the three DAGs sharing that pattern (b), (c), (d).
2) For each pair (xi , xj ) of variables in V = {x1 , ..., xn }, determine a set Si,j such that I(xi , Si,j , xj ). If no such a set can be found, then add (xi , xi ) to E 3) For each pair (xi , xj ) of variables that are not connected in E and have a common neighbour xk , check if xk ∈ Si,j . • If xk ∈ Si,j , the inverted fork xi → xk ← xj is in the pattern. 4) In the partially directed graph fix the orientation of as many undirected edges as possible, as long as • there are no directed cycles • there are no new inverted forks. The IC algorithm takes as an input the semi-graphoid (V, I) generated by a LDDAG under Wiener-separation and gives as an output the pattern of a DAG. The following theorem guarantees that the computed pattern matches the pattern of the original LDDAG, if the original DAG is faithful to the generated semi-graphoid. Theorem 40: If the DAG D of the LDDAG is faithful to the separation I induced by the Wiener projection, the IC algorithm provides the pattern of D. Proof: The proof follows from the fact that the separation I is a semi-graphoid and from the results in [40]. Observe that the IC algorithm is an extremely powerful result since it allows one to reconstruct not only the skeleton of a LDDAG, but also the orientation of some of the edges. Furthermore Theorem 39 guarantees that with no additional assumptions, no additional information can be inferred from the irrelevance map. As observed in [22], the faithfulness condition is quite mild and is verified in most practical scenarios. Indeed, the graph associated to a LDDAG is not faithful to the generated graphoid only in pathological cases. An example is given by considering the following 3-node LDG x1 = e1 ;
x2 = x1 + e2 ; x3 = x2 − x1 + e3 .
(21)
The underlying DAG is represented in Figure 11(a), but, because of a cancellation of the effect of x1 on x2 we have x3 = e2 + e3 that implies I(x1 , ∅, x3 ). Thus the DAG is not faithful to the Wiener-separation. Indeed, the application of the IC algorithm produces the DAG in Figure 11(b). VI. M ETHODS FOR IDENTIFICATION AND CONTROL IN PASSIVELY OBSERVED NETWORKS
2 (b)
Two DAGs considered in the example of a non-faithful graph.
Many statistical and probabilistic methodologies have been developed in order to understand the causal effect of a random variable on another from the partial knowledge of a graphical model [21], [22], [23]. However most of these methodologies rely on the fact that the underlying graph representation of the network has no cycles. The main constribution of this section is to show how these results can be extended to networks of dynamical systems where feedback loops can be present as well. When identifying the dynamic relation existing between two nodes in a network of dynamical systems, it is often the case that several, but maybe not all, nodes are observable. Thus, it becomes an important problem to determine whether and how it is possible to identify the relation between two nodes making only use of the accessible data. The problem becomes extremely challenging when the network has loops involving the edge that is to be identified. We provide sufficient criteria to determine if the transfer function representing a connection in a network of linear dynamical systems can be identified using only passive observations. Approaches for the identification of individual transfer functions in networks given knowledge of the netowrk structure have been developed recently by [16]. The authors in [16] start from a framework similar to the one adopted in this paper, but follow methodologies that are mostly based on instrumental variable techniques. Also they consider the possibility of directly manipulating some of the signals in the network. Conversely, in this paper we follow an approach based on separation techniques that purely rely on passive observations and a full knowledge of the network structure is not required. The enabling result is the fact that the notion of d-separation for graphs (see [10], [38]) implies a notion of independence for networks of linear dynamical systems with loops, as well [20]. Theorem 41: Let G be a LDG with graph G. G is an Imap for the relation of Wiener separation. Notice how Theorem 41 is just an extension of Theorem 37 that is instead is limited to networks with DAG structure. Proof: See [20]. Generalization of the single door criterion The single door criterion is a powerful tool developed for the identification of parameters in structural equation models [22]. In [41], the authors provided a generalization of this criterion for the identification of a transfer function in a LDG. Theorem 42 (Generalized single door criterion): Consider a LDG G = (H(z), e) with output processes (x1 |...|xn ). Let G = (V, E) be a an I-graph of G. Assume ¯ obtained by that the nodes i and j are d-separated in G
4672
removing the link (i, j) from graph G. Let U := an (i, j, Z) . Define the following set of indeces J = {k ∈ U \ {j}| IG (k, Z, {i})},
I = U \ (J ∪ Z ∪ {i, j}),
ZJ = ch (J ∪ {j}) ∩ Z,
The “revolving door” criterion
ZI = ch (I ∪ {i}) ∩ Z,
ZP = Z \ (ZJ ∪ ZI ).
Here J is formed by collecting vertices in U which are d¯ excluding j, I is formed by all separated from i by Z, in G vertices in U which are not in J, Z and {i, j}. Suppose that • j is not involved in any loop considering the restriction of G to J ∪ {j} • if h ∈ J is an ancestor of j in the restriction of G to J ∪{j}, then h is not an ancestor of ZJ in the restriction of G to J ∪ ZJ . Let HZ0 J j 0 CjZJ |i,Z
HZJ j + HZJ J (I − HJJ )−1 HJj , Φej HZ0 j j ∗ (HZ0 J j Φej HZ0 J j ∗ + ΦeZJ )−1 . (22) Then it follows that = =
0 Hji = (1 − CjZ HZ0 J j )−1 Wji|(i,Z) J |i,Z
of Directed Acyclic Graphs where this assumption is always verified. However, if the edge i → j is involved in a directed loop, it is not possible to d-separate xi and xj making no use of descendants of xj . The criterion developed next provides a solution to this problem.
(23)
where Wj|(i,Z) is the Wiener filter that estimates the process xj based on processes xi and xZ and Wji|(i,Z) is the component corresponding to xi . In Equation (23), the term Wji|i,Z can be evaluated from data (it is a function of the power spectral densities of i, 0 0 j and Z). Conversely, the term CˆjZ|i,Z HZj is in general not computable from the knowledge of the power spectral densities. However, if it is known that the set Z contains 0 = 0. Thus, as a no descendants of j we clearly have HZj corollary, we have the following important consequence. Corollary 43 (Single door criterion): Under the assumptions of Theorem 42, if the set Z contains no descendants of j, then we have Hji = Wji|i,Z . Corollary 43 states that the MLSE of a signal xj using the signal xi , given a set of signals Z that d-separates i and j after removing the edge i → j provides the actual transfer function Hji (z) of the generative model if Z does not contain any descendants of xj ,. This criterion is known in the area of Structural Equation Models as the single door criterion [22]. As formulated now in the context of LDGs, if there is only a “single door” from i to j that prevents these two nodes from being “separated”, then the component of the least square estimate of j associated to i is the transfer function Hji . We have shown that the single door criterion allows us to identify a single transfer function Hji (z) in a LDG with no self-loops without necessarily observing all the signals of the network. The main assumption is that, after removing the edge i → j it must be possible to d-separate xi and xj in the graph of the LDG using no descendants of xj . This assumption is not very limiting if the edge i → j is not involved in a directed loop. Indeed, the standard formulation of the single door criterion has been developed in the context
Starting from the result of Theorem 42 we can obtain an alternative expression for Hji . Theorem 44 (Revolving door criterion): Under the same assumptions of Theorem 42, define K := {k ∈ ZJ | k is a descendant of j in the restriction of the graph G to{j} ∪ J ∪ ch (J)}.
Furthermore, assume that • if h ∈ I is an ancestor of i in the restriction of G to I ∪{i}, then h is not an ancestor of ZI in the restriction of G to I ∪ ZI • in the graph G there are no edges from the nodes in K to other nodes in ZP ∪ ZJ ∪ {i}. Then, we have that the transfer matrix Hji satisfies the relation � Hji = I − WjK|i,K,S WKj|J,i,S − WjK|i,K,S WKi|j,i,S · ·(I − Wij|K,j,S Hji − WiK|K,j,S WKi|j,i,S )−1 · −1 Wji|i,K,S WiK|K,j,S WKj|j,i,S (24)
where WAB|B,C,D denotes the component of the Wiener filter used to estimate A associated to the signal B when the signals B, C, D are used in the estimation. The relevance of Equation (24) is that it provides an implicit relation that the transfer matrix Hji has to verify. All the other terms are particular components of Wiener filters that can be directly obtained from the power spectral density of observable data: xi , xj and xK . In the special case where Hji is a scalar quantity, Equation (24) can be reduced to a second order polynomial equation in Hji , and thus analytically solved. A. Identification in a network with no loops, but with an unobserved node We revisit an example considered in [20] in light of the theory developed in this paper. Consider the graph G of Figure 12 representing a LDG following the dynamics x = e + H(z)x where the only non-zero entries of H(z) are H21 , H32 , H14 and H34 . Assume that the graph is known,
4673
H14 (z)
x1 Fig. 12.
H21 (z)
x4
x2
H34 (z)
H32 (z)
x3
Network considered in the example of Section VI-A.
but not the transfer functions on the edges. Also assume that only x1 , x2 and x3 are observed (but not x4 ). The goal is to identify the transfer function H32 (z). The task is made difficult by the presence of the confounding process x4 that is not accessible. However, observe that x2 and x4 are dSeparated by {x1 }, namely IG (x2 , {x1 }, x4 ). Let x ˆ2,1 and x ˆ3,1 be respectively the estimate of x2 and x3 from x1 using the non-causal Wiener filter. The hypotheses of Theorem 42 are met and since x1 is not a descendant of x3 the term HZJ in Equation (23) vanishes, yielding H32 (z) = W3,2|1,2 . Thus, the expression of H32 (z) can be obtained from the knowledge of the power spectral densities of x1 , x2 and x3 only. B. Identification in a loop Consider the loop network in Figure 13. Assume that
1
γ
3
2 Fig. 13.
Network considered in the example of Section VI-A.
it is known that the network only involves causal transfer functions. The objective is to identify the transfer function H21 relying on the power spectral densities of the signals. After removing the link 1 → 2, there is no way to d-separate the nodes 1 and 2 other than using the node 3 that is though a descendant of 2. We are not in condition of using the single door criterion. However, we meet the conditions for the application of Theorem 44. By using only power spectral densities we can determine the following quantities. So these transfer functions can be experimentally estimated. W21|1,3 =
α Φ e3 z , Φe 3 z 2 + β 2 Φe 2
W32|2,1 =
W13|3,2 =
β Φe 1 , Φe 3 z γ 2 + Φ e 1 z
Φ e2 z 2 γ , Φ e 2 z 2 + α 2 Φe 1
W23|1,3 =
β Φe 2 z Φe3 z 2 + β 2 Φe2
W31|2,1 =
W12|3,2 =
Φe 3 γ Φe 3 γ 2 + Φ e 1
α Φe 1 z . Φe 2 z 2 + α 2 Φe 1
Since it is possible to apply Theorem 44, we have that Equation (24) reduces to Equation (25) that can be analytically solved yielding H21 =
The article has illustrated strong theoretical and methodological connections between the area of graphical models of random variables and the area of networks of dynamic systems. In particular, algorithms defined to solve model selection problems for graphical models can typically be borrowed and suggest identification techniques for networks of dynamic systems. When the connectivity structure of the associated graph presents no loops the fundamental techniques that can be used are strikingly similar in both scenarios. In particular the notion fo d-separation, originally devised for the analysis of graphical models, becomes a powerful tool for the analysis and identification of dynamic systems, as well. In the case of linear dynamic systems with feedback loops, d-separation still proves extremely useful, but specific techniques need to be employed to include the presence of directed cycles. This has culminated with the generalization of the well-known single door criterions developed in the area of graphical models to provide an identification techniques in network of dynamic systems in presence of loops. R EFERENCES
β z
α z
VII. C ONCLUSIONS
α α 2 Φe 3 z γ 2 + Φ e 2 z 3 + α 2 Φe 1 z ; H21 = . z (α Φe3 z 2 + α β 2 Φe2 ) γ 2 + α Φe1 z 2
The second solution can obviously be discarded since it is not a causal transfer function.
[1] E. Atalay, A. Hortaçsu, J. Roberts, and C. Syverson, “Network structure of production,” Proceedings of the National Academy of Sciences, vol. 108, no. 13, p. 5199, 2011. [2] R. Mantegna and H. Stanley, An Introduction to Econophysics: Correlations and Complexity in Finance. Cambridge UK: Cambridge University Press, 2000. [3] D. Acemoglu, M. Dahleh, I. Lobel, and A. Ozdaglar, “Bayesian learning in social networks,” The Review of Economic Studies, vol. 78, no. 4, pp. 1201–1236, 2011. [4] M. Eisen, P. Spellman, P. Brown, and D. Botstein, “Cluster analysis and display of genome-wide expression patterns,” Proc. Natl. Acad. Sci. USA, vol. 95, no. 25, pp. 14 863–8, 1998. [5] E. Ravasz, A. Somera, D. Mongru, Z. Oltvai, and A. Barabasi, “Hierarchical organization of modularity in metabolic networks,” Science, vol. 297, p. 1551, 2002. [6] D. Del Vecchio, A. Ninfa, and E. Sontag, “Modular cell biology: Retroactivity and insulation,” Nature Molecular Systems Biology, vol. 4, p. 161, 2008. [7] A. Brovelli, M. Ding, A. Ledberg, Y. Chen, R. Nakamura, and S. L. Bressler, “Beta oscillations in a large-scale sensorimotor cortical network: directional influences revealed by Granger causality.” Proc Natl Acad Sci USA, vol. 101, no. 26, pp. 9849–9854, June 2004. [8] J.-S. Bailly, P. Monestiez, and P. Lagacherie, “Modelling spatial variability along drainage networks with geostatistics,” Mathematical Geology, vol. 38, no. 5, pp. 515–539, 2006. [9] P. Monestiez, J.-S. Bailly, P. Lagacheriec, and M. Voltz, “Geostatistical modelling of spatial processes on directed trees: Application to fluvisol extent,” Geoderma, vol. 128, pp. 179–191, 2005. [10] J. Pearl, Probabilistic reasoning in intelligent systems: networks of plausible inference. Morgan Kaufmann, 1988. [11] S. Lauritzen, Graphical models. Oxford University Press, USA, 1996, vol. 17. [12] P. Spirtes, C. Glymour, and R. Scheines, Causation, prediction, and search. The MIT Press, 2000, vol. 81. [13] D. Koller and N. Friedman, Probabilistic graphical models: principles and techniques. The MIT Press, 2009. [14] D. Materassi and M. Salapaka, “On the problem of reconstructing an unknown topology via locality properties of the wiener filter,” Automatic Control, IEEE Transactions on, vol. 57, no. 7, pp. 1765– 1777, 2012. [15] J. Adebayo, T. Southwick, V. Chetty, E. Yeung, Y. Yuan, J. Goncalves, J. Grose, J. Prince, G.-B. Stan, and S. Warnick, “Dynamical structure function identifiability conditions enabling signal structure reconstruction,” in Decision and Control (CDC), 2012 IEEE 51st Annual Conference on. IEEE, 2012, pp. 4635–4641.
4674
H21
� α z α Φe3 H21 z γ 2 − α2 Φe3 γ 2 − Φe2 z 2 + α Φe1 H21 z − α2 Φe1 = α Φe3 H21 z 3 γ 2 − α2 Φe3 z 2 γ 2 + α β 2 Φe2 H21 z γ 2 − α2 β 2 Φe2 γ 2 − Φe2 z 4 + α Φe1 H21 z 3 − α2 Φe1 z 2
[16] A. Dankers, P. M. Van den Hof, X. Bombois, and P. S. Heuberger, “Errors in variables identification in dynamic networks by an instrumental variable approach,” in Proceedings of 19th IFAC World Congress, 2014. [17] R. Olfati-Saber and R. M. Murray, “Consensus problems in networks of agents with switching topology and time-delays,” Automatic Control, IEEE Transactions on, vol. 49, no. 9, pp. 1520–1533, 2004. [18] J. Chow and P. Kokotovic, “Time scale modeling of sparse dynamic networks,” Automatic Control, IEEE Transactions on, vol. 30, no. 8, pp. 714–722, 1985. [19] M. Nabi-Abdolyousefi and M. Mesbahi, “Network identification via node knock-out,” in Conference on Decision and Control, 2010, pp. 2239–2244. [20] D. Materassi and M. V. Salapaka, “Notions of separation in graphs of dynamical systems,” in World Congress, vol. 19, no. 1, 2014, pp. 2341–2346. [21] K. A. Bollen and J. S. Long, Testing structural equation models. Sage, 1993, vol. 154. [22] J. Pearl, Causality: models, reasoning, and inference. Cambridge Univ Press, 2000, vol. 47. [23] R. H. Hoyle, Structural equation modeling: Concepts, issues, and applications. Sage Publications, 1995. [24] C. Chow and C. Liu, “Approximating discrete probability distributions with dependence trees,” Information Theory, IEEE Transactions on, vol. 14, no. 3, pp. 462–467, 1968. [25] R. Diestel, Graph Theory. Berlin, Germany: Springer-Verlag, 2006. [26] S. J. Mason, “Feedback theory: some properties of signal flow graphs,” in Proceeding of IRE, vol. 41, 1953, pp. 1144–1156. [27] D. Materassi and G. Innocenti, “Topological identification in networks of dynamical systems,” in Proc. of IEEE CDC, Cancun (Mexico), December 2008. [28] G. Rebane and J. Pearl, “The recovery of causal polytrees from statistical data,” in Proceedings of the 3rd Workshop on Uncertainty in Artificial Intelligence, 1987, pp. 222–228. [29] C. Michener and R. Sokal, “A quantitative approach to a problem of classification,” Evolution, vol. 11, pp. 490–499, 1957. [30] R. Mantegna, “Hierarchical structure in financial markets,” Eur. Phys. J. B, vol. 11, pp. 193–197, 1999. [31] G. Innocenti and D. Materassi, “A modeling approach to multivariate analysis and clusterization theory,” Journal of Physics A, vol. 41, no. 20, p. 205101, 2008. [32] T. Kailath, A. Sayed, and B. Hassibi, Linear Estimation. Upper Saddle River, NJ, USA: Prentice-Hall, Inc., 2000. [33] L. Ljung, System identification: theory for the user (2nd Ed.). Upper Saddle River, NJ, USA: Prentice-Hall, Inc., 1999. [34] D. Materassi and M. V. Salapaka, “On the problem of reconstructing an unknown topology,” IEEE Transactions on Automatic Control (under review), 2009. [35] D. Materassi and G. Innocenti, “Topological identification in networks of dynamical systems,” IEEE Trans. Aut. Control, vol. 55, no. 8, pp. 1860–1871, August 2010. [36] M. Choi, V. Tan, A. Anandkumar, and A. Willsky, “Learning latent tree graphical models,” Journal of Machine Learning Research, vol. 12, pp. 1771–1812, 2011. [37] D. Materassi and M. V. Salapaka, “Network reconstruction of dynamical polytrees with unobserved nodes,” in Decision and Control (CDC), 2012 IEEE 51st Annual Conference on. IEEE, 2012, pp. 4629–4634. [38] T. Verma and J. Pearl, “Causal Networks: Semantics and Expressiveness,” in Proceedings of the 4th Workshop on Uncertainty in Artificial Intelligence, 1988, pp. 352–359. [39] D. Materassi and M. V. Salapaka, “Reconstruction of directed acyclic networks of dynamical systems,” in American Control Conference (ACC), 2013. IEEE, 2013, pp. 4687–4692. [40] J. Pearl and T. Verma, “A theory of inferred causation,” Studies in Logic and the Foundations of Mathematics, vol. 134, pp. 789–811, 1995. [41] D. Materassi and M. V. Salapaka, “Identification of network components in presence of unobserved nodes,” in Decision and Control
4675
(CDC), 2015 IEEE 51st Annual Conference on. appear.
(25)
IEEE, 2015, p. to


![Optical Networks [Book Reviews] - IEEE ... - IEEE Xplore](https://m.moam.info/img/260x300/optical-networks-book-reviews-ieee-ieee-xplore_59dba1291723dd46dfe54bf8.jpg)