In this work, we study the phase separation of deeply quenched mixtures in which the diffusion ... an activated process, where a free energy barrier has to be.
PHYSICAL REVIEW E
VOLUME 58, NUMBER 6
DECEMBER 1998
Diffusion-driven phase separation of deeply quenched mixtures 1
Natalia Vladimirova,1 Andrea Malagoli,2 and Roberto Mauri1 Department of Chemical Engineering, The City College of CUNY, New York, New York 10031 2 Department of Astronomy and Astrophysics, University of Chicago, Chicago, Illinois 60637 ~Received 23 April 1997; revised manuscript received 14 September 1998!
In this work, we study the phase separation of deeply quenched mixtures in which the diffusion coefficient depends on the local composition field f . In one dimension ~1D!, the system evolves until it reaches a spatially periodic steady state, with a period that, for instant quenching, coincides with the wavelength of the mode of maximum growth of the linear stability analysis. Similar results are obtained also when the temperature of the system is the solution of the heat equation, but in this case the period of the periodic steady-state solution increases as the heat diffusivity decreases. In 2D the concentration profile, after reaching a periodic configuration similar to the 1D steady state, continues to evolve, forming single-phase domains separated by sharp interfaces, which then thicken as the system tries to minimize its interfacial area. When the quench takes place across, or near, the critical point, the drops merge to form filaments which later coarsen and grow. However, when the quench takes place far from the critical point and near the metastable region of the phase diagram, the length of these filaments decreases as the system becomes a collection of nucleating drops. The composition field within and without these microdomains appears to be nonuniform and time-dependent even after the formation of sharp interfaces, thereby contradicting the commonly accepted assumption of local equilibrium at the late stage of the phase separation process. These results do not depend on the amount and the form of the random noise, while they are strongly influenced by the conditions of the system at the boundaries, as the morphology of phase separation becomes anisotropic and acquires a preferential direction when these conditions are not uniform. @S1063-651X~98!14212-5# PACS number~s!: 64.70.Ja, 64.60.Cn, 64.60.Ht
I. INTRODUCTION
Phase separation of deeply quenched mixtures is a problem of longstanding complexity. It can occur either by nucleation ~both heterogeneous and homogeneous! or by spinodal decomposition @1#. The former process describes the relaxation to equilibrium of a metastable system, while the second one is typical of unstable systems. Therefore, nucleation is an activated process, where a free energy barrier has to be overcome in order to form embryos of a critical size, beyond which the new phase grows spontaneously; in most practical cases, suspended impurities or imperfectly wetted surfaces provide the interface on which the growth of the new phase is initiated @2#. Contrary to nucleation, spinodal decomposition occurs spontaneously, without any energy barrier to be overcome, and involves the growth of fluctuations of any amplitude that exceed a critical wavelength @3#. The classical theoretical basis of this process is the Cahn-Hilliard-Cook theory @4#, generalizing the previous approach by Van der Waals @5#, which was later extended to include nonlinear effects @6,7#. In principle, nucleation and spinodal decomposition are fundamentally different from each other, as metastable systems relax via the activated growth of localized fluctuations of large amplitude, whereas unstable systems do so via spontaneous growth of long-wavelength fluctuations of any amplitude. However, in practice, the distinction between the two processes is rather murky @8#, as both the critical nucleus size and the critical fluctuation wavelength decrease as the temperature quench increases @9#. Experimental studies on spinodal decomposition have shown that at the end of an initial, very fast ~i.e., a few 1063-651X/98/58~6!/7691~9!/$15.00
PRE 58
milliseconds! separation process, small microdomains appear, which later grow by diffusion and coalescence @10,11#. In a recent theoretical work @12#, this process of drop formation was described, generalizing the Cahn-Hilliard-Cook model using a Flory-Huggins free-energy density, with a composition-dependent diffusivity. It was found that in 1D the nonlinear terms saturate the exponential growth predicted by the linear theory, so that the concentration distribution tends to a steady-state, periodic profile, with a wavelength corresponding to the fastest growing mode of the linear regime. In addition, this steady-state profile does not depend on the form of the initial perturbation to the homogeneous composition profile. In the present work, we intend to generalize the analysis of @12#, studying a 2D system and the effects of a nonuniform, continuous quenching. In particular, we intend to compare our results with those obtained by Koch et al. @7# and Rogers et al. @13#. After briefly describing, in Sec. II, the theoretical basis of our work, in Sec. III the equations of motion are derived. Finally, after describing in Sec. IV the results of our simulation, Sec. V is devoted to a few comments and conclusions. II. THE GOVERNING EQUATIONS
In this section we will determine the governing equation, explaining that our assumption of a composition-dependent diffusivity can be derived as a natural extension of some well-known previous works on spinodal decomposition. Our starting point consists of a simplified dynamical model of a binary alloy, which is called model B in critical dynamics @14#, in which the time evolution of the conserved 7691
© 1998 The American Physical Society
7692
VLADIMIROVA, MALAGOLI, AND MAURI
order parameter ~i.e., the concentration of one of the constituents, in our case! is obtained by minimizing the ‘‘coarsegrained’’ free-energy functional.
g eq /RT5 m A x A 1 m B x B ,
Dg eq5g eq2 ~ g A x A 1g B x B ! ,
~1!
where g eq is the energy of the mixture at equilibrium, while g A and g B are the molar free energy of pure species A and B, respectively, at temperature T and pressure P. In turn, Dg eq is the sum of an ideal part Dg id and a so-called excess part g ex , with Dg id5RT @ x A lnx A 1x B lnx B # ,
g ex5RTCx A x B ,
~3!
where C is a function of T and P. This expression, which is generally referred to as the Margules correlation @15#, is generally derived by considering either the molecular interactions between nearest neighbors @16# or summing all pairwise interactions throughout the whole system @17#. In addition, as shown in the appendix of @12#, Eq. ~3! can be derived from first principles assuming that the A2A and the B2B intermolecular forces are equal to each other, i.e., F AA 5F BB , so that the g2x A phase diagram is symmetric, with C dependent on (F AA 2F AB ). In the following, we shall assume that P is fixed, so that the physical state of the mixture at equilibrium depends only on T and x A . Finally, in order to take into account the effects of spatial inhomogeneities, Cahn and Hilliard @4# applied an original idea by van der Waals @5# and introduced the generalized specific free energy g as 1 g5g eq2 RTa 2 ~ ¹x A !~ ¹x B ! , 2
m A5
~4!
where a is a typical length of the spatial inhomogeneities in the composition field. As shown by van der Waals @5#, a is proportional to the surface tension between the two phases @18# and is typically a length of order 0.120.01 m m. An interesting discussion about this model can be found in DeGennes @19#.
1 ] ~ cg eq! , RT ] c A
m5
1 ] ~ cg eq! . RT ] c B
d ~ g/RT ! ] ~ g/RT ! ] ~ g/RT ! 5 2“• , df ]f ]~ “f !
~6!
and substituting Eqs. ~1!–~3! into Eq. ~6! we obtain
f m 5 m 0 1ln 1C ~ 122 f ! 2a 2 ¹ 2 f , 12 f
~7!
where m 0 5(g B 2g A )/RT. The mole densities c A and c B satisfy the continuity equations,
]cA 1“•J A 50, ]t
~8!
]cB 1“•J B 50, ]t
~9!
where the fluxes JA 5c A vA and JB 5c B vB are the local rates at which moles of species A and B pass through a unit cross section, with velocities vA and vB , respectively. Summing Eqs. ~8! and ~9! we obtain the continuity equation for the total mole density,
]c 1“•cv* 50, ]t
~10!
v* 5x A vA 1x B vB
~11!
where
is the mole average velocity. Now we introduce the last assumption: the two species have the same density, so that mole- and density-based quantities are proportional to each other. Consequently, as there is no net convective flux, the average velocity v* is zero, so that Eq. ~10! shows that the total mole density c is constant. In addition, considering that c A 5cx A , substituting Eq. ~10! into Eq. ~8! we obtain
B. Chemical potential and constitutive relation
Below a certain critical temperature T c , corresponding to values C>2, the molar free energy given by Eqs. ~2! and ~3! is a double-well potential, and therefore a first-order phase transition will take place. Now, it is well known that the molar free energy can be written as @15#
m B5
Here c A and c B denote the mole densities, that is, the number of moles per unit volume, of species A and B, respectively, and c5c A 1c B is the total mole density. Clearly, x A 5c A /c and x B 5c B /c. From here we see that the two quantities f 5x A and ( m A 2 m B ) are thermodynamically conjugated, that is, ( m A 2 m B )5d(g/RT)/d f . This result can be extended @4# defining the generalized chemical potential m ,
~2!
where R is the gas constant, while the excess molar free energy can be expressed as
~5!
where m A and m B denote the chemical potential of species A and B in solution, respectively, i.e.,
A. Gibbs free energy and chemical potential
Consider a homogeneous mixture of two species A and B with molar fractions x A and x B 512x A , respectively, contained in a closed system at temperature T and pressure P. The equilibrium state of this system is such that it minimizes the ‘‘coarse-grained’’ free-energy functional, that is, the molar Gibbs energy of mixing, Dg eq ,
PRE 58
c
]xA 1“•J50, ]t
~12!
where J is the diffusive flux, which is defined as follows: J5cx A x B ~ vA 2vB ! .
~13!
DIFFUSION-DRIVEN PHASE SEPARATION OF DEEPLY . . .
PRE 58
7693
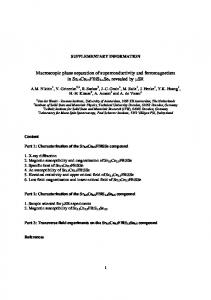
FIG. 1. Composition as a function of position for a critical instantaneous quench C53 at different times, when a random perturbation with amplitude d f 50.025 is superimposed to the initial composition f 50.5. The space and time coordinates, x and t, are scaled in terms of a and a 2 /D, respectively. The curves correspond, respectively, to times t50, 0.5, 1.0, 1.5, and 2.5.
The constitutive relation for J cannot be determined from first principles and has to be based on some reasonable assumptions. Now, the velocities of the single species, vA and vB , are the sums of a convective part, v* ~which is zero, in our case!, and a diffusive part, which in turn must satisfy the Gibbs-Duhem relation identically, x A “ m A 1x B “ m B 50.
~14!
Therefore, comparing Eqs. ~14! and ~11!, we conclude that it is reasonable to assume vA 5v* 2D“ m A ,
~15!
vB 5v* 2D“ m B ,
~16!
where D is a composition-independent diffusion coefficient. Consequently, the expression for J becomes J52cDx A x B “ m .
~17!
Finally, considering Eq. ~7!, we find that the diffusive flux can be expressed as a function of f ~where f [x A ) only: J 52D“ f 1D f ~ 12 f !@ a 2 “¹ 2 f 12C“ f c 1 ~ 2 f 21 ! “C # ,
~18!
which coincides with the expression for J used in @12#. The term D“ f in Eq. ~18! represents the regular diffusion flux, while the last term vanishes for small concentrations of either solvents ( f →0 or f →1) and for ideal mixtures (a 5C50). Note that the a 2 term is always stabilizing and is relevant only at small length scales, while C is a known function of the temperature, and near the critical temperature T cr it is proportional to (T cr2T). C. Dynamical model and scaling
Substituting Eq. ~18! into Eq. ~12!, we obtain the following governing equation:
FIG. 2. Quenching depth, C, and composition, f , as functions of position at different times for heat diffusivity a 5D. The curves correspond to times t5100, 200, 500, 1000, and 2000 ~given in a 2 /D units!. The spatial coordinate varies between 0 and 100a, composition varies between 0 and 1, while the quenching depth solves the heat equation with C i 52 and C w 53.
]f 1D“• $ 2“ f 1 f ~ 12 f !@ a 2 “¹ 2 f 1“„C ~ 2 f 21 ! …# % ]t 1“•j50,
~19!
where j is the contribution to the material flux due to thermal fluctuations, which satisfies the fluctuation-dissipation theorem @20#,
^ j~ r,t ! & 50, 2 n
^ j~ r,t ! j~ r8 ,t 8 ! & 52 DIf ~ 12 f ! d ~ r2r8 ! d ~ t2t 8 ! , with the brackets indicating ensemble average and n denoting the number density, that is, the number of particles per unit volume. Trivially, if we also assume that the temperature quench is instantaneous, so that the temperature is uniform within the system and C is constant, this equation reduces to the one considered in @12#.
VLADIMIROVA, MALAGOLI, AND MAURI
7694
PRE 58
FIG. 3. Steady-state composition as a function of position for different values of the heat diffusivity, a 5` ~i.e., instant quenching!, 10D, 1D, and 0.1D, respectively. The spatial coordinate varies between 0 and 100a, while composition varies between 0 and 1.
Since the only mechanism of mass transport that is considered here is diffusion, the length scale of the process is the microscopic length a, so that we can introduce the following scaling: r ˜r5 , a
˜t 5
D a2
FIG. 4. Composition as a function of position for a critical instantaneous quench C53 at different times. The size of the system is 100a3100a, with periodic boundary conditions. Snapshots correspond, respectively, to times t520, 60, 100, 500, 1000, and 2000, expressed in a 2 /D units. The gray level varies linearly between black and white, corresponding to concentrations f 5 f Aeq , and f 5 f Beq , respectively.
t.
Therefore, the continuity equation becomes
]f ˜ •J ˜ 50, 1“ ]˜t
~20!
˜J52“ ˜ f 1 f ~ 12 f ! “ ˜ @¹ ˜ 2 f 1C ~ 2 f 21 !# 1˜j,
~21!
where
with
^˜j~˜r,˜t ! & 50; ^˜j~˜r,˜t !˜j~˜r8 ,˜t 8 ! & 522« 2 If ~ 12 f ! d ~ r2r8 ! d ~ t2t 8 ! ,
~22!
with «5(na 3 ) 21/2. Many recent articles have used the scaling first proposed by Grant et al. @21#, where space is scaled through the wavelength corresponding to the fastest growing mode of the linear regime. Near the critical point, this length is much larger than a, and in our case it equals a/ AC22 @see Eq. ~23!#. However, for deep quenches, the AC22 factor is an O(1) quantity, and can therefore be omitted. In addition, in the slow quench case, which we consider here,
where C is a function of T, this scaling would introduce additional terms in the governing equation, unnecessarily complicating the analysis. III. NUMERICAL RESULTS
We solved Eq. ~20! using an explicit finite difference method on a uniform N3M two–dimensional grid with spacing @ (iDx, jDy),i51,N, j51,M # and time discretization @ nDt,n51,2, . . . # , with Dx/a,Dy/a'0.522, and Dt/(a 2 /D)'0.1–0.001. We adopted a cell-centered representation for the concentration variable f ni j (t), and discretized the right-hand side of Eq. ~20! in flux conservation form, using a second-order accurate approximation of the spatial derivatives. The equations are advanced in time, using a straightforward explicit Eulerian step, and we chose the time step Dt in such a way to satisfy the CFL stability condition for the discretized equations. This way, the numerical scheme is O(Dx 2 ,Dt) accurate. The background noise was simulated generating a random concentration field of amplitude,
DIFFUSION-DRIVEN PHASE SEPARATION OF DEEPLY . . .
PRE 58
7695
FIG. 6. Separation depth, s, as a function of time for a critical instantaneous quench C53 and different amplitudes of the background noise, d f 50.531021 , 0.531022 , 0.531023 , and 0.531024 , with time expressed in terms of a 2 /D.
FIG. 5. Composition as a function of position at different times after the temperature of the upper and lower walls has been quenched from C i 52 to C w 53, with heat diffusivity a 510D. The size of the system is 200a3100a, with periodic boundary conditions in the horizontal direction, and no-flux boundary conditions in the vertical direction, to simulate a long, horizontal tube. Snapshots correspond, respectively, to times t5100, 200, and 400, expressed in a 2 /D units. The gray level varies linearly between black and white, corresponding to a concentrations f 5 f Aeq , and f 5 f Beq , respectively.
df5
« ~ Dx/a !~ DtD/a 2 !
'0.1–0.01,
which was uncorrelated both in space and in time, so as to satisfy Eq. ~22!. That means that at each time step a spatially uncorrelated noise was added to the concentration field, and was then subtracted at the next time step, only to be replaced with another spatially uncorrelated background noise of the same amplitude. In the following, we present results corresponding to temperature quenches where the Margules parameter C increased from C i 52 ~which is its critical value! to C w 53. Similar results were obtained when we performed simulations with C w 52.1 and 2.3. Two cases were considered, with uniform initial concentration field f 0 50.5, corresponding to a critical quench, and f 0 50.4 ~off-critical quench!. A. One-dimensional case
First, we validated our numerical scheme by solving the one-dimensional version of Eq. ~20! with periodic boundary conditions, considering an instantaneous, critical, and uniform quench with C53 and f 0 50.5. As we mentioned above, in this case our equation and boundary conditions become essentially the same as those used in @12#, the only difference being that the initial conditions and the numerical technique employed here are different. ~Mauri et al. @12# solved the problem for periodic and pulsed initial conditions,
using a split-step method in time and a pseudospectral collocation method in space.! As we can see in Fig. 1, identical results were obtained, as initial, exponentially growing instabilities are later saturated by the effect of the nonlinear terms. Eventually, the concentration distribution tends to a steady, periodic profile, with a period and an amplitude which correspond to the fastest growing mode of the linear regime, i.e., l 05
2pa
AC22
.
~23!
Qualitatively, the relaxation time that is needed to reach steady state also agrees with that obtained in @12#, i.e., t 0 5l 20 /D. Our next step was to study a critical quench where temperature, and therefore C, is a known function of position and time. Since near the critical point we have C}(T 2T cr), then C(x,t), with 0