Digital holography in combination with diffraction grating to get super-resolution M. Paturzo*a, F.Merolaa, S. Grillia, S. De Nicolab, P.Ferraroa Istituto Nazionale di Ottica Applicata-CNR via Campi Flegrei 34, 80078-Pozzuoli (NA),Italy; b Istituto di Cibernetica del CNR via Campi Flegrei 34, 80078-Pozzuoli (NA), Italy
a
ABSTRACT Resolution is an important issue in inspection of objects on microscopic scale. Various approaches have been investigated to increase the optical resolution behind the diffraction limit of an optical imaging system. Demonstration that super-resolution is possible have been also established in interference microscopy. We have studied the possibility to use diffraction gratings, in different experimental configurations for increasing the aperture of an optical imaging system. The aim of the study is to demonstrate that super-resolution is possible and is a practical and viable method for a coherent optical microscope. We take benefit of the numerical reconstruction properties of DH in combination with diffraction grating to get super-resolution. Various attempts have been performed and results are presented and discussed. The approaches could be used for metrology and imaging application in various fields of engineering and biology. Keywords: super-resolution, diffraction grating, lithium niobate
1. INTRODUCTION Holographic interferometry has proven to be a very sensitive tool for the task of non-destructive testing for industrial as well as biological applications [1]. However, classical holographic recording materials like silver halide emulsions have the drawback of a time-consuming processing. The development of computer technology and solid state image sensors made it possible to record hologram directly on charge coupled device (CCD) cameras. This important step enabled full digital recording and reconstruction of holograms without the use of photographic media, commonly referred to as digital holography (DH). DH has become a very useful technique for optical metrology in experimental mechanics, biology, fluid dynamics and non-destructive inspections and extensive research has been devoted to the development of different applications of digital holography [2-5]. Computational image reconstruction from a digital hologram has many advantages, including amplitude and phase imaging, 3D imaging and the digital wavefront manipulation. In fact, the digital reconstruction and the numerical form of interferometry enable processes that are optically not possible: the zeroorder diffraction can be eliminated numerically, [6] and wave fields generated and reconstructed with different wavelengths can be compared interferometrically [7]. However, the size of the CCD sensitive chip (size of the digital hologram) is much smaller than the holographic plate used in conventional holography. So, in the most cases, the resolution of digital holography is low and not qualified for practical application. To obtain adequate resolution, the specimen is always magnified during the hologram recording, but this operation always simultaneously magnifies the coherent speckle noise. The poor resolution of digital holography has been one of the main limits to the success of digital holographic microscopy. In fact, microscopy applications of digital holography require imaging a sample with high definition. Diverse techniques have been proposed to improve image resolution [8-10]. A drawback for many of these proposals is their intricate set-up and cumbersome procedure. Alternatively, an active synthetic aperture, achieved with a relative movement of the sample and the CCD camera, can also enhance resolution [11-15].
*
Electronic Address:
[email protected]
Optical Micro- and Nanometrology in Microsystems Technology II edited by Christophe Gorecki, Anand K. Asundi, Wolfgang Osten Proc. of SPIE Vol. 6995, 699505, (2008) · 0277-786X/08/$18 · doi: 10.1117/12.782111 Proc. of SPIE Vol. 6995 699505-1 2008 SPIE Digital Library -- Subscriber Archive Copy
Basically, resolution improvement would be possible by using larger CCDs. But since the sampling theorem favours small pixel periods, this would require CCDs with numbers of pixels not offered on the market today or in the near future. In this paper, we describe another simple method capable of improving the resolution of digital holography, making more object waves reach the CCD chip. To this aim, we put a diffraction grating in the optical path [16]. Two different types of gratings were used in our experiments. The first is a linear amplitude diffraction grating, with a lines having a period of 25 microns. The second grating was a two-dimensional phase array with hexagonal geometry, fabricated in a lithium niobate substrate through the electric field poling technique and with a pitch of 35 microns [17].
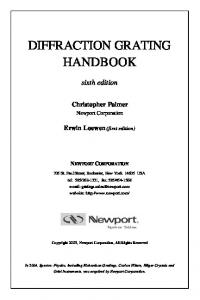
2. METHODOLOGY The holographic set-up adopted in our experiments is shown in Fig. 1. The light source used in this experiment is a He–Ne laser (wavelength 633 nm). The specimen is illuminated with a collimated plane laser beam, and a spherical laser beam from a pinhole is used as a reference light. The distance between the pinhole and the CCD is the same of that between the object and the CCD, according to the Fourier holography configuration. The diffraction grating, which was the key device in this method, is placed in front of the specimen.
PBS
M
Laser
λ/2
λ/2 Reference beam
MO PH
PH M
CCD Plane
G BS
O
MO d2
d1
Fig.1 Sketch of a digital holographic recording setup.
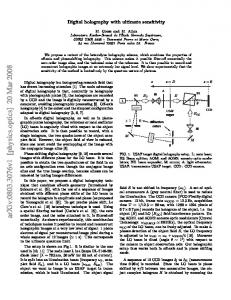
It is well known that a light incident upon a grating often splits into three beams. One of these beams will propagate along the original direction, and the other two beams will diverge from the original direction with an angle of ±λ/p, where λ and p are the wavelength and the period of the grating, respectively. The ray diagrams of the object waves are schematically shown in Fig. 2 and, for simplicity, only a point object P is discussed here.
Proc. of SPIE Vol. 6995 699505-2
grating
b a
b a
P
P
CCD
CCD
c
c
d2
d1 (a)
(b)
Fig.2. Ray diagrams of the object wave: (a) without grating in setup and (b) with a grating in setup.
Figure 2a gives the ray diagram of common holographic method, where all the object waves freely propagate to the CCD plane, and only the beam between the two broken lines (beam a) reaches the area of the hologram and can be digitally recorded. Because the dimension of the CCD target is small, the recorded object wave beam a is only a small part of the total. Figure 2b shows the ray diagram of our method, where a grating is placed in front of the object. In comparison with Fig. 2a, we can find that two other neighbouring wave beams b and c besides beam a also reach the hologram area due to the diffraction of the grating. It is obvious the holographic system in Fig. 2b has higher resolving power than that in Fig. 2a since it essentially augments three times the aperture of the CCD array. The digital holograms were numerically reconstructed to obtain the in focus real image of the tested target. Since the numerical aperture of Fig. 2b is almost three times of that shown in Fig. 2a, the reconstructed image at point P has a resolution three times higher than the diffraction limit of the common system without the diffraction grating. The numerical reconstruction is divided into two steps. In the first step, we obtain the complex amplitude distribution in the plane immediately behind the grating by computing the following equation,
1 λd 2 (x1 + y1 ) b( x1 , y1 ) = e iλ d 2 iπ
2
2
∫∫ r ( x , y )t ( x , y )e 2
2
2
2
[
iπ x 22 + y 22 d 2λ
]
e
−
2 iπ [x 2 x1 + y 2 y1 ] λd 2
dx2 dy 2
(1)
where r(x2 ,y2) is the complex amplitude distribution of the reference wave on a CCD target and t(x2 ,y2) is the intensity of the digital hologram. If we assume that the grating used in Fig. 2b can be written as 1+a cos (2πx1/p), where a and p are the diffraction efficiency and the period of the grating respectively. The complex amplitude distribution of the plane immediately before the grating can be obtained by multiplying b(x1 ,y1) with 1+a cos (2πx1/p) and the reconstructed image in the object plane x0y0 can be obtained by computing the Fresnel integral of b(x1 ,y1) [1+a cos (2πx1/p)] according to
1 λd 2 (x 0 + y 0 ) b ( x0 , y 0 ) = e iλd1 iπ
2
2
∫∫ b( x , y )(1 + a cos kx )e 1
1
1
[
iπ 2 x1 + y12 d 1λ
]
e
−
2 iπ [x1 x 0 + y1 y 0 ] λd 1
dx1dy1
(2)
where k is equal to 2π/p. Using the two step reconstruction algorithm the pixel of reconstruction doesn’t depend on the distance between the object and the CCD as in the typical one step Fresnel reconstruction, but only by the ratio d1/d2, according to the formula PR= PCCD d1/d2 [18].
Proc. of SPIE Vol. 6995 699505-3
3. EXPERIMENTAL RESULTS Two kind of gratings are used in our experiment: the first is a one dimensional amplitude diffraction grating, with a pitch of 25 microns, the second is a two-dimensional phase array with hexagonal geometry, fabricated in a lithium niobate substrate through the electric field poling technique with a pitch of 35 microns. The used CCD has 1024 x 1024 pixels, 7.6 micron in size. Figure 3 shows the results concerning the one dimensional amplitude diffraction grating. For comparison, we first recorded a hologram with the setup shown in Fig. 1, then removed the grating from the setup and recorded another hologram. In Fig.3b and Fig.3a the corresponding reconstructed images are shown. In Fig.3c and Fig. 3d we show a magnified image of a small area of the object concerning the 40 (up) and 31 (down) lines/mm target. The spatial resolution is clearly increased. In fact, the 31 lines/mm target is visible only in the reconstruction obtained by the hologram acquired inserting the amplitude grating in the optical path. Moreover, the 40 lines/mm target is resolved better in the Fig. 3d than in Fig. 3c, as confirmed looking at the corresponding profiles in Fig.3e and Fig.3f. .
mmnnmii
IIflUL
I:
UIUImililH._
t
IuluhIIIII1'I
20
40
Ill tilL
i11n ii
(a)
(b)
(c)
(d)
00
00
lOU
120
140
20
(e)
40
00
00
lOU
120
(f)
Fig 3.(a) Reconstructed image without a grating in setup and (b) with a grating in setup. (c) and (d) magnified images of a small area of the object without and with a grating, respectively. (e) and (f) profiles concerning the 40 lines/mm target in the two experimental conditions.
Proc. of SPIE Vol. 6995 699505-4
140
In the second part of our experiment we used a two-dimensional phase array with hexagonal geometry, fabricated in a lithium niobate substrate through the electric field poling technique with a pitch of 35 microns [18]. The fabricated device consists of a 2-dimensional (2D) array of periodically inverted ferroelectric domains, along the z axis, in a lithium niobate sample. The phase step between opposite ferroelectric domains is achieved via the application of an external electric field, along the z-axis, through transparent electrodes covering the opposite z-faces of the crystal Hexagonally poled samples are prepared by standard electric field poling at room temperature[19]. For the ferroelectric domain inversion, the z- face of a 0.5 µm thick z-cut lithium niobate crystal sample is covered with photoresist and then photo-lithographically patterned with a 2D array of hexagonal openings arranged in a hexagonal lattice. Fig. 4a shows a section of the photolithography mask used in the fabrication process. External electric field, higher than the coercive field, is applied via conductive gel electrodes between the two opposite z faces of the crystal while the current is monitored in order to control the domain inversion process. After the poling process, a 2D hexagonal lattice of domains, that is a replica of the photolithographic pattern, is created. An optical microscopy image of the actual domain structure visualized is shown in Fig. 4b. The distance between neighbouring hexagons is 35 microns. Transparent ITO (indium tin oxide) electrodes are deposited on the opposite z faces of the poled crystal so that external field can be applied across the sample without disturbing the optical transmission along the z axis LN crystal is a linear electro-optic media in which an electric field E changes its index of refraction. When both electric field in the crystal and direction of propagation of light are along the c axis, the refractive-index change ∆n is given by ∆n = −(1/2) r 13 n03 E, where r 13 = 10x10-12 m/V is the appropriate element of the electro-optic tensor and no is the ordinary index of refraction. The sign of r 13 depends on the orientation of the c axis of the crystal which is collinear with the spontaneous polarization Ps vector. When ferroelectric- engineered domains are created in the crystal and an electric field E is applied to the crystal, a monochromatic plane wave of wavelength λ, incident on the HPA, undergoes a spatially dependent phase shift ∆φ given by the relation λ ∆ φ 2 π = ± ( d ⋅ ∆ n + (n 0 − 1 )d 33 V ) where d is the crystal thickness and ∆d =d33V(d33 =7.57x10⁻¹² m/V for LN) is the piezoelectric thickness change generated by the applied voltage and the ± accounts for the opposite sign in the areas of opposite ferroelectric polarization. Therefore, the total phase change across the hexagonal domain walls is 2 ∆φ.
5... S..' • 5W55i ———
I
15SS S SI 1S5SI SSSS 5551 S
(a)
(b)
Fig. 4. Optical microscopy images of the photolithography mask used in the fabrication process (a), and of the actual domain structure (b).
Figures 5,6 and 7 show the results concerning the two-dimensional hexagonal phase array. As in the previous case, we first recorded a hologram with the setup shown in Fig. 1, then removed the grating from the setup and recorded another hologram. From this hologram we obtain the reconstructed image in Fig. 5a. Fig.5b shows a magnified image of a small area of the object.
Proc. of SPIE Vol. 6995 699505-5
(a)
(b)
Fig 5. (a) Reconstructed image without a grating in setup and (b) magnified images of a small area of the object.
The object is rotated in such a way that its spatial frequencies have components in different directions, not only in the horizontal one like in the first part of the experiment. The aim of this rotations is to investigate the increasing of the spatial resolution due to the phase array in different directions. From the hologram acquired with the phase array in the setup, we obtain the reconstructed image in Fig.6. To be precise, this reconstruction has been obtained by using formula 1 and 2 with the parameter a=0, that is the presence of the array is not been considered. Then, introducing the numerical array in x direction, that is superimposing the diffraction order -1a and 1a on the zero one, we obtain the image shown in figure 7a.
1b
-1a
0
1a
-1b
Fig.6 Reconstructed image with a grating in setup, but without the numerical grating in the numerical reconstruction formula.
On the other hand, Figure 7c shows the reconstruction obtained superimposing the diffraction order -1b and 1b on the zero one. Fig.7 b,d show magnified image of a small area of the object to appreciate better the enhancement of the spatial resolution by putting the phase array in the optical path. It is clear that the optical resolution increases considerably only in the second case, where the direction of the used diffraction order -1b and 1b is almost collinear with the sample frequencies one.
Proc. of SPIE Vol. 6995 699505-6
(a)
(b)
(c)
(d)
Fig 7. Reconstructed images with a grating in setup and superimposing on the zero order the first diffraction orders -1 and 1 (a) along the x direction (c) along another hexagonal axis. (b) and (d): magnified images of a small area of the object in the two conditions, respectively.
4. CONCLUSION In summary, we have demonstrated experimentally a super-resolution digital holographic imaging method, in which a grating is placed in front of the specimen during the hologram recording. More object waves, originally off the CCD target, are diffracted onto the CCD by the grating, so the reconstructed image has a higher resolution. Two kind of gratings are used in our experiment: the first is a one dimensional amplitude diffraction grating, with a pitch of 25 microns, the second is a two-dimensional phase array with hexagonal geometry, fabricated in a lithium niobate substrate through the electric field poling technique with a pitch of 35 microns. In the first case only the resolution of the x direction can be improved, because only a one-dimensional grating is used. In the second case we can improve the resolution along three different directions, that are the three hexagonal axes, which are 120° apart.
REFERENCES [1] [2]
[3] [4]
Von Bally G. “Holography in medicine and biology” Berlin: Springer Verlag, 1979. W. Osten and P. Ferraro, “Digital holography and its application in MEMS/MOEMS inspection” in "Optical Inspection of Microsystems", vol. 109 of "Optical Science and Engineering Series" W. Osten ed., (CRC Press, 2006). W. Osten, T. Baumbach, and W. Jüptner, “Comparative digital holography,” Opt. Lett. 27, 1764-1766 (2002). P. Ferraro, S. De Nicola, G. Coppola, A. Finizio, D. Alfieri, and G. Pierattini, “Controlling image size as a function of distance and wavelength in Fresnel-transform reconstruction of digital holograms,” Opt. Lett. 29, 854-856 (2004).
Proc. of SPIE Vol. 6995 699505-7
[5]
[6] [7] [8] [9] [10] [11] [12] [13] [14] [15] [16] [17]
[18] [19]
C.P. McElhinney, J.B. McDonald, A. Castro, Y. Frauel, B. Javidi, and T.J. Naughton, “Depth-independent segmentation of macroscopic three-dimensional objects encoded in single perspectives of digital holograms,” Opt. Lett. 32, 1229-1231 (2007). T. Kreis and W. Jüptner, “Suppression of the dc term in digital holography,” Opt. Eng. 36 (8), 2357–2360 (1997). T. Kreis, “Digital holographic interferometry,” in Trends in Optical Nondestructive Testing, P. K. Rastogi and D. Inaudi, Eds., pp. 113– 127, Elsevier Science B.V. (2000). J. Swoger, M. Martínez-Corral, J. Huisken, and E.H.K. Stelzer, “Optical scanning holography as a technique for high-resolution three-dimensional biological microscopy,” J. Opt. Soc. Am. A 19, 1910-1918 (2002). V. Mico, Z. Zalevsky, P. García-Martínez, and J. García, “Synthetic aperture superresolution with multiple off-axis holograms,” J.Opt. Soc. Am. A 23, 3162-3170 (2006). S. A. Alexandrov, T. R. Hillman, T. Gutzler, and D. Sampson, “Synthetic aperture Fourier holographic optical microscopy,” Phys. Rev. Lett 97, 168102.1-168102.4 (2006). F. Le Clerc, M. Gross, and L. Collot, “Synthetic aperture experiment in the visible with on-axis digital heterodyne holography,” Opt. Lett. 26, 1550-1552 (2001). R. Binet, J. Colineau, and J.-C. Lehureau, “Imagerie optique à synthèse d'ouverture: nouveau concept et premiers résultats,” Rev. Electr. Electron. 2, 31-37 (2001). R. Binet, J. Colineau, and J.-C. Lehureau, “Short-range synthetic aperture at 633 nm by digital holography,” Appl. Opt. 41, 4775-4782 (2002). J. H. Massig, “Digital off-axis holography with a synthetic aperture,” Opt. Lett. 27, 2179-2181 (2002). T. Kreis, M. Adams, and W. Jüptner, “Aperture synthesis in digital holography,” Proc. SPIE 4777, 69-76 (2002). C.Liu, Z. Liu, F. Bo, Y.Wang, and J. Zhu, “Super-resolution digital holographic imaging method”, Appl. Phys. Lett. 81 (17), 3143-3145 (2002). M. Paturzo, P. De Natale, S. De Nicola, P. Ferraro, S. Mailis, R. W. Eason, G. Coppola, M. Iodice, and M. Gioffré, "Tunable two-dimensional hexagonal phase array in domain-engineered Z-cut lithium niobate crystal," Opt. Lett. 31, 3164-3166 (2006). F. Zhang and I.Yamaguchi, L. P. Yaroslavsky, “Algorithm for reconstruction of digital holograms with adjustable magnification”, Opt. Lett. 29, 1668-1670 (2004). L. E. Myers, R. C. Eckardt, M. M. Fejer, R. L. Byer, W. R. Bosenberg, and J. W. Pierce, "Quasi-phasematched optical parametric oscillators in bulk periodically poled LiNbO3," J. Opt. Soc. Am. B 12, 2102-(1995).
Proc. of SPIE Vol. 6995 699505-8


![FREE [DOWNLOAD] ANALOG AND DIGITAL HOLOGRAPHY WITH ...](https://m.moam.info/img/260x300/free-download-analog-and-digital-holography-with-_64789c0c097c4744708d05ff.jpg)


