1
DIPKIP: A Connectionist Knowledge Management System to Identify Knowledge Deficits in Practical Cases Álvaro Herrero1, Emilio Corchado1, Lourdes Sáiz1, and Ajith Abraham2 1
Department of Civil Engineering, University of Burgos C/ Francisco de Vitoria s/n, 09006 Burgos, Spain Tel/Fax: +34 947 25 93 95 {ahcosio, escorchado, lsaiz}@ubu.es
2
Centre for Quantifiable Quality of Service in Communication Systems Norwegian University of Science and Technology Trondheim, Norway
[email protected]
2
Abstract - This study presents a novel, multidisciplinary research project entitled DIPKIP (Data acquisition, Intelligent Processing, Knowledge Identification and Proposal), which is a Knowledge Management (KM) tool that profiles the KM status of a company. Qualitative data is fed into the system which allow it not only to assess the KM situation in the company in a straightforward and intuitive manner, but also to propose corrective actions to improve that situation. DIPKIP is based on four separate steps. An initial 'data acquisition step', in which key data is captured, is followed by an 'intelligent processing' step, using neural projection architectures. Subsequently, the 'knowledge identification' step catalogues the company into three categories, according to a set of theoretical situations that can arise in the field of strategic knowledge: knowledge deficit, partial knowledge deficit and no knowledge deficit. Finally, a 'proposal step' is performed, which weighs up the 'knowledge processes' of creation/acquisition, transference/distribution and putting into practice/updating. This process of knowledge updating (increasing the knowledge held and removing obsolete knowledge) is a novel contribution in itself, which to the best of our knowledge has not been considered elsewhere. DIPKIP can be seen as a decision support system, which, under the supervision of a KM expert, can provide useful and practical proposals to senior management for the improvement of KM, leading to flexibility, cost savings and greater competitiveness. This study approaches KM from both a theoretical and a practical point of view. It describes the impact that transformations can have on individual and organizational responsibilities, from the lowest states (data and information) to the highest (knowledge and its management). The study also analyses the future for powerful neural projection models in the emerging field of KM by reviewing a variety of robust unsupervised projection architectures, all of which may be characterized by their ability to visualize the intrinsic structure of high-dimensional data sets. The main projection architecture in this research, known as Cooperative MaximumLikelihood Hebbian Learning (CMLHL), manages to capture a degree of KM topological ordering based on the application of cooperative lateral connections. CMLHL employs an unsupervised learning method, and was used for the first time in the field of artificial vision. Two real-life case studies in very different industrial sectors were conducted, the results of which corroborated the relevance and viability of the DIPKIP system and the concepts upon which it is founded.
Keywords-- Data and knowledge visualization, Connectionism and neural nets, Knowledge-based systems, Knowledge management applications, Discovery-based science.
3
I. INTRODUCTION AND PREVIOUS WORK Knowledge Management (KM), a relatively new and fast-growing discipline, enables organizations to capture, share, and apply the collective experience and know-how (knowledge) of their staff, which is fundamental to competing in the knowledge economy. Currently, the exponential increase of data may be viewed as an important and essential source of information that may eventually be turned into knowledge. KM can be successfully applied in organizations by developing and implementing knowledge infrastructures (Sivan 2000). These knowledge infrastructures consist of three main dimensions: people, organizational and technological systems. However, from a KM point of view, knowledge is defined as information that is relevant for business actions (Strohmaier 2003). This research is mainly based on an understanding of the distinctions between transformations in states of data and knowledge: from the lowest level (raw data and information) up to higher levels, such as knowledge itself and its management, and individual or organizational responsibilities. Nowadays, a heterogeneous set of KM technologies (Maier and Remus 2002), (Maurer and Tochtermann 2002), (Rollett 2003), (Nielsen and Michailova 2007) is available from industrial vendors (Hyperwave), (OPENTEXT), (IBM) as well as from academia (Woitsch and Karagiannis 2002), (Dustdar 2002), (Wang 2004), (Chen et al. 2005). In recent years, rapidly evolving information technology has become a crucial tool for enterprises to achieve a competitive advantage and organizational innovation (Shu-Mei 2008). In keeping with this idea, AI can be applied as a technological tool in KM systems in order to speed up processes, classify unstructured data formats that KM is unable to organize, visualize the
4
intrinsic structure of data sets, and pick out the knowledge required by employees from within large amounts of data, among other processes. AI methods include those able to analyze massive data sets. For instance, clustering reduces the quantity of data items by grouping them together. Methods also exist that can be used to reduce the dimensionality of the data sets and provide an interesting visualization of their internal structures. Among these are the so-called “projection” methods, which are based on the identification of “interesting” directions, in terms of any one specific index or projection (See Section II for further details). In this study, unsupervised learning models are applied, the advantage of which is that the neural network undergoes reorganization with respect to its internal parameters, without external prompting, due to reactions with selected aspects of the input data. Typically this will be either redundancy in the input data or clusters in the data; i.e. there must be some inner structure in the data to which it can respond. The study describes the development and testing of DIPKIP (Data acquisition, Intelligent Processing, Knowledge Identification and Proposal), a novel KM system that identifies the KM status of a company or of individual company units (staff members, departments, divisions, etc.). It is based on 4 steps: Data acquisition, Intelligent Processing, Knowledge Identification and a final Proposal. Both the intelligent processing step (based on the application of neural projection methods) and the proposal steps are worth emphasizing. Empirical tests on two case studies confirm the validity of this projection-based approach. Contributions made by authors such as (Ruggles 1997), (Wiig 1994), (Marguardt 1996), (Beckman 1997), (Holsapple and Joshi 2002), (Taylor 2007), (Weissor, Sheng-Tun, and Kuan-Ju 2008), (Wei-Wen 2008), (Wu, Ong, and Hsu 2008) were given preferential attention in the formulation of the proposed model, to which the “updating of knowledge” process has been
5
added. This process is one of the main strengths of DIPKIP because it helps to complement the design of KM models that are currently of such great interest to companies. The paper is structured in the following way. Section 2 introduces some unsupervised neural projection methods. Section 3 describes DIPKIP, the proposed KM system, while Section 4 presents the main connectionist model applied in this study and, certain previous ones that have supported its development. Section 5 describes the empirical validation of this study, starting with the description of the two real-life case studies and the high-dimensional data sets they generated. Results, discussions and the comparative study are also presented in this section. Finally, Section 6 presents the conclusions and a number of proposals for future work in the same field.
II. UNSUPERVISED NEURAL MODELS AS A VISUALIZATION TOOL A key problem in the analysis of high-dimensional data sets lies in the identification of patterns that exist across dimensional boundaries. Such patterns may become visible if changes are made, to the spatial coordinates; however an a priori decision as to which parameters will reveal most patterns requires prior knowledge of unknown patterns. When researchers originally investigated high-dimensional and complex information such as spectroscopic data sets, they were looking for intrinsic structure by generating a scatter plot matrix in which they plotted each dimension of the data against one another. This technique rapidly became less viable as the dimensionality of the data increased. Investigators later used techniques such as Principal Component Analysis (PCA) to provide a single projection in an
6
effort to provide as much information as possible. In the obtained projections, unlike PCA, there is no ordering, but the number of factors is reduced to a manageable level to generate scatter plot matrices that facilitate a visual search for the structure. Projection methods project data points onto lower dimensions and try to identify “interesting” directions in terms of any one specific index or projection. Such indexes or projections are, for example, based on the identification of directions that account for the largest variance of a data set (such as PCA) or the identification of higher-order statistics such as skewedness or kurtosis, as in the case of Exploratory Projection Pursuit (EPP). Having identified the interesting projections, the data is then projected onto a lower dimensional subspace plotted in two or three dimensions, which allows its structure to be examined with the naked eye. The remaining dimensions are discarded as they mainly relate to a very small percentage of the information or the data set structure. Thus, the structure is identified through a multivariable data set and may be visually analyzed with greater ease. The combination of EPP together with the use of scatter plot matrices constitutes a very useful visualization tool to investigate the intrinsic structure of multidimensional data sets, allowing experts to study the relations between different components, factors or projections, depending on the technique that is used. In this research, the results are interpreted by KM experts. Projection techniques have proven themselves to be powerful tools in the successful development of KM systems, such as DIPKIP. Section V describes the way in which it is used to categorize the requirements for the acquisition, transfer, and updating of knowledge in two different real-life case studies. This section reviews certain projection models applied in the experimental study of this work for comparison purposes.
7
A. Principal Component Analysis PCA (Hotelling 1933), (Pearson 1901) describes the variation in a set of multivariate data in terms of a set of uncorrelated variables, in decreasing order of importance, each of which is a linear combination of the original variables. Using PCA it is possible to find a smaller group of underlying variables that describe the data, with the result that the first few components of such a group might explain most of the variation in the original data. It should be noted that even if we are able to characterize the data with a few variables, it does not follow that an interpretation will ensue. This statistical technique may be performed by using connectionist models (Oja 1989), (Sanger 1989), (Fyfe 1997).
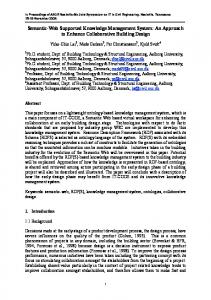
B. Exploratory Projection Pursuit EPP (Friedman and Tukey 1974) is a statistical technique for solving the complex problem of identifying structure in high-dimensional data. It involves low-dimensional data projections in which structure is identified by eye and requires an index of “interestingness” by which each projection is measured. Subsequently, the data is transformed by optimizing this index, in order to examine the projections of greatest interest in greater detail. From a statistical point of view the most interesting directions are those which are as non-Gaussian as possible. Typical random data set projections are usually Gaussian (Diaconis and Freedman 1984), so identification of the most interesting features in the data calls for further investigation of these “interesting” directions. Once again, this statistical technique may be implemented by using connectionist models (Hyvärinen 1998), (Hyvarinen 2001), (Corchado, MacDonald, and Fyfe 2004), (Fyfe, Baddeley, and McGregor 1994). In order to compare this technique with PCA, the results on a standard data set composed of two-dimensional disjointed clusters are shown. Each one of these
8
clusters is composed of a direction of greater variance and one of smaller variance. The clusters are linearly separable along their longest axis. As illustrated in Fig. 1, PCA finds the longest axis as the first principal component, since it responds to the maximum variance in the data set. Fig. 2 shows the projection of the data set obtained by PCA Fig. 3 shows the projection of the data set obtained by EPP, which clearly shows a complete separation along the first axis.
Second Principal Component
First Principal Component
Fig. 1. Principal directions found by PCA.
Fig. 2. PCA projection.
Fig. 3. EPP projection.
C. Self-Organizing Map The Self-Organizing Map (SOM) (Kohonen 1990) was developed as a visualization tool for high dimensional data on a low dimensional display. It is also based on the use of unsupervised learning, but it is a topology-preserving-mapping model rather than a projection architecture. Composed of a discrete array of L nodes arranged on an N-dimensional lattice, it maps these
9
nodes into a D-dimensional data space while preserving their ordering. The dimensionality of the lattice (N) is normally less than that of the data, in order to perform the dimensionality reduction. An input vector is presented to the network and a winning node c is chosen, whose weight vector has the smallest Euclidean distance from the input. Thus, the SOM quantizes data vectors to the reference vector in the map that is closest to the input vector. The weights of the winning node and the nodes close to it are then updated to move closer to the input vector. When this algorithm is sufficiently iterated, the map self-organizes to produce a topology-preserving mapping of the lattice of weight vectors to the input space based on the statistics of the training data. This neural model is applied here for comparative purposes, as it is one of the most widely used unsupervised neural models for visualizing structure in high-dimensional data sets.
D. Curvilinear Component Analysis Curvilinear Component Analysis (CCA) (Demartines and Herault 1997) is a nonlinear dimensionality reduction method that was developed as an improvement on the SOM. It tries to circumvent the limitations inherent in previous linear models, such as PCA. The principle of CCA is a self-organized neural network performing two tasks: a vector quantization of the submanifold in the data set (input space) and a neural nonlinear projection of these quantizing vectors toward an output space, providing a revealing view of the way in which the submanifold unfolds. The projection part of CCA is similar to other nonlinear mapping methods; in that it minimizes a cost function based on interpoint distances in both input and output spaces. Quantization and nonlinear mapping are separately performed by two layers of connections. Firstly, the input vectors are forced to become prototypes of the distribution using a vector quantization (VQ) method. Then, the output layer builds a nonlinear mapping of the input
10
vectors by considering Euclidean distances. In the empirical part of this work, a slight modification of standard CCA has been used. Instead of the Euclidean metric, the linear mapping built by the output layer considers the cosine distance metric, which takes account of the differences between the angles of the vectors obtained by VQ. Some other distances were tested in this work, but CCA based on cosine distance achieved the best results.
III. DIPKIP, A NOVEL KNOWLEDGE MANAGEMENT SYSTEM This paper proposes a novel KM system (see Fig. 4) to support decisions that enable efficient KM in a company. The system identifies expertise and experts, ascertains whether knowledge is put to good use, calculates the percentage of knowledge that is used, and identifies lack of knowledge. Once the diagnosis is ready, DIPKIP proposes a set of solutions to enhance some situations related to the absence of certain types of knowledge, its updating or sharing. Hence, it allows the diagnosis and improvement of administrative or operating units (staff members, departments, divisions, etc.). The system is directed at KM managers whose goal is to improve the KM situation of a company.
11
Fig. 4. DIPKIP: the KM system proposed in this study.
The four steps of DIPKIP shown above in Fig. 4 are described below in detail.
A. First Step: Data Acquisition The first step aims to capture information concerning the situation in which DIPKIP is to be applied. As it is a general solution to identify the KM status of different company units, the KM manager is responsible for designing how to gather the information that must be fed into the model, which could be acquired through interviews, surveys, database mining, a combination of some of them, and so on. The key issue concerning this step is to decide which information is useful and which is irrelevant when determining the KM situation of the units under study.
B. Second Step: Intelligent Processing The second step is intelligent processing, by which the data obtained in the first step is
12
analyzed through Cooperative Maximum-Likelihood Hebbian Learning (CMLHL). This model (described in Section III) provides a visualization of the internal structure of the data set (in the case study) which allows the KM expert to move on the third step of this KM system: 'knowledge identification'. For comparison purposes, other unsupervised neural models such as PCA, CCA and SOM were also tested at this stage. CMLHL was chosen for this step as it obtained the best projections in the case studies (see sections VI and VII).
C. Third Step: Knowledge Identification The output of the second step is a projection of the data acquired in the first step. The projection models embedded in the second step can be generalized as visualization tools. These tools rely on the human capacity to process visual information, by performing exploratory browsing in a search for patterns and exceptions (Ahlberg and Shneiderman 1994). Then, at this stage of the DIPKIP system, the KM expert, based on the connectionist projection model, catalogues the company into one of three classes, according to the situations that can arise in the field of strategic knowledge - knowledge deficit, partial knowledge deficit and no knowledge deficit.
D. Fourth Step: Proposal Finally, the fourth step of the DIPKIP model is the proposal, where the following knowledge processes are proposed: creation/acquisition, transference/distribution and putting into practice/updating. The processes to be addressed are related to an underlying knowledge model based on the following knowledge life-cycle: 1. Knowledge creation/acquisition.
13
2. Knowledge transference/distribution. 3. Knowledge update. 4. Return to step 1 and restart the life-cycle. Once the company is catalogued into one of the three areas (knowledge deficit, partial knowledge deficit and no knowledge deficit), in the third step of DIPKIP, proposals are offered through the above-mentioned KM processes: Knowledge creation/acquisition, Knowledge transference/distribution and Knowledge update. The KM expert should know which processes are applicable for each company under analysis: o For knowledge deficit situations, the objective is to acquire or create the necessary knowledge. Before that, the shortcomings and the level or specificity of knowledge that is required must be detected and identified. At this point, some other issues must be considered: the way of acquiring the knowledge, quantifying its cost and estimating the urgency. o A partial knowledge deficit in an area indicates that knowledge is only available to experts and has neither been made explicit nor widely communicated within the organization. The organization holds critical knowledge, but it is not accessible to everybody needing it. Faced with this situation, the knowledge must be communicated and shared on a case-by-case basis; a process by which experts and potential usages are identified, and which involves a search for the means to express it and to make it available. o No knowledge deficit implies that people and the organization have mastered the required know-how and it is available to those who need it. It is worth emphasizing that previous contributions to KM (Wiig 1994; Ruggles 1997)
14
(Heinrichs and Lim 2005), (Nonaka and Toyama 2005), (Collins and Smith 2006), (Nielsen and Michailova 2007), (Donate-Manzanares and Guadamillas-Gomez 2007), (Kautz and Kjærgaard 2007), (Soo, Devinney, and Midgley 2007) have focused on knowledge creation, acquisition and transference. DIPKIP goes one step further, proposing a knowledge update process, which consists of increasing existing knowledge and examining it in depth to remove obsolete and useless knowledge. This is a novel contribution in itself, which to the best of our knowledge has never been considered elsewhere. A permanent knowledge update increases the availability of the latest knowledge on the market and the business of the company. Once DIPKIP has identified the required KM processes, the KM manager has to identify the specific actions to implement these processes. Some examples for each of the KM processes are detailed below: o Knowledge creation/acquisition: to plan specific training, identify problems and solutions, to promote group work with experienced colleagues, to request information and help from clients and suppliers, etc. o Knowledge transference/distribution: to document the knowledge held, to design knowledge maps, to encourage people to take part in open discussion forums, to manage the optimum size of work groups, etc. o Knowledge update: to foster personal creativity, to stimulate innovative mechanisms, to participate in knowledge communities including people from some other companies, to enable the use of Communication and Information Technologies (CIT), etc.
IV. A COOPERATIVE NEURAL PROJECTION METHOD The main architecture used in this study is the connectionist model known as Cooperative
15
Maximum-Likelihood Hebbian Learning (CMLHL) (Corchado and Fyfe 2003). It is based on Maximum-Likelihood Hebbian Learning (MLHL) (Corchado, MacDonald, and Fyfe 2004), and introduces lateral connections (Corchado, Han, and Fyfe 2003). This connectionist model has been chosen because it reduces data dimensionality while preserving the topology of the original data set. MLHL is a family of learning rules that is based on maximizing the likelihood of the residual from a negative feedback network whenever such residuals are deemed to come from a distribution in the exponential family. The main advantage of this model is that by maximizing the likelihood of the residual with respect to the actual distribution, we are matching the learning rule to the probability density function of the residual by applying different values of the "p" parameter specified in the learning rule. For an N-dimensional input vector ( ) and an M-dimensional output vector ( ) with being the weight linking input
to output , MLHL consists of the following stages:
The output of the network is calculated in the feedforward step: . The activation (
(1) ) is fed back through the same weights and subtracted from the input: .
(2)
And finally, the weights are updated: .
(3)
Where: !
represents the “strength” of the lateral connections.
16
is a parameter related to the MLHL energy function that is used to match the
!
probability density function and the learning rule. The extended connectionist model, known as CMLHL, includes lateral connections acting after the feedforward, but prior to the feedback step. The resulting learning scheme is therefore as follows: there is a feedforward step (Equation 1) followed by the following lateral activation step: .
(4)
Then, the feedback step, in equation 2, is followed by the weight change defined by equation 3, in which: !
is the bias parameter.
!
is a symmetric matrix used to modify the response to the data based on the relation between the distances between the output neurons.
!
is the learning rate.
1) Lateral Connections Lateral connections have been derived from the RGD (Seung, Socci, and Lee 1998), which is a modification of the standard Gaussian distribution in which the variables are constrained to be non-negative, enabling the use of non-convex energy functions. The Standard Gaussian Distribution may be defined by: (5)
.
.
in which, the quadratic energy function
(6) is defined by the vector
and the symmetric
17
matrix
. The parameter
is an inverse temperature. Lowering the temperature
concentrates the distribution at the minimum of the energy function. The factor integral of
normalizes the
to unity.
The cooperative distribution is chosen as its modes are closely spaced along a non-linear continuous manifold. The energy functions that can be used are those that block the directions in which the energy diverges towards negative infinity. Thus, the matrix has to fit the following property: . where
(7)
is the dimensionality of
.
The Cooperative Distribution in the case of
variables is defined by:
and
(8)
. in which, Matrix
(9) is the Kronecker delta, and
and
,
the output neuron identifiers.
is used to modify the response to the data based on the relation between the
distances between the outputs. The projected gradient method is used (Corchado, Han, and Fyfe 2003), consisting of a gradient step followed by a rectification: (10)
.
in which the rectification
is necessary to ensure that the
positive quadrant. If the step size
-values remain within the
is chosen correctly, this algorithm will probably be shown to
converge to a stationary point of the energy function (Bertsekas 1999). In practice, this stationary point is generally a local minimum.
18
The distribution mode can be approached by gradient descent on the derivative of the energy function with respect to : .
(11)
as used in (10). The resulting model (CMLHL) can expose the independent factors of a data set in a way that captures some type of global ordering in the data set and displays it with greater sparsity than other models. This connectionist model functions as a powerful tool with which to interpret and analyze interesting and important aspects of a KM system based on the knowledge held within an enterprise. Several versions of this model have successfully been applied to different datasets. Some of them are artificial, such as the well-known bars dataset (Corchado and Fyfe 2003), (Földiák 1992) while others are real, such as datasets on banking (Corchado, MacDonald, and Fyfe 2004), asteroids (Corchado, MacDonald, and Fyfe 2004), (Howell, Merényi, and Lebofsky 1994), (Cetin and Lewandowski 1991) and algae (Corchado, MacDonald, and Fyfe 2004). In this case, the model is applied to the second step of the DIPKIP KM system (intelligent processing), as presented in previous section, so as to categorize the needs relating to knowledge acquisition, transfer and updating. In the next section, we present the application of DIPKIP KM system in two real-life case studies.
2) Fine Tuning The CMLHL fine tunning process is based on the effect of changing the parameter
, which is
the strength of the lateral connections between the output neurons. Experiments were done (Corchado and Fyfe 2003) using the bars data set by Földiák (Földiák 1992) adding noise in a
19
graduated manner across the outputs. These experiments shown and probed that altering the strength of the lateral connection parameter affects the ability of the neural network to “gather” features together on the outputs. With a low value of
, the neural model achieves a coding of
both horizontal and vertical bars around a mode as predicted. If there is an increase of the value, the weak correlations between horizontal and vertical bars begin to have an impact on the learning. As the strength of the lateral connections becomes stronger, the bars are still learned around a mode but at the same time orientations start to separate. Then it is achieved a separation between the two different orientations, what is an interesting issue since all data presentations to the network consist of both horizontal and vertical bars. Increasing the value of
further forces the network to learn only one orientation of bars.
However, if the lateral connections are too strong, then the coding of the bars may be squashed into an area of the output space that is too small for all of the bars to be coded individually. The reason why one orientation of bars is suppressed is due to the pixel overlap between different orientations of bars. If the lateral excitation between the output neurons is strong enough, a single output neuron may be able to switch its preference from a horizontal bar to a vertical one. That orientation identification was considered (Corchado and Fyfe 2003) to be a precursor of the creation of the concept of horizontal/vertical in animals inhabiting a mixed environment.
V. EXPERIMENTAL DOMAIN In order to validate the DIPKIP model, it was applied to two very different real-life case studies: a multinational company in the automotive industry and a wall painting company. This section describes these two case studies and sets out the results of having applied the proposed model.
20
The two very different real-life case-studies were conducted at the request of companies that had previously expressed an interest in understanding the current situation and the future evolution of their knowledge assets The data sets are very diverse and represent two very different levels: a department within a multinational company (Automotive Industry case study), as opposed to that of a firm within a sector (“a group of companies that undertake the same economic activity at a regional level”) in the autonomous region of Castilla y León – Spain (Wall Painting case study). This diversity, along with the complexity of the cases in which DIPKIP has satisfactorily functioned, outlines the capacity for generalization of the proposed model. Despite the differences between each case-study, the model was able to perform an empirical test of the knowledge situations, which resulted in proposals for knowledge acquisition, transference, and updating. This last step entailed actions that led to successful and effective knowledge management in the company. The parametric values specified in the experimental setup were obtained after a fine-tuning process following detailed criteria described in previous studies (Corchado and Fyfe 2002), (Corchado, Han, and Fyfe 2003). The main parameters to be tuned were the p factor and the strength of the lateral connections (
). The axes that form these
projections are combinations of the features contained in the original datasets. The results obtained by CMLHL were compared with those obtained by the application of other dimensionality-reduction models (PCA, MLHL, SOM and CCA) and are shown at the end of each case study. Several experiments were required to tune the SOM to different options and parameters: grid size, batch/online training, initialization, number of iterations and distance criterion, among others. In the case of CCA, other parameters, such as initialization, epochs and distance criterion were tuned. Only the best results (from the standpoint of the projection), which
21
were obtained after tuning the models, are included in this work.
A. First Case Study: Automotive Industry This case study is related to a previous line of research (Corchado et al. 2005), (Corchado, Corchado et al. 2004), (Corchado, Fyfe et al. 2004) that analyzed a multinational market leader in the design and the manufacture of a wide range of components for the automotive industry. It was an opportune moment for such a choice as the managerial environment welcomed the introduction of KM. The multinational company was undergoing organizational change and facing high growth and expansion that required rapid adaptation to the demands of the sector. At the same time, it was handling greater resources, all of which entailed more imminent transference and more accurate forecasting of knowledge, together with a pressing need to capitalize on these factors by using and sharing them within the company. The design of the preliminary theoretical model of KM was based on three components: ! The Organization: concerning the strategy and people. ! Processes:
Creation/Acquisition,
Transference/Distribution,
and
Putting
into
practice/Updating. ! Technology: Technological Aids (on the basis of which the proposals in the model are defined). The DIPKIP data acquisition step in this case study was performed by interviewing the managers of the following departments in the company: New Business, Purchases, Marketing, Project Management, Improved Industrial Practices, Protection of Design and Technology, Finance, Human Resources, Quality, Organization, and Information Systems. The interviewees evaluated several areas of expertise: “Human Resources Management Abroad”, “Personnel
22
Selection Processes”, “International Mobility”, “Languages”, “Presentation Techniques”, “Patents Management”, “Positive Evaluation by Clients”, and “Environmental Strategy”, among others. Five features relating to each area were considered and measured in the following way: -
Current level of knowledge: absent (1), partial (3), enough (5) and expert (7).
-
Importance of the knowledge: important (3), very important (6) and essential (9).
-
Urgency to acquire knowledge: within the present year (9), next year (6) and later (1).
-
Level of knowledge that may be needed: basic (3), medium (6) and high (9).
-
Degree of the knowledge held by other departments within the company: non-existent (3), existent but not shared (6) and existent and shared (9).
They were converted into numerical values (in parentheses), for the application of the neural models. The total population amounted to 140 records. The different knowledge levels depicted the situation of each department with regard to their assigned tasks or to the activities that had to be implemented. Valuable data was also obtained on the degree of importance to the company of the knowledge gathered in this way, which helped to identify the knowledge deficit (that has to be overcome to perform the activity). This enabled the right decision to be taken in relation to the way in which the knowledge should be acquired, and the time and cost required to do so. It was also possible to specify knowledge that was not usefully employed, either because the employee did not use it to the full, or because it also had additional value and a potential use within other departments. Furthermore, the analysis also included the expected evolution of the knowledge level, so as to detect new knowledge, to eliminate obsolete knowledge and to validate new needs, among other aspects.
23
1) Results and Discussion The results shown in Fig. 5 were obtained after tuning the CMLHL model in order to apply the second step of the DIPKIP KM system: Intelligent Processing. The final values of the different parameters processed by CMLHL were: Number of iterations = 10,500, Learning rate = 0.13, p parameter = 0.7, and
parameter = 0.0015. Fig. 5 depicts all the possible combinations of the
factor pairs obtained through CMLHL. Factor pairs under the diagonal are not shown as they provide no extra information. The main results obtained by CMLHL (factor pairs 1-2 and 1-3 from Fig. 5) are analyzed in depth in this section. Factor 1 Pair
1
2
2
3
24
3
Fig. 5. CMLHL projections of the first 3 factors of the KM data. Second step of the DIPKIP KM system: Intelligent Processing.
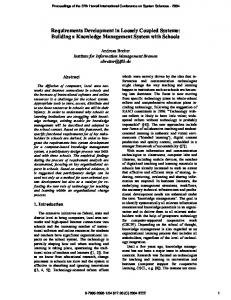
Fig. 6 presents the CMLHL projection of factor pair 1-2 taken from Fig. 5, which identified an intrinsic structure consisting of 9 groups (clouds). These groups are labeled (1A to 3C) and classified, as indicated in Fig. 7. The classification was obtained from the results of the third
25
DIPKIP step: Knowledge Identification.
1C 2C
3C
1B 2B 3B 1A 2A 3A
Fig. 6. The CMLHL projection based on factor pair 1-3 (from Fig. 5) for the Automotive Industry data set.
CLOUD 3C GROWTH STRATEGY later wide level
CLOUD 2C IMPROVEMENT STRATEGY later medium level
CLOUD 1C GOOD
CLOUD 3B ALARM
CLOUD 2B ALARM
during this year wide level
during this year medium level
CLOUD 1B ALMOST GOOD during this year basic level
CLOUD 3A CHAOS a lot of urgency wide level
CLOUD 2A CRITICAL a lot of urgency medium level
CLOUD 1A CRITICAL a lot of urgency basic level
later basic level
Fig. 7. Schematic diagram of the third DIPKIP step (Knowledge Identification)
26
for the Automotive Industry data set.
Cloud 1C is formed by samples which reflect a “GOOD” situation. In this case, all the records (departments) belonging to this group were classified as being in a “GOOD” situation because the required knowledge level is low, hence the assessment that knowledge acquisition was not a priority. Furthermore, the presence of only one record underlines that the knowledge that the company has to acquire is limited to only one specific area. In contrast, in the area occupied by Cloud 3A, there is great urgency to acquire knowledge at a wide level. This situation is labeled as “CHAOS”. Similarly, in the areas occupied by Clouds 1A and 2A, there is an urgent need to acquire knowledge at a medium and a basic level. In these cases, it might be said that knowledge is being withheld, a situation which could place the company in a “CRITICAL” situation, since it may influence all those parameters that somehow help to generate activity within the company, such as the concession of new projects, the incorporation of new clients, and so on. The points within Cloud 2C suggest that the company may acquire knowledge at a later stage in this area, but at a medium level, to improve its knowledge (“IMPROVEMENT STRATEGY”). The proposal arising from Cloud 3C is that knowledge should be acquired in the medium-to-long term but at a broader level, suggesting that the company should think about enlarging and growing, both in terms of new processes and products (“GROWTH STRATEGY”). Cloud 1B identifies an “ALMOST GOOD” situation, because knowledge is needed urgently and at a basic level. Clouds 2B and 3B identify an “ALARM” situation, as there is no urgency and knowledge is needed at a medium level. The CMLHL neural model clearly captures some kind of topological order. If we start at Cloud 3A and move to the right of the Fig. 6, the urgency of knowledge acquisition is the same, but the level decreases. On the contrary, if we move up through Fig. 6, the level is the same but the
27
urgency for knowledge acquisition decreases. Fig. 8 shows the CMLHL projection based on factor pair 1-2 (from Fig. 5), and Fig. 9 shows a diagram of this projection. The analysis of factor pair 1-2 (Fig. 8) provides a complementary viewpoint to the analysis of factor pair 1-3 (Fig. 6), and it helps us to relate the data in terms of shared characteristics or parameters. It is then a straightforward task to chart the knowledge situation of the company and to select the most appropriate strategy. The diagram from Fig. 9 is analyzed by the KM expert in the third step, to identify the KM situation of the departments under analysis.
MAXIMUM
MEDIUM
LOW
HIGH
MEDIUM
LOW
Fig. 8. The CMLHL projection based on factor pair 1-2 (from Fig. 5) for the Automotive Industry data set.
IMMEDIATE
KNOWLEDGE SHARING WITH OTHER AREAS OF THE FIRM
NO
KNOWLEDGE LEVEL THAT IS HELD BY THE FIRM
DEFICIT
URGENCY OF KNOWLEDGE ACQUISITION
KNOWLEDGE LEVEL NEEDED BY OTHER AREAS OF THE FIRM
LOW
MAXIMUM
STRATEGIC IMPORTANCE OF THE KNOWLEDGE
HIGH
YES
EXPERT
GRADUAL
28
LOW
Fig. 9. A diagram of factor pair 1-2 (from Fig. 8).
The different parameters contained in Fig.9 facilitate an analysis of Fig. 8: o Importance of the knowledge: it may be seen that the points in the upper-right section of Fig. 8 represent indispensable knowledge for the company, whereas points in the central positions represent less important knowledge, and those in the lower third represent the least important ones. In this case study, most of the knowledge identified by the company is strategically important. This identification of critical knowledge is a prior condition to reach the KM objectives. o Urgency of acquisition: the knowledge that has to be updated within the company or the extra knowledge that has to be acquired is set in a temporal context, ranging from most urgent (right half of Fig. 8) to least urgent (left half of Fig. 8). Half of the examined knowledge needs immediate acquisition or updating. On the basis of these results, it is relatively easy to decide on the most efficient strategies to propose in the fourth step, the acquisition and updating of the relevant knowledge, by employing specialized consultants or by providing staff training courses. o Knowledge level: there is a trend in which the right side and the centre of Fig. 8 contain the lowest levels of knowledge (knowledge deficit), while expert knowledge is
29
found in the upper left corner. Most of the knowledge is held at a medium level, while there is a slight tendency to move towards higher levels. In this case, the company must pay special attention to training and staff development policies that will manage to overcome the knowledge deficit, as well as organizational restructuring and redesign. o Sharing or diffusion of knowledge with other departments: the knowledge located towards the left-hand side of Fig. 8 represents very broad needs, and its necessity decreases as we move from right to left. Distribution of the knowledge required at medium and lower levels by other business areas is worse than that needed at a higher level. The fourth step of DIPKIP proposes resources and measures to enable knowledge sharing and diffusion in order to improve cooperation and mutual trust between workers and groups.
2) Step-by-step Sample Two departments (E and F) within the company were chosen to present each of the four DIPKIP steps in detail, subject to the usual constraints of business confidentiality. First Step: Data Acquisition In response to the detailed interviews, the manager of department E gave the following answers for a specific expertise: -
Current level of knowledge: partial (3).
-
Importance of the knowledge: essential (9).
-
Urgency to acquire knowledge: within the present year (9).
-
Level of knowledge that may be needed: basic (3).
-
Degree of the knowledge held by other departments within the company: non-existent (3).
30
On the other hand, the manager of department F, gave the following answers for the same area of expertise: -
Current level of knowledge: absent (1).
-
Importance of the knowledge: essential (9).
-
Urgency to acquire knowledge: within the present year (9).
-
Level of knowledge that may be needed: basic (3).
-
Degree of the knowledge held by other departments within the company: non-existent (3).
Second Step: Intelligent Processing After training the CMLHL model, both departments were identified as belonging to Group 1A (the worst situations from a KM point of view) in Fig. 6. Third Step: Knowledge Identification Group 1.A from Fig. 6 was identified as a “CRITICAL” situation, and both departments were diagnosed as having a “Knowledge Deficit”. Fourth Step: Proposal Having been identified as Knowledge Deficit situations, the proposal for these two departments was to acquire, create and generate the necessary knowledge. The outcomes of this step were specified in the following way: -
Department E: transfer the knowledge possessed by this department to the people that need it, providing incentives to those that already possess it. Moreover, it was recommended that the knowledge be documented by the person that receives it.
-
Department F: specific training on the relevant expertise and a 15-day training period in the company.
31
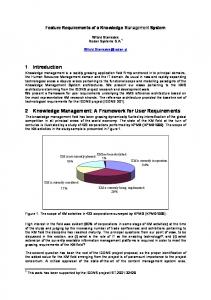
Finally, the detailed proposals were applied to validate the model. These two departments were originally identified (E1 and F1) as belonging to Group 1A. Once the employees had been trained, the surveys were conducted once again. The new situations of these departments following implementation of the DIPKIP proposals are depicted in Fig. 10 as E2 and F2 respectively. As shown, the situation of these departments has improved (from group 1A to groups 1B and 2A) by applying the outcomes of DIPKIP.
E2
1B
1A
F1
2A
E1 (b y pr oj ect Fig. 10. CMLHL projection (factor pair 1-2) for the Automotive Industry data set following corrective action io n proposed under the fourth step of DIPKIP. m od els 3) Comparison with other Unsupervised Methods ) F2
Fig. 11 shows the results obtained by using PCA. In this case, the neural implementation of PCA has identified a clear internal structure, based on six groups, but the resulting clustering is not as sparse as that obtained by CMLHL, which provides a more structured and interesting analysis by identifying nine clearly defined and ordered groups (Fig. 6).
32
Fig. 11. PCA projection for the Automotive Industry data set.
Fig. 12 shows the results obtained by using MLHL. This neural model has almost identified the same groups as CMLHL. The main advantages of the CMLHL projection is that the result is more spread out and that it identifies nine groups instead of the eight identified by MLHL, which may be explained by the inherent advantages of lateral connections.
33
Fig. 12. MLHL projection (factor pair 1-2) for the Automotive Industry data set.
Fig. 13.a shows the U-matrix of the best result obtained by the SOM, which was unable to visualize any interesting internal structures.
34
(a)
(b)
Fig. 13. SOM mapping for the Automotive Industry data set: (a) U-matrix (b) lattice.
By analyzing the CCA result shown in Fig. 14 we can say that, in general terms, this mapping only takes account of the information on the importance of the knowledge, the urgency in its acquisition and the degree to which it is held by other departments within the company. The other variables (current level of knowledge and level of knowledge that may be needed) are not taken into account at all. Group 1 in Fig. 14 contains classes of knowledge of low importance and with a low urgency of acquisition. These features are related to classes of knowledge that are not crucial for the company and that are held at a medium level by other departments.
35
3
1
2
STRATEGIC IMPORTANCE OF THE KNOWLEDGE
HIGH
KNOWLEDGE SHARING WITH OTHER AREAS OF THE FIRM
LOW
HIGH
LOW
URGENCY OF KNOWLEDGE ACQUISITION
HIGH
LOW
Fig. 14. CCA projection for the Automotive Industry data set.
Fig. 15. Diagram of CCA projection (Fig. 14).
Group 2 (Fig. 14) shows classes of knowledge with a medium level of importance and urgency.
36
These are strategic classes of knowledge in the generation of competitive advantages. They are held at a medium level by other departments. Finally, those records contained in group 3 (Fig. 14) have the highest level of importance and urgency. There is no order within this group when taking the current level of these classes of knowledge into account. Taking these points into consideration, the diagram in Fig. 15 describes the projection shown in Fig. 14.
B. Second Case Study: Wall Painting The second case study examined the knowledge situation of various wall painting companies in a medium-sized Spanish city and the data under analysis was taken from a survey of their staff. In this case study, the DIPKIP data acquisition step may be described as follows: a total of 68 records (interviews with workers) from 39 different companies were surveyed. The information contained in the 88-feature data set relates to 21 painting techniques (brush painting, spray varnishing, plaster or stucco work, etc...). For each one of these techniques, the survey measured the 4 following factors: -
Knowledge level held.
-
Willingness to acquire new knowledge.
-
Interest in updating the knowledge held.
-
Interest in sharing the knowledge held.
The first of these factors takes a value that ranges from 2 (lowest level of knowledge) to 8 (highest level of knowledge), while the other 3 factors take values of either 0 or 1. In addition to these 84 technique-related features (4 features per 21 techniques), a further 4 features (concerning general issues such as training and protection) were added to each record to form the 88-feature data set.
37
1) Results and Discussion Fig. 16 shows the best CMLHL projection (factor pair 1-2), which allows us to identify 9 different groups (labeled as 1A, 1B, 1C, 2A, 2B, 2C, 3A, 3B and 3C). The final values introduced into CMLHL were: number of iterations = 8,000, learning rate = 0.0162, p parameter = 1.36, and
parameter = 0.00802.
3B 3C 3A
2C
2B
2A
1A
1C 1B
Fig. 16. CMLHL best projection (factor pair 1-2) for the Wall Painting data set. Third step of DIPKIP: Knowledge Identification.
Fig. 17 presents a diagram of Fig. 16 showing the classifications for this second case study.
38
MAXIMUM
LOW
INTEREST IN UPDATING THE KNOWLEDGE HELD
LOW
WILLINGNESS TO SHARE THE KNOWLEDGE HELD
KNOWLEDGE LEVEL HELD
HIGH
MAXIMUM
LOW
Fig. 17. Diagram of factor pair 1-2 (from Fig. 16).
An in-depth analysis (from a KM point of view) of the CMLHL projection of factor pair 1-2 led to the following conclusions: • Group 3C: this group contains the best records (in general terms). All these records reflect the highest levels of knowledge among workers, the greatest interest in updating their knowledge and a willingness to share their knowledge with other colleagues. The convergence of these characteristics reflects responsible KM practices. • Group 2C: the necessary skills for the job are known at a medium-high level, but this level is lower than the level held by group 3C. There is a high interest in acquiring new knowledge within this group. These workers are aware of the importance of updating the knowledge but in contrast, their interest in sharing the knowledge they hold with other companies is at a medium level. • Group 1C: the level of knowledge held by workers is very low and some of the most important skills are not present. The same is true with respect to the updating of knowledge: it reaches the lowest levels or is completely absent. Nevertheless, like previous groups, they exhibit a high interest in knowledge updating. • Group 3B: the only difference between this group and group 3C is that group 3B has a
39
medium interest in dealing with these issues, while group 3C has the highest one. • Group 2B: most of the workers within this group have medium levels of knowledge in all the related areas. Their lowest level relates to sharing the knowledge. • Group 1B: this group is similar to group 1C, but its situation is even worse. The workers in this group are not really interested in sharing the low level of knowledge they hold. • Group 3A: these records reflect good knowledge of painting skills but updating their knowledge does not appear to be very important for the workers concerned. The best feature of this group is a high interest in sharing the knowledge. • Group 2A: a medium-high level of knowledge is held within this group, but it has a low interest in updating and acquiring it. • Group 1A: the worst situations (from a KM point of view) are included in this group. This reflects the lowest levels of knowledge and interest in both acquiring and updating current knowledge. These conclusions are summarized in Fig. 17. By moving from left to right, it may be seen how the level of interest in updating the knowledge increases. On the other hand, the “Knowledge level held” and the “Willingness to share the knowledge held” increase from the bottom to the upper-left-hand side of the graph. An additional CMLHL factor pair projection was also investigated. The second best projection is associated with factor pair 1-3 and is shown in Fig. 18. Having analyzed factor pair 1-3, the conclusion was that 3 main groups could be identified. The data is grouped (in a general way) according to the variables “current level of knowledge” and “interest in updating the knowledge held”. Group 3 contains the workers with the highest levels of the previously mentioned variables, while group 1 contains the companies with the lowest interest in updating the
40
knowledge. It may be concluded for the Wall Painting data set that factor pair 1-3 maps the data in a complementary way to the CMLHL projection of factor-pair 1-2 .
1 2 3
Fig. 18. CMLHL projection (factor pair 1-3) for the Wall Painting data set.
2) Step-by-step Sample Two employees (R and Q) from different companies were selected to describe the entire DIPKIP system in detail, as in the previous case study. First Step: Data Acquisition Once the detailed interviews were designed, answers from the two employees were collected. As previously mentioned in the case-study description, 88 questions were answered by each employee. Thus, it is not possible to present all the acquired data, although some information
41
may be supplied. The answers from employee Q to the questions on spray varnishing (one of the 21 painting techniques) were: -
Knowledge level held: 6.
-
Willingness to acquire new knowledge: 1.
-
Interest in updating the knowledge held: 0.
-
Interest in sharing the knowledge held: 0.
In the other hand, employee R provided the following answers to the same questions: -
Knowledge level held: 6.
-
Willingness to acquire new knowledge: 0.
-
Interest in updating the knowledge held: 0.
-
Interest in sharing the knowledge held: 0.
Second Step: Intelligent Processing After training the CMLHL model for this dataset, both employees were identified as belonging to Group 1A in Fig. 16. As previously mentioned, this group reflects the lowest levels of knowledge and interest in both acquiring and updating current knowledge. Third Step: Knowledge Identification These two situations were diagnosed as having a “Knowledge Deficit”, which is borne out by their belonging to group 1A. Fourth Step: Proposal Having been identified as Knowledge Deficit situations, the proposal for these two departments is to acquire, create and generate the necessary knowledge. The outcomes of this step were specified in the following way: -
Employee Q: reduce the cost entailed in sharing knowledge (above all with regard to
42
time and commitment) for the employee that holds it. Put mechanisms in place that will allow the employee to stay abreast of the latest developments in the profession. -
Employee R: create work spaces that are shared between various people.
As in the previous case study, the detailed proposals were applied in order to validate the model. These two employees were originally identified (Q1 and R1) as belonging to Group 1A. The new situations of these employees after following the DIPKIP proposals are depicted in Fig. 19 as Q2 and R2 respectively. As shown below, the situation of these employees is improved (from group 1A to groups 1BC and 2A) by applying the outcomes of DIPKIP.
2A
Q2 1C
R2
R1
Q1 1A
Fig. 19. CMLHL projection (factor pair 1-2) for the Wall Painting data set following corrective action proposed under the fourth step of DIPKIP.
Company R (labeled as R1 in the original data set) is now included in group 1C as R2. As in group 1A, the level of knowledge held by the workers in group 1C is very low. On the contrary, records in group 1C exhibit a high interest in knowledge updating, while group 1A represents the lowest levels of interest in acquiring new knowledge and updating existing ones. Company Q (labeled as Q1 in the original data set) is now found in group 2A as Q2. The main
43
difference between this group and the initial one (group 1A) relates to the level of knowledge held for different techniques.
3) Comparison with other Unsupervised Methods As is evident in Fig. 20, the two first principal components can not clearly identify the inner structure of the dataset. Fig. 21 depicts the results obtained by using MLHL and as can be seen, the mapping obtained for the Wall Painting data set is not as sparse as that obtained by CMLHL (Fig. 16).
Fig. 20. PCA projection for the Wall Painting data set.
44
Fig. 21. MLHL projection (factor pair 1-2) for the Wall Painting data set. In this data set, neither SOM (Fig. 22), nor CCA (Fig. 23) were able to identify interesting structures for the application of the third step of DIPKIP.
45
(a)
(b)
Fig. 22. SOM mapping of the Wall Painting data set: (a) U-matrix (b) lattice.
46
Fig. 23. CCA projection of the Wall Painting data set.
VI. CONCLUSIONS AND FUTURE WORK In this study, KM is understood as a system that integrates its specific functions and processes to create/acquire, transfer/distribute and put into practice/update the ideas and knowledge held by a company and its personnel. By doing so, KM, in its various forms, allows people to achieve greater levels of creativity, ensures permanent training and recycling in their specialist areas and helps them to share and pass on the benefits of their knowledge to other workers, who are also willing to integrate the knowledge held by their colleagues into their own work. In this context, DIPKIP (Data acquisition, Intelligent Processing, Knowledge Identification and Proposal), a
47
novel, neural KM system, has been applied in two different real-life case studies. This model seeks to analyze the knowledge situation and propose improvements from the standpoint of KM. This research also analyzed the impact of the proposals, which were applied in the case studies to demonstrate the way in which DIPKIP was able to improve the KM level. In both cases, DIPKIP proved itself to be a robust tool for the analysis and identification of critical situations that enable companies to take decisions in the field of KM, concerning the acquisition, transfer and updating of the knowledge. DIPKIP also adds an original process to KM referred to as the Updating of Knowledge. This enables the company to make use of the latest knowledge, access the most recent innovations and keep the KM system updated with all of its attendant benefits. One of the main objectives propelling this study was the desire to introduce greater rigor and robustness into the field of KM research, thereby bridging the gap between theoretical formulations and satisfactory practical applications. The model ensures a complete diagnosis of the current situation, and subsequently an appropriate decision-making process for the effective application of the actions that it proposes in response to such situations. The application of the neural projection architecture to the new KM system presented in this study not only enabled data to be grouped together and ordered, but it also produced results of great interest that may be used in decision-making. Among these results, the following may be highlighted. The location of the knowledge is clearly identified according to the particular parameters used in the study, such as importance, level of urgency or diffusion of knowledge. This technique enables the KM situation in any company to be mapped out in a very short space of time and it is consequently of use in the related decision-making process. More specifically, the results verify:
48
o whether the knowledge or knowledge deficit of the company is critical to the implementation of its strategy. o the level at which the knowledge is held or should be held. o whether its acquisition or updating is urgent. o whether such knowledge is shared between the people in the company who require it. The data sets under study provide information on the characteristics of the knowledge held by a company or companies. Additionally, they can also justify a variety of actions, on a case by case basis, to situate knowledge in the best possible spaces, to move it between areas and to abandon knowledge that is no longer advisable or is ineffective. In short, the KM system described in this research may be used to identify the knowledge held by a company in an easy and accurate manner and to map out actions for progress in the future. Alternative methods such as PCA, MLHL, SOM or CCA were evaluated when performing the second step of DIPKIP (Intelligent Processing). CMLHL was shown to provide sparser projections and to capture some type of global ordering in the data sets. In conclusion, we may say that a novel system for KM is proposed in this research, which responds to the need for information management and knowledge flows within a KM organization, through the introduction of updating processes in the KM system. Future work will be based on the study of different distributions and learning rules to improve the architecture as a whole, and it is anticipated that this neural architecture will eventually be embedded inside a more complex hybrid KM system. An upgraded version of DIPKIP is also envisaged in the future. The model will be extended in order to improve its outcomes by building a map of “Knowledge Lines”. In some situations (as in the Automotive Industry case study), different classes of knowledge processed by DIPKIP
49
could form a knowledge line. These classes of knowledge share certain features that make them quite interesting from a KM perspective. They concern information gathered from different departments within the same company, which the present version of DIPKIP is unable to integrate. However, DIPKIP is capable of being extended, so as to catalogue various classes of knowledge in a map of knowledge lines. Once the strategic lines of knowledge are identified, DIPKIP could then propose corrective actions concerning different classes of knowledge and different departments.
REFERENCES Ahlberg, Christopher, and Ben Shneiderman. 1994. Visual Information Seeking: Tight Coupling of Dynamic Query Filters with Starfield Displays. Paper read at Proceedings of the SIGCHI conference on Human Factors in Computing Systems, at Boston, Massachusetts, United States. Beckman, T. 1997. A Methodology for Knowledge Management. Proceedings of the IASTED International Conference on AI and Soft Computing. Bertsekas, D. P. 1999. Nonlinear Programming: Athena Scientific Belmont, Mass. Cetin, H., and D. Lewandowski. 1991. Interactive Classification and Mapping of Multi-dimensional Remotely Sensed Data using N-dimensional Probability Density Functions. Photogrammetric Engineering and Remote Sensing 57:1579-1587. Collins, C. J., and Keng Smith. 2006. Knowledge Exchange and Combination: the Role of Human Resource Practices in the Performance of High-Technology Firms. The Academy of Management Journal (AMJ) 49 (3):544-560. Corchado, E., J. M. Corchado, L. Saiz, and A. Lara. 2004. Constructing a Global and Integral Model of Business Management Using a CBR System. Paper read at CDVE 2004. Corchado, E., and C. Fyfe. 2002. Maximum and Minimum Likelihood Hebbian Rules for Exploratory Projection Pursuit. In ICONIP'02: Proc. of the 9th Int. Conf. on Neural Information Processing - Computational Intelligence for the E-Age, edited by L. Wang, J. C. Rajapakse, K. Fukushima, S. Y. Lee and X. Yao. ———. 2003. Connectionist Techniques for the Identification and Suppression of Interfering Underlying Factors. Int. Journal of Pattern Recognition and Artificial Intelligence 17 (8):1447-1466. Corchado, E., C. Fyfe, L. Saiz, and A. Lara. 2004. Development of a global and integral model of business management using an unsupervised model. Paper read at IDEAL 2004. Corchado, E., Y. Han, and C. Fyfe. 2003. Structuring Global Responses of Local Filters Using Lateral Connections. Journal of Experimental & Theoretical Artificial Intelligence 15 (4):473-487. Corchado, E., D. MacDonald, and C. Fyfe. 2004. Maximum and Minimum Likelihood Hebbian Learning for Exploratory Projection Pursuit. Data Mining and Knowledge Discovery 8 (3):203-225. Corchado, Emilio, Juan Corchado, Lourdes Sáiz, and Ana Lara. 2005. A Beta-Cooperative CBR System for Constructing a Business Management Model. Paper read at Advances in Data Mining. Chen, Liming, Nigel Richard Shadbolt, Feng Tao, Carole Goble, Colin Puleston, and Simon James Cox. 2005. Semantics-assisted Problem Solving on the Semantic Grid. Computational Intelligence 21 (2):157-176. Demartines, P., and J. Herault. 1997. Curvilinear Component Analysis: A Self-Organizing Neural Network for Nonlinear Mapping of Data Sets. IEEE Transactions on Neural Networks 8 (1):148-154. Diaconis, P., and D. Freedman. 1984. Asymptotics of Graphical Projection Pursuit. The Annals of Statistics 12 (3):793-815.
50
Donate-Manzanares, M., and F. Guadamillas-Gomez. 2007. The Relationship Between Innovation and Knowledge Strategies: its Impact on Business Performance. International Journal of Knowledge Management Studies 1 (3):388-422. Dustdar, Schahram. 2002. Collaborative Knowledge Flow - Improving Process-Awareness and Traceability of Work Activities. Paper read at Proceedings of the 4th International Conference on Practical Aspects of Knowledge Management. Földiák, P. 1992. Models of Sensory Coding, PhD thesis, University of Cambridge. Friedman, J. H., and J. W. Tukey. 1974. A Projection Pursuit Algorithm for Exploratory Data-Analysis. IEEE Transactions on Computers 23 (9):881-890. Fyfe, C., R. Baddeley, and D.R. McGregor. 1994. Exploratory Projection Pursuit: an Artificial Neural Network Approach. In Research Report/94/160, University of Strathclyde. Fyfe, Colin. 1997. A Neural Network for PCA and Beyond. Neural Processing Letters 6 (1-2):33-41. Heinrichs, John H., and Jeen-Su Lim. 2005. Model for Organizational Knowledge Creation and Strategic Use of Information: Research Articles. Journal of the American Society for Information Science and Technology 56 (6):620-629. Holsapple, C. W, and K.D. Joshi. 2002. Knowledge Management: A Three-Fold Framework. The Information Society 18 (1):47-64. Hotelling, H. 1933. Analysis of a Complex of Statistical Variables Into Principal Components. Journal of Education Psychology 24:417-444. Howell, E. S., E. Merényi, and L. A. Lebofsky. 1994. Using Neural Networks to Classify Asteroid Spectra. Journal of Geophysical Research 99 (E5):10847-10865. Hyperwave. Knowledge Management Software [cited 10/16/2008]. Available from http://www.hyperwave.com. Hyvarinen, A. 2001. Complexity pursuit: Separating interesting components from time series. Neural Computation 13 (4):883-898. Hyvärinen, A. 1998. New Approximations of Differential Entropy for Independent Component Analysis and Projection Pursuit. Paper read at Proceedings of the 1997 Conference on Advances in Neural Information Processing Systems. IBM. Lotus, Knowledge Management Software [cited 10/16/2008]. Available from http://www01.ibm.com/software/lotus/. Kautz, K., and A. Kjærgaard. 2007. Towards an Integrated Model of Knowledge Sharing in Software Development: Insights from a Case Study. International Journal of Knowledge Management 3 (2):91-117. Kohonen, T. 1990. The Self-Organizing Map. Proceedings of the IEEE 78 (9):1464-1480. Maier, Ronald, and Ulrich Remus. 2002. Defining Process-oriented Knowledge Management Strategies. Knowledge and Process Management 9 (2):103-118. Marguardt, M. J. 1996. Building the Learning Organization: A Systems Approach to Quantum Improvement and Global Success: McGraw-Hill. Maurer, H., and K. Tochtermann. 2002. On a New Powerful Model for Knowledge Management and its Applications. Journal of Universal Computer Science 8 (1):85-96. Nielsen, Bo Bernhard, and Snejina Michailova. 2007. Knowledge Management Systems in Multinational Corporations: Typology and Transitional Dynamics. Long Range Planning 40 (3):314-340. Nonaka, I., and R. Toyama. 2005. The Theory of the Knowledge-creating Firm: Subjectivity, Objectivity and Synthesis. Industrial and Corporate Change 14 (3):419-436. Oja, Erkki. 1989. Neural networks, principal components, and subspaces. Int. Journal of Neural Systems 1:61-68. OPENTEXT. Livelink, Knowledge Management Software [cited 10/16/2008]. Available from http://www.opentext.com. Pearson, K. 1901. On Lines and Planes of Closest Fit to Systems of Points in Space. Philosophical Magazine 2 (6):559-572. Rollett, H. 2003. Knowledge Management: Processes and Technologies: Kluwer Academic Publishers. Ruggles, R. L. 1997. Knowledge Management Tools: Butterworth-Heinemann. Sanger, D. 1989. Contribution Analysis: a Technique for Assigning Responsibilities to Hidden Units in Connectionist Networks. Connection Science 1 (2):115-138. Seung, H. S., N. D. Socci, and D. Lee. 1998. The Rectified Gaussian Distribution. Advances in Neural Information Processing Systems 10:350-356. Shu-Mei, Tseng. 2008. The Effects of Information Technology on Knowledge Management Systems. Expert Systems with Applications: An International Journal 35 (1-2):150-160.
51
Sivan, Y.Y. 2000. Nine Keys to a Knowledge Infrastructure: A Proposed Analytic Framework for Organizational Knowledge Management. Paper read at Proceedings of WebNet 2000 - World Conference on the WWW and Internet. Soo, C. W., T. M. Devinney, and D. F. Midgley. 2007. External Knowledge Acquisition, Creativity and Learning in Organisational Problem Solving. International Journal of Technology Management 38 (1):137-159. Strohmaier, M. 2003. A Business Process Oriented Approach for the Identification and Support of Organizational Knowledge Processes. Proceedings of 4. Oldenburger Fachtagung Wissensmanagement, PotenzialeKonzepte-Werkzeuge. Taylor, H. 2007. Tacit Knowledge: Conceptualizations and Operationalizations. InternatIonal Journal of Knowledge Management 3 (3):60-73. Wang, Z. 2004. Knowledge Systems Engineering: A New Discipline of Knowledge Management and Enabling. International Journal of Knowledge and Systems Sciences 1 (1):9-16. Wei-Wen, Wu. 2008. Choosing Knowledge Management Strategies by Using a Combined ANP and DEMATEL Approach. Expert Syst. Appl. 35 (3):828-835. Weissor, Shiue, Li Sheng-Tun, and Chen Kuan-Ju. 2008. A Frame Knowledge System for Managing Financial Decision Knowledge. Expert Systems with Applications: An International Journal 35 (3):1068-1079. Wiig, K. M. 1994. Knowledge Management Foundations: Thinking about Thinking-how People and Organizations Represent, Create, and Use Knowledge: Schema Press, Limited. Woitsch, Robert, and Dimitris Karagiannis. 2002. Process-oriented knowledge management systems based on KMservices: the PROMOTE approach. International Journal of Intelligent Systems in Accounting, Finance & Management 11 (4):253-267. Wu, Liang-Chuan, Chorng-Shyong Ong, and Yao-Wen Hsu. 2008. Knowledge-based Organization Evaluation. Decision Support Systems 45 (3):541-549.