Fred Steward. (with Yang Wang & Joyce Tsoi) .... importance of Innovations identified in this way (Cohen and Levin, 1989). It should also be pointed out that the ...
Direct measurement of innovation output using documentary and digital sources Report for Measuring Eco Innovation Project Deliverable No.10 June 2008
Fred Steward (with Yang Wang & Joyce Tsoi) MEI is a project for DG Research of the European Commission about measuring eco-innovation. The project is done in collaboration with Eurostat, the European Environment Agency (EEA) and the Joint Research Center (JRC) of the European Commission. MEI offers a conceptual clarification of eco-innovation (developing a typology) and discusses possible indicators, leading to proposals for eco-innovation measurement. Project Title: Measuring eco-innovation Project acronym: MEI Proposal contract No: 044513 Instrument: STREP Project Call: Call FP6-2005-SSP-5A, Area B, 1.6, Task 1
1
1 Innovation output indicators 1.1 The concept of innovation output as an ‘event’ Most contemporary scholars agree with Schumpeter that innovation is only accomplished with the entry of a new product or process into commercial use. This distinguishes ‘innovation’, defined as novelty entering into practice, from the ‘invention’ phase of experimental research and development. Schumpeter’s original definition (which focused on technology and the market), is now often expanded to include the entry of organisational/service novelty into social practice. Schumpeter’s concept of innovation is that it is an ‘output’ of prior inventive activity defined by the ‘event’ of its initial entry into commercial use. This concept has profound consequences for the measurement of innovation. It suggests that the innovation indicator of choice would be based on a direct and systematic monitoring of such output events. This is quite different from the measurement of R&D (an ‘input’ indicator of knowledge activity) or the counting of patents (an ‘intermediate’ indicator of inventive activity). Yet, surprisingly, the use of output events as an innovation indicator is much less developed than the use of ‘upstream’ input or intermediary measures. There is considerable evidence that research and patent activity is a poor guide to actual innovation performance. First, only a small proportion of research or patenting leads to innovation and this varies considerably between different organisations and contexts. Second, much innovation arises from other sources than formal research or patentable invention, such as external users or non-R&D in-house functions. Both of these incongruities reinforce the importance of focusing on a direct measure of innovation output events. An important explanation for the inappropriate emphasis on input and intermediary indicators is the availability and ease of access to data. R&D expenditure is covered by accounting procedures. Patent data arise from legal processes. Both may be readily used to generate aggregate national and sectoral data, and, with more difficulty, to generate organisation specific data. Much of this information is available in the public domain. Data on innovation output events are not gathered so systematically nor are they so readily available. However, it is a mistake to conclude that they are not available at all. The vast majority of innovation output events are announced publicly in some form, and therefore leave visible communication traces which, with ingenuity and commitment, may be used for the construction of useful indicators. Other than availability, another explanation for the neglect of innovation output events is the issue of commensurability. It is argued that such events present a classic ‘apples and oranges (or pears)’ dilemma. While it is true that the raw data of innovation output events presents confusing qualitative diversity (in terms, for example, of novelty and functionality) this is not an intractable problem and can be resolved through an appropriate classification scheme. The use of ‘universal’ monetary or legal units in R&D and patent indicators is merely one particular expression of this. The fundamental commensurability problem exists just as much between a unit of research in pharmaceuticals and in road safety, between a patent in nanotechnology and one in clockwork as between an innovation output of a Personal Data Assistant and a new strain of rice. As with availability the challenge of
2
incommensurability is different to that for conventional input and intermediate indicators, but is not insurmountable. One of the merits of a robust innovation output indicator is that it becomes possible to assess the actual contribution of research expenditure or patenting activity to innovation performance. The use of input and intermediate indicators as proxies for innovation outputs makes such an undertaking impossible. It would also enable the more systematic exploration of other dimensions of the innovation process such as the role of users, open innovation processes and non R&D based knowledge inputs. Recognition of the shortcomings of input and intermediate indicators has led some researchers to focus on measuring innovation through downstream indicators of the possible consequences or outcomes of innovation. These include measures of productivity, turnover, profitability, and market share. A UK study in the early 1990s argued that quoted share price was the most effective proxy for innovation since it represented an easily visible investor assessment of corporate innovation performance. The same critique applies here as for upstream indicators. Without a robust indicator of innovation output events it is impossible to assess the contribution of innovation to these downstream outcomes compared with other economic, social or managerial factors.
1.2 Two traditional approaches Although attracting less attention than other indicators, innovation outputs have been employed in a number of research studies. A common solution to the problems of availability and commensurability is to narrow the focus to either a sector, or to the most prominent innovations 1.2.1 Sector based specificity An example of the sectoral focus is the use of ‘new chemical entities’ as a measure of innovation outputs in the pharmaceuticals industry. These have been derived from a number of sources and it is possible to measure innovation with some precision at a global level comparing performance of different companies and countries over time. As a method it often relies heavily on investigator capability in terms of knowledge of the sector, access to data and appreciation of the technical and functional dimensions of the innovations themselves. 1.2.2 Significance based selectivity Experts in each sector are asked to identify significant innovations within their field. In this way, both patented and non-patented innovations are covered. The main criticism along with this method is related to the heterogeneity of the economic importance of Innovations identified in this way (Cohen and Levin, 1989). It should also be pointed out that the method does not gather small innovations which could be of interest in certain studies, and that its application to studies carried out on a wide sectorial range requires a high cost (Kleinknecht, 1993).
3
A project at SPRU constructed a cross-sectoral database of innovation output indicators between 1945 and 1985 selected according to significance. About 4000 innovations were identified which were judged to be the most significant during this period. The method relied on the recruitment of a diverse cohort of experts who were then requested to propose their innovation candidates for inclusion. As with the sectoral approach it too relies on individual know-how to make it feasible 1.2.3 The quest for new output indicators For innovation output indicators to offer a credible alternative to popular input measures they need to aspire to a number of characteristics. Universal - cross sectoral with coverage of the full range of economy and society Inclusive - including radical & incremental innovation, and new products, processes, & practices Situated - capturing discrete, time-specific and organisation-specific events Commensurable – translating qualitative attributes such as novelty, source, functionality and sustainability into comprehensible and comparable indices. Approaches are reviewed which offer the potential of moving toward these ideals. Increasing attention has been given to the development of more direct output indicators of various kinds (Coombs et al, 1996). Approaches developed along these lines seek to address the difficulties, and limitations which arise both from the information used as a basis for developing this approach and from the method employed to obtain it (Flor and Oltra, 2004). Several indicators have been developed for reaching firms’ innovation output based on literature.
1.3 Output measures in innovation surveys 1.3.1
From Company Managers
This method gathers its information regarding technological innovation in products or processes directly from company managers, usually through a survey. It covers the innovative behaviour and activities of the firm as a whole and explores the factors influencing the innovative behaviour of the firm, the scope of various innovation activities and the effects of innovations (Flor and Oltra, 2004). Thus, first-hand information can be obtained in order to value the innovations directly. In addition to this feature, all the sorts of difficulties happen during survey research process will also take place in this method. 1.3.2
From Sales of New Products
This indicator is based on a firm’s assessment in a postal survey of new product introductions (Kleinknecht ea al, 2002). The outputs of innovative activities can vary
4
along a number of dimensions, such as product-process-service, firm size, technical complexity and performance (Calvert et al, 2002). Although it is not able to capture all of these dimensions of innovation, CIS has chosen 8 indicators of them, summarized in the following table (Table 1.1). The category of ‘new’ products can include not only products or systems that include new technologies, but also include innovations that consist of a creative application of already existing technology (Kleinknecht ea al, 2002). This measurement can directly indicate the extent of the success of innovation, by measuring innovative products that are introduced into the market. From this method, multivariate models are built to estimate the output resulted from R&D input. This can say something about the more or less efficient use of R&D inputs and about factors that influence that relationship. Another advantage is that, as far as large firms respond to innovation surveys at a more voluntary level, regional desegregation of output indicators can be done more easily than in the case of R&D figures (Kleinknecht ea al, 2002).
5
Measure
Abbreviation
Sales from new products
SNP
Sales of incrementally changed products Sales of radically changed products Export sales from new products Export sales from incrementally changed products
Method of Calculation Total sales * (1-percentage unchanged products)
ENP
Total sales * percentage of incrementally changed products Total sales * percentage of radically changed products Total exports * (1-percentage unchanged products)
ENPInc
Total exports * percentage of incrementally changed products
SNPInc SNPRad
Export sales from radically changed products
ENPRad
Sales from innovative products new to the firm
SNPFir
Sales from innovative products new to the industry
SNPInd
Total exports * percentage of radically changed products Total sales * (1- percentage unchanged products) * percentage of products new to the firm/group Total sales * (1- percentage unchanged products) * percentage of products new to the industry
Table 1-1 Innovation Output Measures Obtained from the CIS Results Source: Calvert et al (2002) 25
A number of weaknesses may be identified. Low response rates cause it difficult to produce figures that can be interpreted as national levels. According to study done by Kleinknecht ea al (2002), another weakness is that many firms can give only ‘rough estimates’ of the share in sales of innovative products as well as lack of systematic and accurate statistics. Moreover, figures on shares in sales of innovative products may be sensitive to the business cycle (which may be misleading in some circumstances), and inter-sectoral technology flows are hard to assess with this indicator (Kleinknecht ea al, 2002). The innovation survey method adopted, for example, in the European CIS does seek to gather information on actual innovation outputs through a questionnaire sent to firms. While this fills a welcome gap it suffers from two major shortcomings. It relies on indirect identification of innovation outputs through self reporting by firms. Reliability and judgement are dependent on the respondent. The survey results are anonymised and reported innovations lack precise detail as to their origin, nature and time of market entry, and limit the interpretations that can be drawn. They lack, therefore, some of the positive attributes of the direct measurement of innovation output events through sources external to the innovating organisation with publicly available, specific information on the source, attributes, and timing of innovation.
6
1.4 Using New Product Announcements This is a literature-based innovation output indicator (LBIO). LBIOs databases are built by sampling the ‘new product announcement’ sections of technical and trade journals. Technical journals are chosen which have editorially controlled sections where new products are reported (Coombs et al, 1996). This means that the details, though supplied by the companies, are not in the journals by virtue of being a paid advertisement, but by virtue of the decision of the journal editor to include them. This characteristic guarantees objectivity and equity of the selections. If a series of journals covering most industrial sectors are compiled over a long period of time, it is relatively easy, if time-consuming, to generate a substantial database of new or modified products introduced into a national market-place during a particular time period (Coombs et al, 1996). The strengths of LBIOs, as a method of innovation data collection, are outlined below: • •
• •
• • •
The announcement times are close to the data of commercialization. Thus the indicator is timely (Coombs et al, 1996); The data are relatively cheap to collect, even without any direct contact with the innovation firms, so students can do it and firms would not be bothered with time-consuming questionnaires, since they prefer to disclose their products to the public (Santarelli and Piergiovanni,1996); The collection of new product announcements from journals can cover various scales of companies, which avoids neglecting the innovations in small-size ones. Technical and trade journals report information also includes innovations in software and in the service sector, which being excluded from patent files have been traditionally ignored in analyses of innovation output (Santarelli and Piergiovanni,1996); If standard classification systems are used, the method would be possible to apply in different countries and even make comparisons over time; Inter-sectoral technology flows (from innovation ‘producers’ to innovation users) can be identified relatively easy (Kleinknecht ea al, 2002); Innovation performances of different sectors could be horizontally compared.
However, the use of LBIOs still have a series of shortcomings for wide application in monitoring innovations: • • •
Adequate journal selection is a necessary precondition in order to ensure measuring innovations in a comprehensive way; Though technical journals are plentiful, a tradition of carrying ‘new product announcements’ does not exist in public sector as it does in the private sector (Walker et al, 2002); In-house process innovations are rarely reflected in the technical and trade journals. Hence, direct innovation surveys and patent data are probably superior indicators for this type of process innovation (Coombs et al, 1996);
7
•
Although such literature-based innovations can be objectively counted, they can only be subjectively valued in importance (Albert, 1995). Problems still exist in the process of selecting relevant journals.
Nevertheless, in spite of these limits, (Albert (1995)), they are appropriate in the sense of being countable, and even valued given sufficient time and resources. Coombs et al (1996) also described the feasible prospects of this method for tracking: • • •
1.5
market growth, firm’s market shares, and product; the diffusion of innovative technologies across different product domains and industry sectors by combing qualitative technological data in the details of each product announcement identified in the database; firm growth rates through the public records of these data, and then linking them to time series data of product announcements.
Ecoinnovation output indicators
The overwhelming majority of research on innovation indicators has been concerned with the issues of innovation with respect to economic competitiveness rather than environmental sustainability. Even within those terms there are serious limitations to the utility of the indicators generally employed. A reliable innovation output indicator would, in itself, be of value to the development of useful eco-innovation indicators by providing a systematic record of ‘actually existing’ innovation in a specific form which would allow a further level of interpretive analysis of the environmental consequences of each specific innovation output event. A particular problem is that most methods focus exclusively on what could be termed ‘singular’ innovations of individual products, processes, or practices. There is increasing interest in ‘systemic innovation’ as the requirement in shifting from unsustainable sociotechnical regimes to more sustainable ones. It is difficult to envisage how one could ‘leapfrog’ the development of well-grounded singular innovation indicators in order to address the even bigger challenge of systemic innovation indicators. Any interpretation of ‘systemness’ also requires the specific detail required for a credible assessment of environmental impact. The literature based method for gathering innovation output indicators relies on: A collection of trade journals New product announcements section Identification of innovations Classification of innovations Assumes propensity of companies to announce their innovations Assisted by selection competence of editors Eco innovations are also amenable to monitoring in this way. The distinguishing requirement, of course, is some means of classifying and comparing innovation outputs according to their impact on environmental sustainability.
8
2 Literature based innovation output indicators – empirical experience During the 1980s and 1990s, innovation output indicators were developed which were based upon secondary document data sources (Walker et al, 2002). LBIOs originated under the effort of Edwards and Gordson (1984) in USA. Later they were improved by several European experts such as Kleinknecht et al (1993) for the Netherlands, Cogan (1993) for Ireland, Coombs et al (1996) for the United Kingdom, Santarelli and Piergiovanni (1996) for Italy, and Flor and Oltra (2004) for Spain. This section describes the methods and results of empirical studies using literature based indicators. It chooses four most recent cases experimented by four European countries: the Netherlands, UK, Italy, and Spain. After introducing their experiences one by one, it will give a comparison of them.
2.1 The Netherlands Through a brief review of the past studies on innovation measurement, by comparing different kinds of indicators, Kleinknecht and Reijnen (1993) decided to adopt a new output-side approach which consisted of counting innovations which were recorded as new products in trade journals in 1989 to assess innovative capability in the Netherlands. They considered that with an appropriate ‘output’ measure they could systematically investigate the impact of different factors such as firm size, market structure, regional production environment, inter-firm or firm-university networks, organizational forms, and government policy. Considering the reliance on trade journals, this study was built on two hypotheses: First, they assume that firms have a voluntary attitude to release their product innovations and make them public by having them reported in journals. However, firms would not treat their process innovations that for purely internal use under this way. So this method tends to ignore this set of innovations. Second, Kleinknecht and Reijnen (1993) have to trust that they have selected the relevant journals. Due to some skeptics may argue that the number of innovations found depends on the number of journals covered: “there will be more (less) messages as there are more (less) messengers”, to refute this argument, they presented that “ there are more (less) journals reporting about innovations as there is more (less) to be reported”. Nonetheless, the journals selection phase was so crucial that they paid utmost attention. 2.1.1 Method After a mass of search of journals in 1989 across various libraries and contact a number of institutions via telephone calls, they finally found and looked through 82 journals. Then according to the following criteria, 36 of the 82 journals were selected for use as for compiling database. “Did the edited part if the journal report on new products, preferably in a separate ‘new products’ column? Did the journal give useful information, in some detail, about the innovation? 9
Did the journal give at least the name and address of the innovator? “ (Kleinknecht and Reijnen, 1993) In order to cover almost overall aspects of innovations, they classified the innovations by different schemes (e.g. degree of complexity, type of innovation, properties, etc.) Degree of Complexity High complexity: the innovation is a system, consisting of a large range of parts or components, coming from different disciplines. Examples: an aircraft, an automobile or a weather satellite. Medium complexity: the innovation is a simple unit, consisting of a certain number of parts or components. Typical cases are various types of machines. Low complexity: the innovation is a simple unit, such as, for example, a bicycle pump. Type of Innovation Products: totally new or totally changed product (e.g. a mountain bike); modestly improved product (e.g. a more user-friendly laser printer); new or improved accessory of an existing product (e.g. a safer child seat on a bicycle); product differentiation (e.g. marmalade with a different taste); process innovation (example expected to be found very rarely). Services: totally new or radically altered service (e.g. electronic banking); modestly improved service (e.g. a more secure credit card); new or improved accessory of an existing service (e.g. hospital benefits liked to a life insurance); service differentiation (e.g. a different after sales service) Properties of Innovation It is more efficient, yielding saving on: labor, basic materials, storage room or stocks, time, transportation costs, capital costs. It has new functions. It has improved functions, Such information allowed them to give different weights against different innovations. In order to improve the reliability of the above classification schemes and figure out the ‘true’ innovator who developed the innovation, Kleinknecht and Reijnen (1993) together with four student assistants collected as much information about innovations as possible. Finally, they established a profile for each innovation including information as below: • • • • • • •
“The identity of the firm which brings the innovation on the Dutch market. The model name as well as a short description of the innovation. The degree of complexity of the innovation. The type of innovation. The properties of the innovation. The origin of the innovation. The main market of the innovation. “ 10
2.1.2 Results In total, they identified 6531 cases, of which 206 were double counted and were removed from the database. So 6325 cases were left, of which 3829 cases were developed abroad, 1242 were developed domestically, and 1254 were unclear from the journals. In their classification by type of innovation they established five categories (Appendix 2). Around one-third of the innovations are of ‘low complexity’, two-thirds are of ‘medium complexity’, as well as only 2.5% are considered as ‘high complexity’. To their surprise, only about 15% of the innovations are developed by firms with 500 or over 500 employees. However, nearly one quarter of all domestic innovations come from firms with less than 10 employees. This outcome implies that in the Netherlands SMEs generate a considerably higher number of innovations per unit of R&D investment. After finished this tentative project, Kleinknecht and Reijnen (1993) concluded the valuable experience, then walked forward for expanding the uses of this new outputside indicator. Their investigation makes a great contribution to the study on innovation measuring and gives great help to the latter researchers. They summarized the possible functions of the new database in 9 items: • • • • • • • • • •
A direct measure of product differentiation. A direct measure of the flow of foreign innovations. In-depth cases for further studies on issues such as on determinants of success and failure of innovation, on returns to innovation, etc. Analyze the regional dispersion of innovations Address classical industrial organization issues. Study the economic impact of innovation. Compare innovation trends by sectors or firm size classes across different countries. Assist systematic comparison of various types of innovation indictors by linking to other databases. Assess inter-sectoral technology flows.
2.2 UK Due to the drawbacks of input indicators, which did not show the economic or the qualitative significance of the innovation produced, Coombs ea al (1996) used this more direct innovation output measurement for assessing innovative activity in a national economy based on new product announcements in trade and technical journals. Although this literature-based innovation output indicator is not capable to test all aspects of innovation, or to absolutely substitute for other indicators, it has already been seen as a “potent assistant” (Coombs ea al,1996). 2.2.1 Method The key task of this UK case, developing a literature-based output indicator, was the appropriate selection of relevant journals. Broadly following the Keinknecht’s (1993)
11
hypotheses and approach mentioned above, a list of all 500 trade, engineering, technical, and commercial journals available in a major technical and business reference library (Manchester, the second biggest in the UK) was collected. Those journals not issued in the UK and the ones not having an editorial ‘new product’ section were discarded. Those that did have a ‘new product’ section, but without sufficient companies and products’ information were together discarded. It was then necessary to make choices between the several journals relating to each industrial sector, and to achieve a good coverage of all industrial sectors (Coombs ea al, 1996). Finally, the number of journals in the list was cut to 40 only. The basic information about an innovation was separated into two areas: identity of the firm that brought the innovation onto the UK market; and the product or model name and a short description of the innovation. Then following the method used by Keinknecht (1993)), classified innovations into five categories. Furthermore, this case subdivided the ‘new’ category into two subtypes as: • •
“a new or decisively changed product, with a completely new function or functions, a new or decisively changed product with a different technology, but with the product having the same functionality as before.”
After this, they simply classified the origin of the innovations into five types as: • • • •
“introduced by a domestic (UK) firm, introduced by a domestic firm in cooperation with a foreign (non-UK) firm, or joint venture, developed by a foreign firm and introduced by a domestic (UK) sales agent, introduced by an international or multinational firm.”
For sorting the innovations by industrial sectors, they chose the classification system of 1992 Standard Industrial Classification (SIC) as modified by the European NACE system. And the standard of firm size is due to the number of employees. Initially, they set up a target of building a database including around one thousand new product announcements. Trying to avoid occurring out-of-date address of company, they made the most use of most recent issues. When full information about the innovative company was not acquired from the journals, other sources would be brought, e.g. the KOMPASS computer database. Besides, the companies whose ownership and location could not be established were abandoned from the database due to the lack of resources and limited required. Thus the scale of the database reduced to 941 innovations, when it was conducted 6 months later. 2.2.2 Results The tables below demonstrate the distribution of innovations by different classification systems (Source: Coombs et al, 1996):
12
Table 2-1: UK case: Type of innovation
Type
New*
Number 19
Novel^
Improved
Accessory
Differentiation
Process
51
470
137
247
16
% 2.02 5.42 50 14.56 26.27 1.7 *'New' is a new or decisively changed innovation, with a completely new function. ^'Novel' is a new or decisively changed product with a different technology, but with the product performing the same function as previously. Table 2-2: UK case: Origin of innovation
Origin Domestic Joint venture Number* 426 17 Percent* 45.3% 1.9% Number^ 476 17 Percent^ 50.7% 1.9% * International = UK and non-UK. ^ Domestic includes UK-owned internationals.
Foreign 178 18.9% 178 18.9%
International 319 33.9% 269 28.6%
Table 2-3 UK case: Innovation by country
Country
%
France
2.2
Sweden
3.4
Switzerland
4.7
Netherlands
5.9
Japan
10.3
Germany
16.6
UK
15.9
USA
32.6
Other countries
8.4
13
Table 2-4 UK case: Innovation by industrial sectors
Industrial sector
No. of Innovations
1
Food and beverages
92
2
Textiles
2
3
Clothing and footwear
6
4
Wood processing
9
5
Paper products and publishing
4
6
Chemicals and chemical products
73
7
Plastics and rubber
15
8
Glass, brick and concrete products
14
9
Iron and metal products
31
10
Manufacture of machinery
186
11
Weapons
l
12
Domestic and office equipment
77
13
Electrical and lighting equipment
83
14
Electronic and communication equipment
41
15
Medical equipment
29
16
Testing equipment
44
17
Process control equipment
52
18
Computing activities
67
19
Optical instruments
9
20
Motor vehicles
12
21
Aerospace
3
22
Furniture
10
23
Games and miscellaneous
15
24
Recycling and waste management
6
25
Construction
2
26
Retail services
6
27
Miscellaneous services
3
28
Financiasl ervices
38
29
Business services
6
30
Community and social activities
5
14
Table 2-5 UK case: Breakdown of origin per innovation type as a percentage
Origin
New
Novel
Improved Accessory
Differentiation
Process
Domestic
26.32%
37.25%
36.16%
49.63%
59.32%
68.75%
Joint venture
5.26%
7.84%
1.03%
2.19%
1.21%
6.25%
Foreign
10.53%
13.72%
24.59%
18.99%
8.91%
12.50%
International 57.89%
41.18%
35.12%
29.20%
29.96%
12.50%
Total
100%
100%
100%
100%
100%
100%
Table 2-6 UK case: Breakdown of types of innovations and originating as a percentage
Origin
New
Novel
Improved
Accessory
Differentiation
Process
Total
Domestic
1.17%
4.46%
41.08%
15.45%
35.24%
2.58%
100%
Joint venture
5.88%
23.53%
29.41%
17.65%
17.65%
5.88%
100%
Foreign
1.12%
3.93%
66.85%
14.62%
12.36%
1.12%
100%
International 3.45%
6.58%
53.29%
12.54%
23.51%
0.63%
100%
By reviewing the results produced from this study using LBIO method and assessing the feasibility of this particular method of generating an innovation indicator, Coombs et al (1996) concluded the following. Combining sectoral and nationality distributions of the innovations, suggests that UK-based firms possess a relatively high proportion of innovations in the food, machinery, and financial sectors, but relatively low in the electrical and electronic sectors. International firms are competent in creating more radical innovations, which have much better performance than UK firms. This phenomenon is due to R&D expenditure and innovation capacity increasingly occupied by large international firms. firms of around 100 to 200 employees are better at developing radical innovations than expected. These features suggest that the usage of literature-based innovation output indicators can give a relatively valued performance, which shows some validity and reliability. Besides, it is able to identify the innovation drivers intra-sector. Once this method is improved further systematic and institutionalized, the relationship between the broad patterns and trends of the data and other economic factors can be examined.
15
2.3
Italy
In order to collect the data for analyzing the understanding of the technological structure and innovative capability of Italy, Santarelli and Piergiovanni (1996) raised this project. And in the light of the shortcomings of traditional indicators, the actual economic significance of new technology can be better understood by means of a direct measure of innovation output, they decided to choose LBIOs as the main instrument of this project. 2.3.1
Method
They created their database on product innovations introduced in Italian industry in 1989, and named it PRODIN89. This database contains all innovations reported in the complete 1989 volume of a sample consisted by 25 Italian technical and trade journals. The journals considered technical information ranged from 15 industrial sectors and were selected from a much larger number of similar Italian publications according to such criteria (Santarelli and Piergiovanni, 1996): • • • •
“the presence of a distinct ‘new products’ column or section; the provision of detailed technical information about each innovation presented; the specification of the name and address of the innovation firm; continuity of publication and the ready availability of the journal throughout the country upon payment of a subscription.”
• For the purpose of detecting differences in the innovations of various industries, Santarelli and Piergiovanni (1996) chose the same classification approach introduced by Keinknecht et al (1993). This approach is used to sort innovations according to their degree of complexity and type of novelty. The degree of complexity has three levels: high, medium, and low complexity . And the novelty were classified into five types. As Coombs et al (1996) did, they chose SIC as the sectoral clasification system. In addition, the data was reported on the spatial dimension of innovation output. Therefore, it is possible to compare the figures in data between countries. Finally, their database assisted comparison between the regional distribution of Italian innovations and that of R&D expenditures and patents. Such function can enhance the test on the reliability of this LBIO as a proxy for the innovative capability of Italian firms. 2.3.2 Results The outcome of Italy experience shows that among the 1602 innovations listed in PRODIN89, 1066 are new products brought to the Italian market by foreign firms, most of which are belonged to EC states or US. The left 536 innovations belonged to Italian firms were broken down according to the region of the innovating firms. As a result, only 13 out of 20 Italian regions shared at least one resident firm introducing new products in 1989. Then the Italian companies who invented these 536 innovations were invited to have interviews in order to obtain information about their size (in term of number of employees) in 1989. Unfortunately, due to firms’ reluctance to disclose information about their employees, the researchers only got 292 innovations’ information. From this limited message resource, it suggests that small-size firms (fewer than 200 employees) represent more innovative than they thought to be. But 16
still most of the innovative products were produced by large companies (more than 200 employees). Although the comparisons between shares of innovations and shares of employment have high reliability on detecting relation between market structure and innovation in each industry, the best way to measure innovative activity regarding the different size classes of firms is the innovation rate (Acs and Audretsch, 1993). Due to this reason, Santarelli and Piergiovanni (1996) divided the number of innovations by the number of employees (hundreds) in a company. The results afterwards show that the total innovation rates are higher for those industries such as metal products, wood & furniture, leather & footwear. Comparison of the large-firm and small-firm innovation rates for each of the industrial sectors analyzed in PRODIN89 reveals that small firms always have a higher innovation rate than that of large firms in almost all sectors, with the sole exception of motor vehicles. This finding suggests the strength of Italian small firms in innovation although some doubt still exists on the reliability of this indicator in capturing the innovative contribution from large firms. In summary, Santarelli and Piergiovanni’s (1996) work reveals that literature-based classifications of innovative activities enable adequate assessment of innovation trends at both the sectoral and the regional levels. And it has successfully achieved more veracious and comprehensive understanding of the features of Italian industrial innovation status. This promising measurement is quite possibly able to make benefit to various national statistical offices for assessing their countries’ innovative capability.
2.4 Spain Flor and Oltra (2004) developed their study for the purpose to analyze the applicability of different indicators when identifying innovative firms, with particular attention paid to those based on information gathered from secondary sources. LBIO is one of these indicators, which used new products announcements covering from 1994 to 1996 as the source of secondary information. Unlike Coombs et al (1996) and Santarelli and Piergiovanni’s experiments (1996), which investigated innovative activities of multi-sectors, in order to avoid intersectoral discrepancies, as a first approach to analyze Spanish innovative events, Flor and Oltra restricted their research area to only one sole sector—Spanish ceramic tile manufacturing industry, which can be considered as a supplier-dominated industry. In this sector, innovative activities are fairly publicized in a wide variety of publications, thus they preferred to choose LBIO as the chief instrument to assess innovative capability. 2.4.1 Method They collected journals upon the criteria set out by Santarelli and Piergiovanni (1996) in Italy case. For covering the largest centers related to the professional sectors where innovations were developed, they finally identified a total of 9 suitable journals. Following the guidelines issued by Kleinknecht et al (1993) and adopted the work of Coombs et al (1996), and Santarelli and Piergiovanni (1996) on the method of gathering information, a database was set up, which included the company name, the
17
product name, and the type and features of the product arising from the innovation. In addition, they also classified the innovations by their complexity and type of innovation. 2.4.2 results The results of the study show that, during the 1994-1996 period, 55 firms developed 206 innovations. And the range of innovations per firm is across from 1 to 25. 1994 Number of innovations Percentage of tatal innovations Number of firms
1995 43 20.90% 21
70 34.00% 29
1996 93 45.10% 42
Total 206 100.00% 55
Table 2-7: Spain case: Number of innovations detected by the LBIO method per year Source: Flor and Oltra (2004)
The distribution of new products according to degree of complexity reveals that, in most cases, innovations are arisen from the low complexity category, which is 63%. Around 36% of the innovations are of medium complexity and are chiefly composed of a combination of improvements in size and design. Only 1% of the innovations identified could be considered as highly complex. Regarding to the type of innovation, 77% of the total innovations are product variation, 22% can be determined as slightly improved products, as well as only 1% are considered to be totally new products. Although this study also uses other methods as data sources such as patent count, participation in R&D projects with universities and research centers, acceptance/ participation in public innovation support programs; LBIO indicator gives the biggest contribution to identify innovations. Their study has shown the applicability and suitability of adopting LBIOs to assess firms’ innovative capability in Spanish ceramic tile industry. Furthermore, LBIO enables innovations to be classified according to different schemes. Although the use of this indicator shows great potential, it can be found that certain characteristics of the industrial sector all the while are necessary and must be known for achieving a proper interpretation of innovations (Flor and Oltra, 2004).
2.5 Conclusions The empirical studies of these four countries, the Netherlands, UK, Italy, and Spain, all adopted the guidelines set out by Kleinknecht et al (1993) with the same criteria of classifications of complexity as well as type of innovation. However, the research area, study scope, and time period are not uniform:
Time period
Netherlands UK 1989 1993
Italy 1989
Spain 1994-1996
1602 25
206 9
Number of innovations 6325 Number of journals 36
941 40
Sectors
multi multi single
multi
Table 2-8 Comparison between countries
18
The following are the three key findings emerged from the review of studies: A reliable indicator It can be seen from the cases of the Netherlands, UK, Italy and Spain that normally the experts use this LBIO method to measure innovative capability of their home countries. They choose this indicator in place of the traditional ones such as R&D expenditure, patent; because it is an output innovation indicator, which can give a direct detection of innovative activity. The two hypotheses previously assumed guarantee that they gather data and found database under a relatively objective way, which fairly strengthens experiments’ reliability and credibility. And the journals collecting process that contains massive information of innovations can make an integrated description of the situation of new production market. All the four studies suggest that the method of monitoring new products announcements is applicable and suitable for measuring innovative capability by regional and sectoral schemes. Additionally, this method can in-depth reveal the contribution to innovation made by small size firms. It also shows great potential for creating innovation indicators of international comparability and relevance which could be implemented on an annual basis. An economical indicator The case studies above illustrate that LBIO is quite an economical indicator with reasonable performance on both of money and time saving for both of inquirers and respondents. Unlike traditional investigating methods, which usually need direct contacts with innovation inventors, LBIO is able to independently obtain information from easily and cheaply accessible trade journals without interrupting firms. So naturally it saves a lot of time and expense on transactions. In addition, these cases are all done by experts in college together with their students. This fact indicates that this kind of research does not require much high-tech service or help from some advanced research agents, only needs some manual work for database building. Moreover, it can be found that these cases were completed approximately a decade ago when Information Technology (IT) was faraway behind present, thus nearly all the data resources were document literature-based, which consumed researchers’ majority of time for reviewing, selecting and compiling. However, today is totally different, large numbers of digital databases have already been created by public or private organizations. Using these digital resources can dramatically shorten the time spent on data gathering and set apart abundant time for data researching and innovation assessing. A potential eco-innovation indicator After review of these cases, it can be concluded that among the 4 countries’ studies there is no suitable data for analyzing eco-innovation. The parameters chosen cannot expressly indicate products’ environmental performance. This is because their initial purposes are to identify a certain regional or a sectoral innovative captivity not particularly designed for measuring eco-innovation, thus the databases only sorts the innovations according to their complexity, novelty, regions and sectors without any environmental impact parameter, such as CO2 emission, energy efficiency or carbon footprint. But based on its obvious advantages, a direct indicator of the products which are close to commercialization (Tidd, 2006), the LBIO method has great
19
potential for becoming an eco-innovation indicator. Moreover, the data could be combined with other firm-level measures, such as R&D and patenting, which are preferable for capturing process innovations thereby making up the drawback of LBIO; thus expanding range of possible analyses of eco-innovation can be undertaken. So that, if a systematic standard and relative environmental parameters are introduced into it, LBIO approach would quite possible be well applied for ecoinnovation measuring. Overall these studies suggest that the method has resulted in some annual sets of national innovation indicators. It demonstrates the successful management of heterogeneity of innovation outputs It has never applied been applied substantively across nations and time. Classification of innovations has not included environmental impacts but could accommodate this within its overall approach.
3 Literature based ecoinnovation studies As we have seen, the more systematic exploration of literature based innovation output indicators has not addressed environmental sustainability directly. However there are studies that have explicitly sought to construct eco-innovation indicators using analogous methods. This section reviews two prominent studies using related but different methods which are the TEI (Technological Environmental Innovation) database (Huber 2004) and a new domestic products time series (Newell 1998).
3.1 The Technological Environmental Innovation Dataset Huber’s (2004) project was focused on technological environmental innovations, or TEI for short. TEIs are defined as more than end-of-pipe environmental technologies such as exhaust-air catalytic, or filters in chimneys, which represent a downstream approach that only starts up after damage or pollution has already happened. TEIs are upstream technologies which can prevent environmental deterioration from happening by controlling the manufacturing chain and monitoring the technology’s life cycle (Huber, 2004). In addition, “TEIs represent a new generation of innovative technologies that fulfill ecological criteria as much as technical criteria of efficiency, operational safety and reliability. And they have to match economic criteria such as price and profitability” (Huber, 2004). This database is based on the identification of a series of technological environmental innovations through a literature review (Huber, 2005). It includes 500 examples of new technologies along with positive environmental effects. The methods applied throughout this study are life cycle analysis and product chain analysis. 3.1.1 Method This project only considers technological environmental innovations. Thus, only the innovations that meet one or several aspects of the environmental innovation strategies as listed in Table 3-1 has the qualification to enter the database of TEI.
20
Figure 3-1 Selected concepts of technological environmental innovation according to the realm of innovation where they most apply Source: Huber (2005)
Another factor in judging whether a technological innovation qualifies as an environmental innovation is to determine whether an innovation contributes to significantly to increasing eco-efficiency and/or improving ecological or metabolic consistency, where metabolic consistency focuses on the structural, qualitative side of technology other than input-output-quantities within basically given structures (Huber, 2005). Following this framework an explorative databank has been generated which contains 500 examples of TEIs invented from 2001 to 2004. The information collected from the analysis of life cycle and product chain is used to edit the profile for each innovation, which includes its “structural impact, the life cycle stage of development and diffusion, on rival like technology, competitiveness and adoptability, ecological properties and environmental improvements which have been achieved and expected” (Huber, 2005). 3.1.2 Results In terms of integrated solutions versus end-of-pipe measures, 85% of TEIs are integrated solutions, while 15% are end-of-pipe measures. 27% of the datasets are regarding energy, which includes vehicle propulsion and energy design (Huber, 2004).
21
Figure 3-2 TEIs according to realm of innovation (n = 298) Source: Huber (2005)
Table 3-3 sorts TEIs according to chain position. As shown, primary productions and base products represent the biggest scale with 44%, materials processing and intermediate products occupies 27%. They two input parts makes up 71% of total TEIs. The output part, final productions and end product represent 24%, but innovative practices regarding consumption and user behaviour do not count much, only 4% at all.
Figure 3-3 TEIs (products, processes, practices) according to chain position Source: Huber (2005)
Ideas and early research do not contribute much, which individually makes 3% and 10% of TEIs. The biggest proportion comes from an output stage, market introduction, which is 35%.
22
Figure 3-4 TEIs according to stage of life cycle Source: Huber (2005)
Most TEIs bring change in metabolic consistency. The biggest share, 41% of TEIs, has both consistency improvement and efficiency increase. Only 23% of TEIs are significant efficiency increasing without a change in metabolic consistency.
Figure 3-5 TEIs according to ecological consistency and efficiency Source: Huber (2005)
3.1.3 Conclusion This TEI study shows how it is possible to compare innovations regarding their environmental impacts. It develops a number of parameters which may be used to classify eco-innovation indicators such as chain position, stage of life cycle, as well as ecological consistency and efficiency. A major weakness is that it does not consistently identify Schumpeterian innovation events but also includes upstream and downstream indicators. Only about a third of the innovations were captured at the point of market entry. Its identification of 500 innovations through a continuous survey of 9 technology journals between 2000 and 2003 is more like a conventional literature review rather than an event reports approach. It is very technology oriented in its view of innovation. Its selection of innovations for entry if they ‘improved on metabolic consistency or significantly increased eco-efficiency’ is an unusual and distinguishing feature.
23
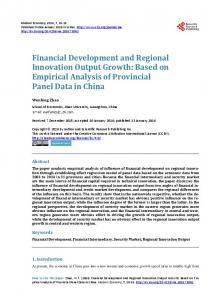
3.2 Product Catalogue Database Newell created a database of 735 room air conditioners, 275 central air conditioners and 415 gas water heaters reported in the annual Sears catalogue between 1958 and 1993. It includes data on year of market entry, price and environmental and energy performance. Newell et al (1999) developed a methodology for testing Hick’s induced innovation hypothesis empirically by estimating a product-characteristics model of energy-using consumer durables, augmenting the hypothesis to allow for the influence of government regulations. The “Induced innovation” hypothesis of Sir John Hicks (1932)is that “A change in the relative prices of the factors of production is itself a spur to invention, and to invention of a particular kind-directed to economizing the use of a factor which has become relatively expensive.” The study found evidence that both energy prices and government regulations have affected the energy efficiency of the models of room air conditioners, central air conditioners, and gas water heaters sold on the market over the last forty years (Newell et al, 1999). 3.2.1 Method Newell and colleagues (1999) adopted air conditioners and water heaters as their research subject. Using the Sears Catalog (Sears et al, 1958-1993) and other public available data sources, they compiled a database including information of 735 room air conditioner models offered for sale from 1958 to 1993; 275 central air conditioners models from 1967 to 1988; and 415 gas water heater models from 1962 to 1993. The catalog contains a comprehensive set of data about product characteristics such as energy flow, energy efficiency, and cooling capacity etc.; as well as transaction prices such as nominal price, product cost, relative price of electricity etc. 3.2.2 Results They used microeconomic instruments to analyze this mass of data, and then got the various relationships between different parameters as below:
Figure 3-6 Innovation in the Characteristics Transformation Surface.Source: Newell et al (1999)
This illustrates the period from the early 1970s to the early and it can be seen that the slope of the frontier has decreased, meaning that the elasticity of product cost with respect to energy flow is lower and energy efficiency is less expensive at the margin.
24
Figure 3-7 Changes in Energy Efficiency Source: Newell et al (1999)
Figure 3-8 Changes in Electricity and Natural Gas Prices Source: Newell et al (1999)
The rates of electricity and natural gas have frequent fluctuations over the past four decades with main trend of falling, but sharply raising in the mid-1970s and early1980s, quite because of the Arab oil embargo and other energy shocks in 1970s (Newell et al, 1999).
25
Figure 3-9 Innovation in Characteristics Transformation Surface: Room Air Conditioners Source: Newell et al (1999)
The heavy dot on each line is the mean of the characteristics of all models offered in that year. This figure shows that the mean model offered for sale became much cheaper and a little more energy efficient from 1960 to 1980, and then became much more energy efficient and a little cheaper from 1980 to 1990 (Newell et al, 1999). The study demonstrates that it is possible to derive a literature based innovation output indicator which includes systematic comparable data on the environmental performance of specific innovations. Although the data are not presented in innovation indicator form it is shown that changes in environmental performance eg energy efficiency of new products can be analysed over time.
3.3 Conclusions The 2 studies reviewed show that it is possible to incorporate environmental performance into a literature based innovation indicator. The TEI study relies on expert judgement as the basis for classification of specific innovations into useful ecoinnovation categories. The Newell study utilises published environmental performance data of specific new product introductions as the basis for comparative analysis of the ‘eco’ dimension of innovation.
4 Digital possibilities All of the studies reviewed have been based on a manual search of selected published documentary sources. They show that this method can be used to construct useful innovation output indicators and that such indicators can include measures of environmental impact of individual innovations which can be used for comparative analysis. Most of the studies reviewed are constrained by geographical location, time period, sector or significance. These constraints partly arise from the reliance on physical documentary sources and manual searching which result in a rather cumbersome and labour intensive process. 26
It is evident that since the emergence of the World Wide Web as an easily accessible information source in the early 1990 that the journals and catalogues used in these studies have become available in digital form with the prospect of more efficient searching. There has also been a widespread emergence of online databases which also contain reports of new commercial introductions of innovations and offer the prospects of gathering innovation output indicators in a new fashion. It now appears feasible to construct ecoinnovation indicators derived from digital sources from the year 2000 onwards and in some cases from earlier periods as well.
4.1 Two types of digital source A review of online digital source of data which could be used to capture innovation output events reveals two broad types of interest. 4.1.1 ’New announcement’ databases Analogous to the new product announcement section of trade journals are sectoral databases that capture reports of innovation output events such as new product announcements. They are usually only available on a commercial subscriber access basis but enable powerful searching capabilities. 4.1.2 ‘Product information’ databases Analogous to the product catalogue are online databases which provide information for consumers on the availability of new products. These are often focused on particular products and are usually available on a public open access basis. Feasibility studies were undertaken to explore the potential utility of these digital sources for constructing ecoinnovation indicators
4.2 New announcement databases Most sectors have commercial maintained technical information services which include databases which will track new product announcements, often globally. They are searchable online and text may be searchable for environmental impacts. Investigator capabilities still remain important for effective use of these sources 4.2.1 PIRAbase An example is the PIRAbase which tracks such announcements in the paper industry sector. An assessment was undertaken of the identification of new and emerging nanotechnology innovations for environmental sustainability within a specific sector. This sustainable technology study is concerned with nanotechnology applications to a specific technological area- “print-on-paper”. Its deinkability function for enhanced fibre recycling in the paper recovery stage is examined through this innovative approach. It is often stressed that new and emerging generic technologies offer great potential for major gains in eco-efficiency and dematerialization. Assessing emerging innovations which consists of any changes in end uses of materials and commitments to recycling, offer cleaner and more efficient processes can certainly help in identifying types of eco innovations developed over time.
27
Data were collected and analysed using the Pirabase industry database. This searchable database contains abstracts extracted from over 1000 regular trade and technical journals, market reports, conference proceedings, magazines, press releases, newspapers, newsletters and websites in 18 languages including major European and Asian languages. It covers material from 1975 onwards. The database is made of four subject files: Paperbase; Packaging; Printing and Publishing and Imaging. The summarised abstracts contain global business and technical developments across three stages in the print-on-paper supply chain. From the abstract, the source article can also be tracked down to gain more detailed information if necessary. This webbased archive database contains over half a million articles. This tool contain search engine which enables researchers to perform basic and advanced search specified on year; individual subject matter; patent paper; language; geographical location; document type and publication year. No of results obtained from the following search titles are listed below: Search and identify by a mix variety of keywords: Keywords No of records found Nanotechnology and paper 416 Nanotechnology and deinking 9 Nanotechnology and paper fibre strength 30 Nanotechnology and E-ink 9 Paper recycling 16706 Deinking and graphic paper 181 Deinking and printed paper and inkjet 13 Deinking and inkjet printing and laser printing 4 The abstracts are then extracted manually if they contain a new product/ process innovation that contain ecological criteria, contribute to reduction of environmental impact (e.g. reduce material consumption, offer more efficient process flow). A sample of the record is shown below:
Through documentary abstract review, they are then initially categorised into 7 broad process and product innovations characteristics for recovered paper:
28
Paper making Ink and coating formulations Printing/ inkjet General paper recycling process and recovery Deinking process Recycled fibre quality Paper like display applications/ Electronic paper Useful abstract titles can be marked, downloaded and stored in a list. From this search a list of innovation output events were identified which included name of innovation, date of introduction, name and country of innovating organisation, technical characteristics of innovation Figure 4-1 Results of the nanoparticle/ deinking technology innovations from the Pirabase Paper Industry Database Name of Innovation AERODISP
Company/ Organisation Degussa AG
Germany
Date intro 2005
Silica nanoparticle technology Silica nanoparticle technology Silica nanoparticle technology Silica nanoparticle technology Silica nanoparticle technology
StoraEnso
Finland
2005
The Institute for Surface Chemistry Frantschach Steti
Sweden
2005
Silicate nanoparticle coating
Czech Republic
2004
Silica particles on paper
Innova International (consultancy) Georgia Institute of Technology, Institute of Paper Science and Technology Innova International (consultancy) Finnish Paper Engineers Association
UK
2004
US
2004
Nanoparticle combined with strong northern virgin kraft with anionic trash collectors (ATC) Silica nanoparticles and coating
UK
2003
Finland
2004
Imerys
UK
2004 2005
Metso Paper
Finland
2005
Iford Photo/ Harman
UK
2005
Silica nanoparticle technology New modified calcium carbonate with new nano pigments “eggs” and “roses” Latex nanostructure Dry nanocoating Nanocoating
Country
Description of technology Pyrogenic nanostructured silica in surface waterfast coatings Multilayer coating with nanopigments
Silica nanoparticle technology with anionic trash collectors (ATC) Nanoscale feature surface creates 2 discrete pore network
Nanoclay particle coating New coating pigments for multilayer coating nanocoating A self sealing nanocoating of colorant and a nanoporous layer
29
Nanoparticles Dyes UV curable inkjet inks
Technology Oxonica
UK
2005
• Nanoparticles dyes
Buhler
Germany
2005
• Nano-sized pigment particles
This pilot study shows that it is possible to capture emergent nanotechnology innovations associated with sustainability claims. In the same way, similar methodology can be applied to other sector in carrying out prospective analysis of the emergence of new technology that have great sustainability potential. The costs of such a method include subscription cost access of about £2000 per annum plus research time cost. With a reasonably structured search routine it is possible to compile innovation output datasets for a variety of sectors. 4.2.2 Gale group new product announcements/ Plus, A search for mutisectoral databases showed that the Gale group new product announcements/ Plus (http://library.dialog.com/bluesheets/htmlaa/bl0621.html#DF) was the source with broadest coverage. It represents a global new announcement databases giving broad social and economic coverage which also offers the opportunity of extracting singular innovation reports. Gale Group New Product Announcements/Plus (NPA/PLUS) contains the full text of press releases from all industries covering announcements related to products, with a focus on new products and services. In addition to product descriptions, press releases generally contain key details about new products and technologies, including technical specifications, availability, uses, licensing agreements, distribution channels, and prices. Company contacts and phone numbers are provided to allow follow-up by interested parties. The press releases contained in the NPA/PLUS database are obtained directly from the product manufacturer, distributor, or an authorized marketing representative. The NPA/PLUS database provides information on the introduction of new products and services in all areas, including: Agriculture, Forestry, Fisheries Apparel and Related Products Chemicals and Allied Products Communications Electric/Electronic Machinery Equipment Financial Services Food and Kindred Products Furniture Instruments and Related Products Leather and Products Medical and Health Services Metals and Fabricated Metal Products Mining and Extractive Industries Ordnance Other Kinds of Manufacturing Paper and Allied Products
30
Petroleum and Energy Products Printing and Publishing Rubber and Allied Products Sciences Service Industries Stone, Clay, and Glass Products Textile Mill Products Tobacco Products Transportation Transport Equipment Wood and Wood Products This offers a digital alternative to the selected set of trade journals used in most of the LBIO studies. Again it involves access costs and researcher time in order to extract useful indicators
4.3 Product Information Databases There is a growing availability of publicly available information databases to guide consumers in making choices regarding product purchase. This is an online analogy to the product catalogue type of literature database . One particular subset of these which is of particular interest for ecoinnovation indicators is designed to enable consumers to exercise choice on the environmental impact of their selected products. Although many databases are available in various forms through web access to the product catalogue type of literature database, many of them are rather too partial or selective in coverage of information. Only the ones offering comprehensive consistent data on some environmental performance parameters have the chance to be applied in measuring eco-innovations. Though often rather partial and selective, some offer comprehensive product coverage with consistent data on some environmental performance parameters. Some of these arise from new legislative requirements to provide environment relevant information to consumers. For example, Directive 1999/94/EC requires availability of consumer information on fuel economy and CO2 emissions in respect of the marketing of new passenger cars. A publicly accessible web based UK database (May 2007) has 2871 models with details on company, technical characteristics and environmental impacts. A feasibility study was undertaken to assess the viability of using public available products information database to identify eco-innovation. 4.3.1 Passenger Car Database On 13 December 1999, Directive 1999/94/EC of the European Parliament and of the Council was adopted. This Directive relates to the availability of consumer information on fuel economy and CO2 emissions in respect of the marketing of new passenger cars. The purpose is to ensure that information relating to the fuel economy and CO2 emissions of new passenger cars offered for sale or lease in the Community is made available for consumers in order to enable consumers to make an informed choice (Gärtner, 2005).
31
A study on surveying the implementation of this Directive within the Member States had been done in 2005. This study argues that in order to found a harmonized EU passenger cars market, a centrally hosted database and website that covers the whole European passenger car market would certainly be the most efficient and effective (Gärtner, 2005). But due to the differences that currently still exist among different nations’ car markets (e.g. different car taxation systems, different consumer preferences); this functional database has not been set up yet. Nonetheless, there are still some public passenger car databases regarding sole country providing information on CO2 emission and fuel economy can be found via internet, most of which are created by government, manufacturers and dealers. Although the European passenger car database has not been built up yet, certain European state has already compiled its own car database responding to Directive 1999/94/EC. UK gives a good example that provides comprehensive new cars’ information on the UK market during last three years, which can be accessed online. This is an official database that created by UK government, hence its content is fairly objective and genuine with high reliability and credibility. This facture makes it very suited to be adopted as a data source for measuring innovation. And the parameters it contains further prove its feasibility of becoming an eco-indicator. For example, the 2007 database, it includes detailed descriptions of 2870 car models from 47 brands covering a wide range of information, i.e. a car’s manufacturer, model, description, transmission, engine capacity, fuel type, fuel consumption, noise level, emissions of CO2, HC, NOx, HC+NOx, and particulates. Besides official databases, a lot of manufactures as well as some dealers also have developed a great number of similar databases, which are intent to provide new products information for attracting consumers for purchasing. Due to the customers’ increasingly environmental consciousness, some agents decide to introduce some green parameters of new cars other than the traditional description, which would be useful for measuring eco-innovations. However, because of the self-evidently commercial intention, this series of databases are not as reliable as official ones, thus they only can be dealt as a secondary reference. Below are two relatively good examples: Yahoo Cars—Green Car Centre With increasing focus on the environment and the impact that cars have on it, Yahoo thought it worth having a microsite dedicated to all green parameters in the car world, and then Green Car Centre database was established. There are profiles of 2,668 new cars in the centre, which cover 19 manufacturers. This Green Car Centre contains volumes of information regarding cars environmental impact, such as regular updated news, reviews of so-called green cars, up-to-date green technologies, as well as ratings and a comprehensive photo gallery of green cars. The most attractive point is its powerful search engine. Unlike other ordinary car search engines that only can browse cars by maker, model and price; this database offers additional searching services i.e. by fuel type, CO2 emission and fuel economy. Carpages—the Green Car Guide The Green Car Guide is particularly designed for the car consumers that interest in cars’ environmental performance. Its database has been carefully compiled by the
32
motoring research team, which includes the new car prices and emission ratings of all of the UK's major new cars from 53 manufacturers, covering 4605 units of 327 different car models. From its statistic, the average CO2 emission rating is 190 g/km, the lowest being 99 g/km and the highest 425 g/km. Apart from the green parameters, this database also includes other vital car stats such as the car’s overall dimensions, price and fuel consumption. This database classifies cars into 7 categories: hatchbacks, saloons, estates, SUVs, MPVs, couples, and convertibles. In each category, cars are sorted into 7 levels with labels of different color according to their CO2 emission rating:
After employing the source of data, next step will be how to deal with this data in order to turn it into eco-indicator. Based on the experience learned from empirical studies in Chapter 5, the author decides to do it in following way: First step is to identify the eco-innovations according to certain criteria and then build profile of each eco-innovation. This profile should contain information that covers name of innovator, national location of innovation, introducing date, novelty of innovation, type of innovation, and degree of complexity of the innovation. Some information such as the name of innovator can be identified straightly from the database. Some such as the national location of innovation and introducing date can be gained from other sources like manufacturer’s database. And others require reasonable judgment of investigators. After compiling profile for each car, the next step is to classify all the innovations according to different criteria i.e. national location, novelty, and complexity. Then using spreadsheet to illustrate the distribution according to each criterion, finally the innovative capacity of passenger cars on UK market would be unfolded. The databases above provide vast quantity of information regarding cars’ environmental captivity, which can guide customers in making choice on the environmental impact of their selected products. This is the designers’ initial purpose; however the data they compiled is possible to be applied in some other ways such as being turned into an eco-innovation indicator. Below are some experimental studies based on the LBIO cases, which can give methods to deal with these data sources: There are many definitions of a green car – from electric cars to hybrid cars, to conventional vehicles, whichever, it has the common character that it has low CO2 emissions to increase air quality and low fuel consumption to save energy (Contract Hire and Leasing). So that the distribution according to their manufacturers can reveal the distribution of these innovations according to their national locations. The first step is to figure out the nationalities of different car brands. In order to make this experiment representative and comparable, the author sorts all the brands into four main regions
33
USA Chevrolet Ford
Europe Audi BMW Citroen Fiat Mercedes-Benz Peugeot Renault
Seat Skoda Smart Vauxhall Volkswagen Volvo
Japan Dalhatsu Honda Mazda MITSUBISHI Nissan Suzuki Toyota
Korea Kia Hyundai
Figure 4-2 Regional distribution of brands
The experimental studies adopted the area of passenger car as the research objective to test the feasibility of using product information databases to create eco-innovation indicators. Obviously, the result is kind of positive. But this experiment is just the initial step, which is only able to prove this method is doable, however, in order to implement it indeed, a long way need to go, and a lot of difficulties need to conquer. First, this sort of database can give a direct measure of product differentiation on environmental performance which has often been neglected in traditional car database. Second, with the use of time series of databases, analysts can get a direct measure of the flow of foreign cars into UK market. From this research, it is possible to examine which manufacturer is the leader and which one is a relative laggard in innovating. Third, the database allows analysts to investigate the relationship between innovative capacity and firm size. Forth, since all the European states have to comply this Directive 1999/94/EC, the situations of their car markets could be quite similar; thus without exacted investigation of each database, only using UK results can briefly assess the whole European market situation. Fifth, if combined with other country’s data such as US or Japan, the innovation trends and economic impact of various countries are able to be compared. Sixth, the data can be used for assessing intersectoral innovation diffusion. Finally, this database is possible to be linked with other existing databases which cover different indicators, i.e R&D or patents. This can help analysts evaluate reliabilities of different types of innovation indicators, and also increase the statistics reliability. First, the official database does not provide the information of a car’s date of change, which results it is hard to trace the improvement of a certain car model. Second, this database does not indicate where the car is manufactured, which brings analysts difficulties to seek the innovation location. Third, this UK database only can represent the European situation, for making an international comparison still needs assistant material from other countries. That experiment studies only investigate 2 parameters regarding to environmental performance, CO2 emissions and Fuel Economy, this is far not enough to solidly investigate eco innovations. For the sake of comprehensive investigation, some other indicators should be examined such as Engine Capacity, Fuel Type, Noise Level, CO emissions, HC emissions, NOx emissions, and Particulates emissions, etc. However, these kinds of data are rarely mentioned in product databases, even if provided they are usually not located significantly; in other words people should take additional time and energy to pursuit them. Moreover, since cars are described with more than one parameters, the significances of different parameters could not be the same. Therefore, a weighting mechanism
34
should be introduced to determine the relevant effects caused by a product and the extent of the effect in relevant scope. In addition, a comprehensive output innovator should possess the ability to compare innovative capability by regional and sectoral scopes, as well as time series. Thus, information of a new product’s brand owner, manufacturer, manufacturer location, introducing date; is very required. Using new car registration data it is possible to show how innovation is affecting the environmental performance of new car introductions into different national markets
Figure 4-3 Use of consumer information data as ecoinnovation indicator (Source Gartner 2005)
Using a simple measure of CO2 emissions or fuel economy with additional information on source and date of innovation it is possible to show the contribution of different national industries to new models with different environmental impacts. Of course this simple overall measure does not capture the relative improvement within different classes of vehicle
Figure 4-4 Source of products below 140g CO2 per km
35
Figure 4-5 Source of cars with fuel consumption greater than 46 mpg
4.3.2 Other consumer product information databases On 22 September 1992, the Council Directive 92/75/EEC on the indication by labelling and standard product information of the consumption of energy and other resources by household appliances was adopted by the Council of the European Communities. Bases on this Directive the Member States are obliged to adopt standardised consumption labelling as national law. According to Article 1 paragraph 1, the Directive applies to the following types of household appliance: • Refrigerators, freezers and their combinations • Washing machines, tumble driers and their combinations • Dishwashers • Ovens • Water heaters and hot-water storage appliances • Lighting sources • Air-conditioning appliances. Based on the Council Directive 92/75/EEC, the European Commission defined details of the relevant type of appliance and the obligation to implement the corresponding directives. As yet, directives were adopted for the following electrical household appliances: household electric refrigerators and freezers and their combinations (Directive 94/2/EC with amendment 2003/66/EC), household washing machines (Directive 95/12/EC), household electric tumble driers (Directive 95/13/EC), household combined washer-driers (Directive 96/60/EC), household dishwashers (Directive 97/17/EC and amendment 99/9/EC), household lamps (Directive 98/11/EC), household air-conditioner (Directive 2002/31/EC) and household electric ovens (Directive 2002/40/EC). A further directive on labelling hot water heaters is planned.
As with passenger vehicles a consequence of this legislation is that data on the environmental performance of new products is now systematically gathered. 36
Through analysis of market introduction it is possible to compare change over time and between countries.
Figure 4-6 Change over time in energy efficiency of appliances Source Gartner 2005
37
Figure 4-7 Comparison of energy efficiency of household appliances between countries Source Gratner 2005
Access to these databases with some systematic analysis of source and time to market of innovation could lead to a useful ecoinnovation indicator
38
5 Conclusions The review of empirical studies of literature based innovation output indicators demonstrates that it is feasible to capture innovation output events through the systematic selection of reports of such events which are recorded in documentary sources such as trade journals or product catalogues. With appropriate methods it is possible to categorise these innovation events according to attributes such as organisation size and location, novelty and functionality of innovation, time of market entry etc. This enables comparative analysis of patterns of innovation according to time, place, organisation, sector, and technology. In short it leads to an appropriate and useful innovation indicator. The two studies on literature based ecoinnovation output indicators show that it is also feasible to categorise innovations according to a systematic and consistent measure of environmental performance. This may take the form either of expert judgements on types of ecoinnovation or of technical measures of environmental performance. This enables comparative and temporal analysis of patterns of ecoinnovation. Although these studies demonstrate the feasibility of documentary based ecoinnovation output indicators it remains the case that they have not, so far, been developed with broad coverage of countries, time periods and sectors. These are important and desirable characteristics of ecoinnovation indicators. A review of online digital sources shows a range of newly available information sources that also record innovation output events analogously to those shown in conventional documentary sources. These digital sources often have greater coverage and more powerful searchability than conventional documentary sources. Some of these sources also include consistent data on the environmental performance of specific innovations. It is suggested that ecoinnovation indicators from the year 2000 onwards could best be constructed by exploiting the potential of online digital sources. The advantage of event based ecoinnovation output indicators is that they combine rich qualitative data on the nature of specific innovations categorised in a manner that enables effective quantitative analysis. The main drawback of these indicators is that there is no obvious universal source of such information. It needs to be aggregated from diverse sources and interpreted with some expertise. It is proposed that the most practical route to carry this method forward is to use a selection of online digital sources to construct a ‘basket’ of ecoinnovation indicators with sufficient diversity to give a guide to broad patterns and trends while not claiming universal coverage. Such a basket of ecoinnovation indicators would be selected along a number of criteria. Any indicator should only be included if it offers wide international (preferably global) coverage and is available on an ongoing basis from the year 2000 onwards. Indicators need to be drawn from a range of sectors and technologies which represent significant arenas of economic and innovative activity. Most importantly from the viewpoint of ecoinnovation the basket of indicators must explicitly cover a spectrum from incremental ecoefficiency improvements within the current prevailing sociotechnical regimes through to radical transformative innovations with the potential to enable transitions to new sociotechnical regimes.
39
Different tracking methods are needed for measuring incremental and radical ecoinnovation output. It is proposed that measurement could best be achieved as follows: Incremental eco-innovation indicators - These should be based on the digital ‘product information’ sources. In particular they can exploit the databases on the environmental performance of new consumer products such as cars and domestic products arising from European Union legislation on consumer information labelling. These could quite speedily be turned into an ecoinnovation indicator enabling analysis over time and between countries and businesses Radical eco-innovation indicators – These should be based on the digital ‘new announcement’ databases. A selection of these should be made which offer the greatest potential to capture innovations with the real potential to enable sustainable system innovation. These could include low carbon technologies and other sustainability oriented innovation paths, perhaps including those in the generic areas of information technology, biotechnology and nanotechnology. The identification of an appropriate range of such areas of innovation could then be translated into an ecoinnovation indicator through systematic search and categorisation from suitable online digital sources. In conclusion, therefore, it is argued that drawing upon existing experience with innovation output event indicators along with new digital information sources it is feasible to construct a basket of ecoinnovation indicators from the year 2000. Digital new announcement and consumer information databases are a neglected source of innovation output indicators. Most indicator research uses input or intermediate output indicators such as R&D and patents. Some systematic and selective exploitation of these could be of value for international comparative monitoring of ecoinnovation at European and global levels
40
6 References Acs, ZJ. and D.B. Audretsch. (1993) Analysing innovation output indicators: The US experience, in A. Kleinknecht and D. Bain (Editors), New Concepts in Innovation Output Measurement (Macmillan, London), 10-41. Albert, N. L. (1995) The use of literature-based innovation output indicators for research evaluation. Small Business Economic 7: 451-455 Ashford, N. A. (2000) ‘An Innovation-based Strategy for a Sustainable Environment’, in Hemmelskamp, J., Rennings, K. and Leone, F. (eds), Innovation-Oriented Environmental Regulation: Theoretical Approach and Empirical Analysis, ZEW Economics Studies, Heidelberg, New York: Springer Verlag, pp 67-107. Calvert, J., Ibarra, C., Patel, P. and Pavitt, K. (2002) Innovation Outputs in European Industry: Results from the CIS: Summary. [Online] Available from http://cordis.europa.eu/eims/src/eims-r34.htm [Accessed 8th June 2007]. Carpages—the Green Car Guide.[Online] Available from http://www.carpages.co.uk/co2/. [Accessed 8th Aug 2007]. Chen, F. (2005) Gaining Competitive Advantages in the Chinese Mobile Phone Market by Employing Sustainable Consumption and Production Pattern: A Case Study of TCL Telecommunication Co., Ltd. Imperial College Thesis. Cogan, D. J. (1993) The Irish experience with literature-base innovation output indicators.in: A. Kleinknecht and D. Bain (eds), New Concepts in Innovation Output Measurement. Macmillan: London/St. Martin’s Press: New York. Cohen, W. M., Levin, R. C. (1989) Empirical studies of innovation and market structure. Contract Hire and Leasing. [Online] Available from http://www.contracthireandleasing.com/Green-Car-Leasing.asp#available. [Accessed 8th Aug 2007]. Coombs, R., Narandren, P. and Richards, A. (1996) A literature-based innovation output indicator. Research Policy, 25, 403-413. Edwards, K. L. and Gordon, T. J. (1984) Characterisation of Innovations Introduced on the US Market in 1982. Report to the US Small Business Administration by the Futures Group: Glastonbury. EEA. (2005) Eco-innovation indicators. [Online] Available from http://technologies.ewindows.eu.org/resources/case_studies/conferences/innov ation_indicator_29_09_05/ei_study.pdf. [Accessed 9th June 2007] EEA. (2006) Eco-innovation indicators. Eurostat/ OECD. (1999) The Environmental Goods & Services Industry: manual for data collection and analysis. Flor, M. L. and Oltra, M. J. (2004) Identification of innovating firms through technological innovation indicators: an application to the Spanish ceramic tile industry. Research Policy, 33, 323-336 Fussler, C. and James, P. (1996) Driving eco-innovation: A breakthrough discipline for innovation and sustainability. Pitman Publishing: London, 364p. Gärtner, A. (2005) Study on the effectiveness of Directive 1999/94/EC relating to the availability of consumer information on fuel economy and CO2 emissions in respect of the marketing of new passenger cars. Green Car Congress. (2004). [Online] Available from http://www.greencarcongress.com/2004/11/average_fuel_co.html [Accessed 8th Aug 2007].
41
Green Car Congress. (2005) [Online] Available fromhttp://www.greencarcongress.com/2005/06/co2_emissions_f.html. [Accessed 8th Aug 2007]. Green,k., Groenewegen, P. and Hofman, P.S. (2001) Ahead of the Curve. Kluwer Academic Publishers, London. p 6 Hicks, J.R. (1932) The Theory of Wages. London: Macmillan. Hitchens et al. (2003) Small and Medium Sized Companies in Europe. Environmental Performance, Competitiveness and Management: International EU Case Studies, Springer. Hofstrand, D. and Holz-Clause, M. (2006) What is a Feasibility Study?.[Online] Available from http://www.extension.iastate.edu/AGDM/wholefarm/html/c565.html [Accessed 8th Aug 2007]. Huber, J. (2004) New Technologies and Environmental Innovation. MPG Books Ltd, Bodmin, Cornwall. Huber, J. (2005) Technological Environmental Innovations. Jago et al. (2003). ECOLABELLING FOR TEXTILES - THE BENEFITS AND OPPORTUNITIES. [Online] Available from http://www.eeaa.gov.eg/English/Main/Env2003/Day2/Modernization/timothy.sea m.pdf. [Accessed 18th Aug 2007]. Kemp, R. and Andersen, M. M. (2004) “Strategies for eco-efficiency innovation”, Strategy paper for the Informal Environmental Council Meeting, July 16-18 2004 Maastricht, VROM, Den Haag. Kemp, R. (2006) Module on “Environment and Sustainable Development. [Online] Available from http://www.merit.unu.edu/phd/phdII/general/Syllabus%20Environment%20and% 20Sustainable%20Development.pdf [Accessed 4th Aug 2007]. Kemp, R. and Foxon, T. (2007) Eco-innovation from an innovation dynamics perspective. [Online] Available from http://www.merit.unu.edu/MEI/papers/Ecoinnovation%20from%20an%20innova tion%20dynamics%20perspective%20version%20of%20april%2013%202007.d oc [Accessed 1th Aug 2007]. Kleinknecht, A. (1993) Why do we need new innovation output indicators? In: Kleinknecht, A., Bain, D. (Eds.), New Concepts in Innovation Output Measurement. St. Martin’s Press, New York, pp. 1–9. Kleinknecht, A., Reijnen, J. O. N and Smits, W. (1993) Collecting literature-based innovation output indicators: the experience in the Netherlands. In: A. Kleinknecht and D. Bain (eds), New Concepts in Innovation Output Measurement. Macmillan: London/St. Martin’sPress: New York, pp. 43–84. Kleinknecht, A. (1993) Discussions and Conclusions, in A. Kleinknecht and D. Bain (Editors), New Concepts in Innovation Output Measurement(Macmillan, London), 189-200. Kleinknecht, A., Montfort, K. V. and Brouwer, E. (2002) The non-trivial choice between innovation indicators. Newell, R. G., Jaffe, A. B. and Stavins, R. N. (1999) The Induced Innovation Hypothesis and Energy-saving Technological Change, the Quarterly Journal of Economics, 114: 941-975. Nuij, R. (2001) Eco-innovation: Helped or hindered by Integrated Product Policy. Sustainable Product Design 1: 49-51. OECD. (1997) OECD Proposed Guidelines for Collecting and Interpreting Technological Innovation Data- Oslo-Manual. OECD/ Eurostat, Paris.
42
Santarelli, E. and Piergiovanni, R. (1996) Analyzing literature-based innovation output indicators: the Italian experience. Research Policy, 25, 689–711. Saunders, M., Lewis, P. and Thornhill, A. (2003) Research Methods for Business Students. Essex: Pearson Education Limited. Sears, R. and Co., (1958-1993) Spring/ Summer Catalog. Chicago, IL Tidd, J. (2006) From Knowledge Management to Strategic Competence: Measuring Technological, Market and Organisational Innovation. Imperial College Press. Walker, R. M., Jeanes, E. and Rowlands, R. (2002) Measuring innovation-applying the literature-based innovation output indicator to public services. Wikipedia. [Online] Available from http://en.wikipedia.org/wiki/Wikipedia [Accessed 4th Aug 2007]. World Business Council for Sustainable Development. (2000) Eco-efficiency-creating more value with less impact. Yahoo Cars—Green Car Centre.[Online] Available from http://uk.cars.yahoo.com/green-car-centre/whatisthis.html. [Accessed 8th Aug
2007].
43
44