adaptive to the scenario that is steady system which the process is time ... discrete-event simulation methods to analyze resources utilization, staff level, .... column, and the fifth column represents the probability of the theory ..... Epub 2005 Dec 19. 10. ... Operations Research Introduction to Probability Models (Fourth Edition).
Available online at www.sciencedirect.com
Systems Engineering Procedia 5 (2012) 266 – 275
International Symposium on Engineering Emergency Management 2011
Discrete-Event Simulation Engineering in Evaluation of Medical Treatment Capability against Biochemical Terrorist Attacks Juyun Wanga,Cheng Jiangb,Hua Yub a b
The School of Science,Communication University of China,Beijing 100024,China
College of Engineering,Graduate of Chinese Academy of Sciences,Beijing 100049,China
Abstract Large-scale victims would flock to the nearest hospital in a short period of time against biochemical terrorist attacks. It better treat these victims within the “Golden Hour” as more as possibly. In this paper, we proposed a new method to predict the medical treatment capability with two steps. First of all, we built a model to calculate the number of victims arriving in hospital with Monte Carlo Simulation engineering method, and then simulated this model to generate the victims-flow arriving in hospital and made chi-square test to find out that these data distribution follow Poisson distribution approximately. Secondly, we built another model to calculate the medical treatment capability based on the generated data from the first simulation. As a result, we can get the capability and main factors influencing it. The parameters in these models and procedures can be adjusted depending on specific scenarios, so that they can be integrated in decision support systems of relevant engineering areas and play an auxiliary role for decision-makers in an emergency management. © by by Elsevier Ltd.Ltd. Selection and peer-review under responsibility of DeshengofDash Wu. Dash Wu ©2012 2011Published Published Elsevier Selection and peer-review under responsibility Desheng
Open access under CC BY-NC-ND license. Keywords:medical treatment capability;biochemical terrorist attacks;engineering ;discrete-event simulation engineering;
1. Introduction Biochemical terrorist attacks refer to the activities whose goals are to produce fear in the population with a subsequent disruption of society[1],such as Sarin gas incident which occurred in Matsumoto city on June 27,1994 and again at Tokyo subway in 1995.These attacks all brought on tremendous loss of personnel and property .According to historical lessons and biochemical materials’ peculiarity, it’s known that if such terrorist attacks happened, most people would seek for treatment in near hospitals by themselves except that a few persons, who weren’t able to walk due to attacks, would have to wait for ambulance rescues. The Aum Shinrikyo event indicated that almost 14 to 15 times as many people as were estimated to be actually symptomatic will show up at hospitals, requesting treatment. Therefore, there would be large demands for medical treatment, and the hospital would be in a crowded state called “surge capacity”[2].Above researches are relevant to problems how to reduce and alleviate crowded scenes in emergency departments[3],but they have unique characteristics. Morbidity and mortality are affected if care is not instituted with the first hour after injury [4]. Predicting the medical treatment capability exactly is very critical regardless of natural disasters or biochemical terrorist attacks that lead contagious diseases happen[5,6].According to Larson’s researches, even if victims were successfully diagnosed, antibiotics were distributed broadly and drug adherence was high, two pounds of weaponsgrade anthrax dropped on a large city could result in more than 100,000 deaths. The reason for the catastrophic 2211-3819 © 2012 Published by Elsevier Ltd. Selection and peer-review under responsibility of Desheng Dash Wu. Open access under CC BY-NC-ND license. doi:10.1016/j.sepro.2012.04.042
267
Juyun Wang et al. / Systems Engineering Procedia 5 (2012) 266 – 275
death toll: Not enough people would receive antibiotics quickly enough to prevent symptom from developing, and those who developed symptoms would overwhelm the medical facilities[7].However, if decision-makes could know the hospital’s medical treatment capability in advance, they would transport victims exceeding the capability of the hospital to other hospitals, or transport doctors from other hospitals to the hospital dynamically to improve the emergency treatment performance. Many researchers have developed issues on the medical treatment capability in various perspectives: References [8-12] discuss simple Queuing Theory and transient Queuing Theory approach. The simple Queuing Theory is just adaptive to the scenario that is steady system which the process is time invariant. For a system having a large number of victims, the transient approach becomes infeasible[12].On the other hand, References [13-15] all adopted discrete-event simulation methods to analyze resources utilization, staff level, proper layout in emergency rooms, and related problems on emergency. These approaches can handle with large-scale victims scenarios because Monte Carlo simulation is relatively insensitive to the size of the state space. We decide to use discrete-event simulation method to formulate a series of models, based on the assumption of a biochemical terrorist attack scenario that is consistent with true world, comparing with aforementioned researches. These models are simulated subsequently. In this way, we can get the medical treatment capability of a hospital against a specific biochemical terrorist attack. 2. Scenario Assumption The place of our research is set against a certain large subway station, such as a subway station of Line One in the city of Beijing taken as an example. These destinations are often be targeted as the place of terrorist attacks for terrorists because of large-scale people. Based on the observation we make at the station and scattered problems in reference [14], our models involve the following scenarios. There are always two subways arriving in opposite at the subway station, and every subway has six carriages, and each carriage can admit 245 persons more or less. So it adds up to 1,470 persons when the subway is full of passengers, and there exists almost 2,940 persons when the two subways arriving at the station at the same time. During the peak periods, such as morning, the carriage can admit 300 persons, so the passengers of the two subways are added up to 3,600 persons approximately. Thus, the station can hold up passengers at least from 1,700 persons to 2100 persons, and at most from 3,300 to 4,200, including about 300-600 persons waiting for subways on platform. On average, there exists about at least from 700 persons to 900 persons, and at most from 1,700 persons to 2,000 persons. It is known that victims would spend at least five minutes on walking from the station to arrive the nearest hospital if a biochemical attack happened. Therefore, few victims would arrive at hospital during the first five minutes of the “Golden Hour”. Likewise, most persons would have arrived at hospital before an hour, so few victims would arrive in hospital during the last five minutes of the “Golden Hour”, too. As a result, we mainly simulate the scenario that victims arrive in hospital between 5 minutes and 55 minutes of the “Golden Hour” after the attack happened. We built two models in terms of time based on the above scenarios:(1)Model of Arrived Victim in a hospital(2)Model of Medical Treatment Capability of a Hospital. In what follows, we present our methodology. 3. Model of Arrived Victims in a Hospital and Simulation
3.1. Model of arrived victim Based on the above assumption, we formulate the following notations. Let’s first introduce our notation, let ' let 7
^W �W �
�
^G
�
�G � �� �G Q ` denotes the set of the places in the emergency, and
�� �W P ` denotes the set of the time in the emergency, and let 6
of the places of the hospitals in the emergency, and let $G W
L M
�G
��} �Q� �W
^V �V �
�
�� �V O ` denotes the set
��} �P denotes the number
268
Juyun Wang et al. / Systems Engineering Procedia 5 (2012) 266 – 275
of the victims on the spot. When a biochemical terrorist attack happen, the rate of victim j arriving in hospital is ¬M � M
���� S
.We give
the rate of ¬ the victims arriving in hospital in different times as Table 1,and these data are based on the study which we carried out in the year 2008[16]. Table 1. Rate of ¬ the victims arriving in hospital in different times Time Interval
Probability
Number
0-5minutes
0-0.6
0
0.6-0.7
1
……
……
5-15minutes
15-25minutes
……
0.95-1.0
5
0-0.2
5
0.2-0.43
3
……
……
0.98-1.0
7
0-0.02
2
0.02-0.05
1
……
……
0.99-1.00
0
……
……
We set the interval of the victims arriving at hospital as 7L �L
����� �Q firstly. Then using Monte Carlo
method to generate a series of random which follow the uniform process in the [0,1] interval, we can pick out the simulated number of victims arriving in hospital within an hour referring to Table 1.Finally,we get the simulated
value of the time WL�L
����� � P .
3.2. Simulation and Result 3.2.1. Generating data with our first procedure We set the interval as 30 seconds, and adopt the above model to generate the simulated persons every 30 seconds in this paper. The amount of the simulated group is added up to ten. We make a statistics of this simulation result which can be seen as Table 2. Table 2. Result of the simulation of the model of the arrived victims Group
1
2
3
4
5
6
7
8
9
10
Mean of each group
4.89
5.02
4.96
4.88
4.68
5.48
5.00
4.70
5.13
5.16
Variance
8.025859
8.423838
8.83859
8.672323
7.573333
7.743970
8.868687
8.050505
10.17484
8.115556
Standard Deviation
2.83995
2.902385
2.972977
2.944881
2.757969
2.782799
2.978034
2.837341
3.189804
2.848781
Maximum Deviation to Mean
0.31
of each group Maximum Deviation to Variance of each group
Minimum Deviation to Mean
0.01
of each group 1.8394
Minimum Deviation to Variance Of each group
0.08843
269
Juyun Wang et al. / Systems Engineering Procedia 5 (2012) 266 – 275
Maximum Deviation to Standard
0.302692
Deviation of each group
Minimum Deviation to Standard
0.01527
Deviation of each group
Mean of total groups
4.99
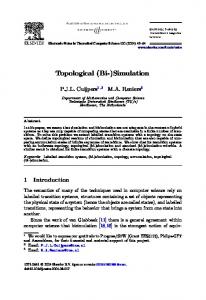
3.2.2. Graph of the simulation result We can generate the distribution graph based on the simulation result, shown as Fig 1.From Fig 1, it can be seen that the horizontal axis represents the time duration since the first victim arriving in hospital and the vertical axis represents the cumulative total amount of victims arriving in hospital from the time the first victim arriving in hospital to the present. It can also be concluded that the rate of the victims arriving in hospital follows Poisson distribution approximately, and the total number of victims at the end of the “Golden Hour” is about 500 persons.
Fig. 1. Number of the victims arriving in a hospital in an hour
3.2.3. Making chi-square test with the experienced probability The statistics such as t test or F test are all based on a certain distribution process as assumption, for example, Normal process or Poisson process. We also want to know about whether the sample is consistent with some processes in our common work. Therefore, we adopt Chi-Square Test in this paper. The improved transient Queuing Theory set the victims flow as Poisson process. To compare with it, we make a test based on the scenario in this paper. Specifically, it is a Poisson Goodness-of-Fit Test. That is, we want to make sure whether the arrived victims process follows Poisson process or whether the random variable follows Poisson distribution. Therefore, we make a simulation with Chi-Square Test. We assume that hypothesis + � is the distribution that follows Poisson process and + � is the opposite. We know that the Poisson distribution rate is 3 ^;
L`
O
L
L�
H ��¬ is an unknown parameter �O
�
�
�
���
(1)
Ц .We assume the likelihood function as We adopt Maximum likelihood method to get the estimation of ¬set as ¬ Q
/�[ L �¬
3�; L �
Q
[ L
[
¬L
[ �H L �
�¬
(2)
L
After making a logarithm with the equation and set that to zero, the expression becomes w OQ /�[ L � O _O OЦ � ���������������������������������������������������������������� wO This equation is solved to be
(3)
OЦ [ ���������������������������������������������������������������������������������(4) Finally, we can get the result as follows
270
Juyun Wang et al. / Systems Engineering Procedia 5 (2012) 266 – 275 L
¬Ц
���� , 3
^;
L`
����
H
�����
(5)
L� We get the result of Chi-Square Test as Table 3.
Table 3. Result of Chi-Square Test Group sortNumber
Ai
fi
fi2
SЦL
QSЦL
QSЦL (Merge)
IL � QSЦL L
1
A0
2
4
0.007521422
0.752142
9.364257
27.01763
2
A1
13
169
0.036779756
3.677976
3
A2
9
81
0.089926503
8.99265
8.99265
9.007356
�
4
A3
16
256
0.1465802
14.65802
14.65802
17.46484
5
A4
5
25
0.179194295
17.91943
17.91943
1.395134
6
A5
16
256
0.17525202
17.5252
17.5252
14.60753
7
A6
6
36
0.142830396
14.28304
14.28304
2.520472
8
A7
7
49
0.099777234
9.977723
9.977723
4.91094
9
A8
14
196
0.060988834
6.098883
6.098883
32.13703
10
A9
8
64
0.033137267
3.313727
11
A10
4
16
0.016204123
1.620412
We explain the above Table 3 in details as follows: the first column represents the sort number of the experiment, and the second column represents serial number of the experiment, and the third column represents the absolute balance between the observation value and the theory value, and the fourth column represents the square of the third L
column, and the fifth column represents the probability of the theory 3 ^;
L`
����
H
�����
,and the sixth L� column represents the theory value, and the seventh column represents the merge of the last fourth data, and the eighth column represents Chi-Square Test weight. Among them, n=100, and we merge the last fourth data because
IL
�
that their theory value are all less than 5.Finally, we get F
�
�
¦ QSЦ
� Q
�������� , and calculate the degree
L �
of freedom of Chi-Square Test is . � � � �
� ����
�.
We assume that the decline area of Chi-Square Test is F F
�
D
��
�
�
t F D�N � U � � ,and D
���� .We get
������� from the Table 3.Because there exists �������� d ������ ,we can consider that the process
follows Poisson based on K.Pearson (1990) [17]. 4. Model of Arrived Victims in a Hospital and Simulation
4.1. Model of Medical Treatment Capability of a Hospital We can see the number of victims would be about 500 within an hour from Fig 1.In fact, it’s hard to treat 500 persons within an hour in a middle-scale hospital in China, and it needs to transport victims exceeding the capability to other hospital legitimately. Let the number of servers of the hospital is 1 V ,we assume that a hospital has 10 servers in this paper, that is, 1 V
�� ,and the rate of services that victims received is 6 persons per hour on
average, and the time of services follows exponential distribution. The reason for choosing this type of distribution is that only Poisson distribution and exponential distribution has the character of memorylessness. However, Poisson distribution is used for discrete type of data, but exponential distribution is used for continuous type of data. Therefore, the exponential distribution is suitable for the continuous services time in the Queuing Theory [17].
271
Juyun Wang et al. / Systems Engineering Procedia 5 (2012) 266 – 275
The exponential distribution of the density function is expressed as follows. �¬[
I�[ ¬H ¬!
® ¯�
[
t ��
�½
(6)
¾ ¿
[ � � The distribution function is expressed as
� � H �¬[ ® ¯�
)�[
[ t � ½
We set this equation U
[
(7)
¾ [ � �¿ )�[ , with the reverse method, we get
�
OQ���U ¬ Among this equation, U is a random generated in the interval between 0 and 1. �
(8)
4.2. Simulation and Result Using the equation (8), we simulate this model. There will be a service time x generating by the equation as random r is generated. O is the constant rate of medical service. We can calculate the departure time of each victim with x as intermediate data. At this time, we calculate the time that victims leave the hospital after treating with the following equation, that is, Departure Time of the victim = Time of the victim arriving the hospital + Time of the victim receiving medical service. We need to alter the equation which is used to calculate that time, Departure Time of the victim = Time of the victim just leaving the hospital + Time of the victim receiving medical service. In total, we simulate a hundred groups but only list three groups of data considering the capacity of this paper. The result of medical treatment capability model can be seen as Table 4.Among them, the value of each column represents the departure time of victims set as Tl for each server except the first column representing the sort number. Table 4. Result of the simulation of each server for medical treatment capability
Group sortNumber
DT1
DT2
DT3
DT4
DT5
DT6
DT7
DT8
DT9
DT10
N1:54
13.87
10.15
25.32
35.31
11.23
31.73
21.63
11.68
8.67
8.70
33.15
16.36
31.31
37.52
15.54
57.83
44.47
14.47
22.07
31.37
……
……
……
……
……
……
……
……
……
……
59.10
67.47
63.77
21.52
16.75
11.77
23.91
18.38
17.77
……
……
……
71.07 N2:57
8.12
7.01
10.16
22.68
14.54
7.95
19.58
10.89
13.20
34.50
26.28
11.63
……
……
……
……
……
……
……
70.14
59.42 62.40
N3:58
41.21
32.20
15.48
7.25
27.82
9.03
8.75
13.43
11.32
13.65
75.28
42.02
17.80
43.82
29.56
14.19
20.97
18.94
20.37
16.60
……
……
……
……
……
……
……
……
……
……
272
Juyun Wang et al. / Systems Engineering Procedia 5 (2012) 266 – 275 60.50 ……
……
……
……
……
……
……
70.09 ……
……
……
……
The amount of victims each group treating can be seen as Table 5.Each value represents the total amount of victims each group treating from the above Table 4. Table 5. Total amount of victims each group treating Group
N1
N2
N3
N4
N5
N6
N7
N8
N9
N10
Total number of victims leaving the hospital after treatment
54
57
58
61
64
64
63
49
56
59
The first simulation is based on the virtual given probability of the victims arriving in hospital. What we conclude is that the first simulation has these characteristics. The average is 59.5, and the variance is 60.5, and the standard deviation is 7.778175, and the interval of confidence is between 57.9755057 and 61.0244942865, and the most frequent number among these data is 56.The probability distribution can be seen as Fig. 2.The statistics can be seen as Table 6. �� �� �� �� �� �� � ������
������
������
������
������
������
������
������
������
����
�
Fig. 2. Probability distribution of the first simulation
Table 6. Statistics of the first simulation The number of victims treated interval
Percentage of the total number
46—50
0.19
51—55
0.20
56—60
0.35
66—70
0.22
71—75
0.04
5. Monte Carlo procedure We use this Monte Carlo procedure shown as Table 7 to simulate these models, and the implement program language is Groovy. Table 7. Monte Carlo procedure
Juyun Wang et al. / Systems Engineering Procedia 5 (2012) 266 – 275
K
� , T=60minutes.
1) Let initial time If
273
�
K d_ 7 _ ,do: Calculate the number of victims arriving in hospital
K � ���
K
Insert �K �
Q
K
Q
K
at the time
K
.
.
to the sequence table
7
�
.
Else, end.
7
2) If
d_ 7 _ ,
O
Let the total number of servers is servers being at work If
Q
V
1
d
Q
6
V
1
6
.For each time K , calculate the number of
.
,do:
Put the next victim to the server for treatment, and calculate the time of service x, and
7
then calculate the departure time of the victim
K �[
O
.
Else, do: Put the next victim to the queue to wait for treatment, and send him or her to the earliest server for treatment until there turns up an idle server. Then, we calculate the time of service x, and calculate the departure time of the victim with the following equation.
7
7
O
� [
OE
, among them,
7
OE
is the departure time of the victim just leaving
the server.
K � ���
K
.
Else, do: Break the loop of this server, until all the departure time of victims in each server meet
7
this constraints
t_ 7 _��O
O
��������
1
V
.
3) Make statistics of all the servers, and sum up to the capability
1
1
7
,
7
7
¦ Q K
K
.
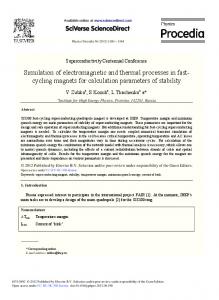
6. Sensitivity Analysis To compare with the first simulation, after changing the virtual given probability, we simulate these models again. As a result, we get the result of the second simulation. We make a statistics of the result as follows. The average is 56, and the variance is 32, and the standard deviation is 5.656854, and the interval of confidence is between 54.89128 and 57.10872, and the most frequent number among these data is 59.The probability distribution can be seen as Fig.3. The statistics can be seen as Table 8.
274
Juyun Wang et al. / Systems Engineering Procedia 5 (2012) 266 – 275
�� �� �� �� �� �� �� � ������
������
������
������
������
������
������
������
������
����
�
Fig. 1. Probability distribution of the second simulation
Table 8. Probability distribution of the first simulation The number of victims treated interval
Percentage of the total number
41—45
0.01
46—50
0.15
51—55
0.28
56—60
0.32
61—65
0.17
66-70
0.05
71-75
0.02
In addition to the research on medical treatment capability, we study the related factors influencing it. When the number of the servers is improved twice, that is, the number of servers of the simulation is improved from 10 to 20, the medical treatment capability is improved twice approximately. When the rate of the services is improved twice, that is, the rate is improved from 10min/per person to 5min/per person, the medical treatment capability is improved double approximately. From the above results, we can see the number of the servers and the rate of the service influence medical treatment capability. Only if we improved these factors, we can improve the index of the hospital indeed. 7. Conclusion The number of victims from the simulation of the model of arrived victims follows Poisson distribution approximately. It is consistent with the assumption of the research with transient Queuing Theory. As the unstable state of victims arriving at hospital against the emergency, the traditional Queuing Theory is limited. Therefore, we can calculate the number of arrived victims with the Monte Carlo method or the transient Queuing Theory. We use Groovy language to write procedure. It is an agile and dynamic language for the Java Virtual Machine, and builds upon the strengths of Java but has additional power features inspired by languages like Python, Ruby and Smalltalk. So the procedure is easy to read and maintain. It can be concluded from the simulation that the average is ideal and the interval of confidence is short from the 100 simulations. Therefore, we can estimate the treated victims within an hour with these models, and then reduce the victims with best in the emergency management. To facilitate formulating models and simulating, we set the parameters the “Gloden Hour” as an hour temporally. However, these values can be varied depending on the various scenarios in order that the models and procedure can finally be extended and integrated into emergency systems of some engineering areas.
275
Juyun Wang et al. / Systems Engineering Procedia 5 (2012) 266 – 275
Acknowledgements This work is supported by National Basic Research Program of China(973 program) with Grant No.2011CB706900,National Natural Science Foundation of China(Grant No.70971128),Beijing Natural Science Foundation(Grant No.9102022) and the President Fund of GUCAS(Grant No.O95101HY00).
References 1. J. Communicable Disease Control, Epidemiology & Immunization Section, Public Health – Seattle & King County. Surveillance and Preparedness for Agents of Biological Terrorism (presentation), 2001. 2. Daniel P.Davis, MD;1,2 Hospital Bed Surge Capacity in the Event of a Mass-Casualty Incident. Original Research. Davis DP, Poste JC, Hicks T, et al. Hospital bed surge capacity in the event of a mass-casualty incident. Prehospital Disaster Med 2005 May–Jun;20(3):169–176. 3. Wang Yun-feng,Tian Xin,BAI Qing-hua.Research on simulation analysis system of overcrowding in hospital emergency department.Application Research of Computers,Vol.25 N0.1 Jul 1.2008. 4. Lerner EB, Moscati RM. The golden hour: scienti¿F�IDFW�RI�PHGLFDO�µµXUEDQ�OHJHQG¶¶"�$FDG�(PHUJ�0HG�������������–60. 5. Burkle FM, Jr: Mass-casualty management of a large-scale bioterrorist event: An epidemiological approach that shapes triage decisions. Emerg Med Clin North Am 2002;20(2):409–436. 6. Bloem K:Treating the sick: Capacity of the US health care system to respond to an epidemic. Public Health Rep 2001;116(Supplement 2):34–35. 7. Larson, R., Metzger, M., & Cahn, M. Decision Models for Emergency Response Planning. Create Report under FEMA Grant EMW-2004GR-0112. 8. Roberto D.Galvao.2008.Emergency Service Systems: the Use of the Hypercube Queueing Model in the Solution of Probabilistic Location Problems. INTERNATIONAL TRANSACTIONS IN OPERATIONAL RESEARCH. Intl. Trans. in Op. Res. 15 (2008) 525–549. 9. Linda V. Green.2006. ACADEMIC EMERGENCY MEDICINE: Using Queueing Theory to Increase the Effectiveness of Emergency Department Provider Staffing. Acad Emerg Med. 2006 Jan;13(1):61-8. Epub 2005 Dec 19. 10. L. V. Green, “Queueing Analysis in Healthcare”, in R. W. Hall editor, Patient Flow: Reducing Delay in Healthcare Delivery, International Series in Operations Research; Management Science, Springer US, pp. 281-307, vol. 91, 2006. 11. Juyun Wang, Hua Yu, Jianyu Luo, Jie Sui. Medical Treatment Capability Analysis using Queuing Theory in a Biochemical Terrorist Attack, The 7th International Symposium on Operations Research and Its Applications (ISORA’08)ˈpp425-434. 12. Peter W.GLYNN1 and Donald L.IGLEHART2.simulation methods for queues:an overview.Queueing Systems,3(1988)221—256. 13. Amita J.Joshi.2008.A Thesis: Study on the Effect of Different Arrival Patterns on An Emergency Department’s Capacity Using Discrete Event Simulation. Joshi, A. J. 2008. Study on the effect of different arrival patterns on an emergency department’s capacity using discrete event simulation. Master’s thesis, Department of Industrial & Manufacturing Systems Engineering, Kansas State University, Manhattan, Kansas. Available via [accessed March 31, 2009]. 14.
Elliot
J.
Montes.
Bioterrorism
Preparedness
in
Health
Care
Systems
via
Simulation
Modeling.
http://scholar.google.com.hk/scholar?hl=zhCN&q=Bioterrorism+Preparedness+in+Health+Care+Systems+via+Simulation+Modeling&btnG=%E6%90%9C%E7%B4%A2&lr=&as_ylo=& as_vis=0 15. C.S.Jianga.Crowding in platform staircases of a subway station in China during rush hours. Safety Science 47(2009)931-938. 16. D. H. Young. Two Alternatives WR�WKH�6WDQGDUG�Ȥ�-Test of the Hypothesis of Equal Cell Frequencies. Biometrika Vol. 49, No. 1/2 (Jun., 1962), pp. 107-116. 17. Wayne L. Winston et al. Operations Research Introduction to Probability Models (Fourth Edition).ISBN 7-302-13319-0.