muller, Peter Kacsuk, and Jack Dongarra, editors, Recent. Advances in Parallel Virutal ... Massie, and David E Culler. Wide area cluster monitor- ing with ...
Disparity: Scalable Anomaly Detection for Clusters Narayan Desai, Rick Bradshaw, Ewing Lusk Argonne National Laboratory, Argonne, Illinois 60439 {desai,bradshaw,lusk}@mcs.anl.gov
Abstract In this paper, we describe disparity, a tool that does parallel, scalable anomaly detection for clusters. Disparity uses basic statistical methods and scalable reduction operations to perform data reduction on client nodes and uses these results to locate node anomalies. We discuss the implementation of disparity and present results of its use on a SiCortex SC5832 system.
1. Introduction System monitoring is an important function of cluster system software. The information gathered in the monitoring process is used in diverse tasks, ranging from scheduling decisions to problem detection and historical trend analysis. Disparity is a parallel program that periodically computes a set of statistics describing the distribution of an arbitrary set of variables across a set of nodes of a parallel machine. If this set reflects values that should be relatively constant across the nodes at a given time, then the distribution can be examined for anomalous behaviors that indicate failures or preferably incipient failures. The data collected on large systems tends to be voluminous; disparity takes two main approaches to address this issue. It performs data summarization using basic statistical techniques, and it performs anomaly detection using per metric thresholds. In this paper, we discuss the design and implementation of disparity and its use on a SiCortex SC5832 system. This work is an outgrowth of the research described in [1]. Whereas that research validated the utility of MPI libraries for system tools, this work addresses monitoring problems with parallel techniques.
2. Related Work Many monitoring systems for clusters exist. These systems typically specialize in scalable information collection. That is, their technical focus is the collection of large quantities of data for analysis. Supermon [6], for example, focuses on causing minimal application perturbation. This approach has been successful, resulting in sample rates in excess of 1 kHz. Other monitoring systems, such as Ganglia [5], focus on historical trend information and wide-area aggregation. NWPerf [3] has a minimal perturbation goal similar to Supermon; however, it provides job-specific performance metrics. The goal in this case is not to monitor overall system performance but to locate application-specific problems. The three systems share a number of design decisions. They all use a hierarchical, aggregative data format, with multilevel hierarchies to scale node or site counts. Moreover, they all use a variety of ad hoc parallelism: Supermon and NWPerf uses an aggregation tree, while Ganglia uses IP multicast to collect data. Most important, all these systems strive to provide as much metric data as possible from the client nodes to some central location. As these system-monitoring tools become more effective, more data is collected. Similarly, as system sizes continue to grow, more clients must be monitored. The confluence of these factors creates a greater-than-linear growth in the sheer quantity of monitoring data. This growth in turn creates another issue for monitoring systems: data interpretation. Specifically, collecting large amounts of data consumes large amounts of resources, often leaving few resources for real-time data interpretation. Disparity uses a different approach. It is written as a parallel program that performs simultaneous analysis and summarization. This approach reduces the overall amount of data collected and more readily reveals patterns in the underlying data.
3. Design The purpose of disparity is to provide scalable system summaries of node metrics that can be used to detect anomalies. In developing the system, we therefore focused on two areas: tool scalability and pattern recognition.
3.1. Scalability Two scalability-related issues were problematic. The first involved building a scalable software infrastructure for large-scale serial services. Many system services, and all existing monitoring systems, are fundamentally serial services. That is, all clients communicate with one or more servers, and each of these transactions is serial. Constructing a scalable software infrastructure for large-scale serial services is costly and onerous. One solution is to write tools as parallel applications. This change allows client nodes to contribute resources to shared goals in a scalable fashion. Moreover, as the number of clients grow, the resources dedicated to the solution of a given problem are scaled at the same rate. Accordingly, we implemented disparity as an MPI program. MPI is nearly ubiquitous on scalable systems, and it frequently provides access to the fastest networks and the highest-quality parallelism. This approach, discussed in detail in [1], provides an appealing workload for shared systems. The second scalability-related issue we focused on was the sheer volume of data involved. To address this issue, we implemented various statistical operations as scalable reductions, allowing the summary of client metrics to be both scalable and representative. The anomaly detection process also uses these same operations; hence it is scalable as well.
3.2. Anomaly Detection Anomaly detection was another objective in the design of disparity. The basic process is as follows. Data is collected, some basic statistics are generated, and the data is postprocessed to locate outliers. In order for this process to be scalable, all clients must have access to the collective statistics. Hence, the reduction must be broadcast to all nodes. Once all clients have the statistics, each can calculate in parallel whether it is an outlier. Outliers are assumed to be the interesting features: they provide a low-resolution “map” that can be used to find interesting areas to explore further.
The process itself is simple. The difficult part is the definition of expected condition patterns. For example, a common pattern present in many (though not all) parallel programs is a uniform distribution of system load. Hence, users must be able to represent value distributions to disparity. Three mechanisms have been implemented in disparity to describe value patterns. The first uses static maximum or minimum bounds for variance can bracket values in a range of a fixed size. For example, the maximum amount of variance could be fixed at .25; the middle of could be set at the mean value of load average, with the range of conforming values extending .25 above or below the mean value. All nodes with nonconforming values are flagged as anomalies. The second mechanism uses a variance multiplier. The third mechanism is a hybrid, combining the preceding two schemes to provide a flexible description of allowed ranges with static minimum or maximum bounds.
4. Implementation The implementation of disparity is nearly a transcription of the architecture described above. We have implemented custom MPI operations to calculate mean, standard deviation, minimum, and maximum. All of these values are calculated through two reductions. A single execution occurs as follows. Disparity gathers one or more metrics on each node. This process results in a series of floating-point numbers on each client. Two parallel reductions are then used to calculate the mean, variance, minimum, maximum, and standard deviation for each metric. The result is a single summary of each metric across all nodes in a scalable manner. Once the mean and standard deviations have been calculated, they are distributed to all nodes. This data is used to perform thresholding. Upon startup, disparity is given a series of parameters that describe the usual distribution. If a node is outside the normal distribution, it is marked as an outlier. The user-visible result of this process is a combination of the summary information and a list of the outliers. This data can be used to further guide information gathering.
4.1. Metric Detection Disparity supports the gathering of various metrics on Linux systems. It reads this information directly
out of /proc. This mechanism is fairly efficient; however, it is platform specific. Several probes are included with disparity. • Free and used memory
• Clock skew • Network statistics We then used disparity to locate variance in the results of these probes.
• Free and used swap • Load average • Number of CPUs • Network statistics • Disk statistics The probes are run on each node running an disparity process. They return a single floating-point number on standard output. Disparity then reduces this value. For more detail about these probes, see Section 5.
4.2. Thresholding Disparity processes node metrics during summarization. Metric summaries allow the easy identification of patterns in the metrics. Once the patterns are understood, a threshold definition can be provided for each metric. This threshold describes normal patterns in the metric; clients that fall outside this pattern are flagged as failures. Thresholds can be defined a few ways. The simplest involves uniform patterns, in which all values should be identical. Similarly straightforward are static distributions, in which all values should fall in a static size range. This second type of threshold has an autocalibrating property: the range is specified, but the range’s location is not. More complicated thresholds can also be defined, based on the values of standard deviation or variance. Using these values allows the threshold to describe highly dynamic patterns that autocalibrate, not only to current metric values, but also to the current distribution.
5. Results Once disparity was implemented, we began to gather metric summaries across one of our clusters. Motivated by the fact that one of our clusters is nearly six years old and that hardware failures are frequent, we decided to use disparity to locate these failures. We therefore wrote a probe to detect each of the main hardware failure cases: • CPU count • Memory count • Swap size
5.1. Variance The first three of the tests expect uniform results across nodes, as this system is homogeneous. For example, all compute nodes should have two CPUs. We set the failure threshold to any values below the maximum. Hence, when the test is run, any nodes having fewer than two CPUs will be detected as errors. Using a symbolic threshold provides automatic calibration; any homogeneous cluster can use this threshold. We note, however, that if all nodes are failing, the autocalibrating threshold will not detect this failure. Error thresholds for the remaining two fitness tests are slightly harder to construct. While the values are expected to be clustered closely, they are not expected to be the same in all cases. For each of these, we defined a static allowed variance threshold. For clock skew, nodes with a range no larger than 0.5 seconds fall within the success threshold. Similarly, a static variance of four Myrinet routes are allowed, as several reasonable scenarios allow the addition or loss of Myrinet routes without causing failures. At this point, summaries of metrics across the entire system became less useful. Statistical summaries could be calculated scalably, but the utility of the results varied widely. To understand the reason, consider load average measurements taken across a large number of nodes, each performing a different task. The distribution of load averages is likely to be uniformly spread across a large range of values. Moreover, outliers in this metric are not likely to be indicative of failures. To address this issue, we placed nodes into taskbased groupings based on current job activity. Each node was put into a group for its current job or into an idle partition if no job was currently running. Our assumption was that nodes involved in parallel jobs have roughly similar performance characteristics. We had observed that as the scale of parallel systems increases, application programmers have treated nodes collectively, thereby dramatically reducing “one-off” activities of nodes. Our task-based groupings alleviated this problem, stabilizing summaries for activity-based metrics considerably. Hence, we were able to analyze activity-based data in a meaningful way. We currently gather up to 13 metrics, including load average, used memory, network transmission rates, and
disk read and write rates. These metrics allow us to detect several types of activity imbalances that occur frequently in active jobs. The metrics also allow us to detect stray processes on idle nodes.
5.2. Performance We conducted one performance test with disparity, using an MPI implementation based on MPICH2. Each data point consists of the average time of 100 reductions at each size. Our test was run on a SiCortex SC5832 system. We used the vendor implementation of MPI, which is based on MPICH2. We varied the number of nodes and the number of metrics reduced. Multiple metrics can be reduced simultaneously, so the cost of additional metrics is low.
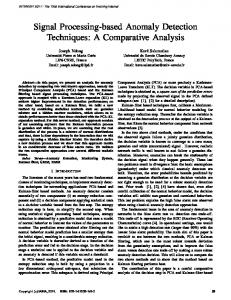
Figure 1. Multiparameter Performance
As the performance numbers in Figure 1 show, processing statistics with this mechanism is fast and scalable; the largest runs included nearly 6,000 cores. Moreover, it is efficient enough to be performed at rates in excess of 15 kHz. While using disparity at this rates would be foolish, its ability to run at high frequencies demonstrates the low perturbation effect it can have on time-sharing systems. We note, however, that the largest runs have quite inconsistent performance. We expect that these issues are due to operating system noise [4]. The implementation of AllReduce used in the SiCortex MPI implementation is particularly sensitive to OS noise in the software release used for testing; because of disparity’s heavy use of AllReduce, these effects are pronounced.
6. Conclusions and Future Work Disparity offers several invaluable characteristics when compared to other data collection systems. Its overall architecture provides a scalable, representative summary of metrics across large systems. The process allows one to easily locate atypical nodes. Further, disparity does not require any scalable infrastructure; the workload is split evenly across clients. Disparity cannot easily replace traditional monitoring systems because it does not provide persistent metric storage or long-term trend information. It does, however, provide a view of system metric relationships and patterns that enable efficient evaluation of overall usage and performance. The disparity approach holds much promise, particularly as systems continue to grow. We plan to enhance this approach in several ways. One important enhancement addresses the fact that because of the similarity requirement caused by the metric summary process, our current approach does not lead to a simple clusterwide monitoring system. We therefore intend to build an aggregation mechanism with the aim of supplanting the traditional monitoring system. Application perturbation is another area that warrants investigation. As system sizes continue to grow, compute node operating systems are pruned to support only important functions. Even if the compute node OS remains Linux, some system functions are often disabled for performance reasons [4]. Monitoring systems frequently require a per node presence and can consume large amounts of resources depending on the resolution of data collected. We believe that we can minimize application perturbation by using our scalable anomaly detection routines to cause increased data collection during “interesting” intervals. Several algorithmic enhancements could be useful as well. We are particularly interested in the use of multimetric thresholds and in the calculation of system summaries in a single pass. Moreover, a better mechanism for metric acquisition is needed. We currently collect data manually, from local resources (e.g., /proc on Linux). Needed is an extensibility mechanism so that new metrics can be incorporated without incurring serious performance penalties. One other area of investigation concerns tool use. Disparity can already be used with parallel tools such as MPISH [2], but integration is also possible with other tools. The wide availability of a scalable tool composition environment would enable ad-hoc construction of sophisticated system management tasks.
Finally, while MPI is a good fit for long-running applications that require scalability, it is not yet clear that MPI is appropriate for long-running tools that must cope properly with failures. System tools are used for diagnosis and recovery of failure conditions; currently existing MPI implementations are overly sensitive to such failures. More exploration of this area is needed in order to fully understand the infrastructure requirements of parallel system tools.
Acknowledgments This work was supported by the Mathematical, Information, and Computational Sciences Division subprogram of the Office of Advanced Scientific Computing Research, Office of Science, U.S. Department of Energy, under Contract DE-AC02-06CH11357.
References [1] Narayan Desai, Rick Bradshaw, Andrew Lusk, and Ewing Lusk. MPI cluster system software. In Dieter Kranzlmuller, Peter Kacsuk, and Jack Dongarra, editors, Recent Advances in Parallel Virutal Machine and Message Passing Interface, number 3241 in Springer Lecture Notes in Computer Science, pages 277–286. Springer, 2004. [2] Narayan Desai, Andrew Lusk, Rick Bradshaw, and Ewing Lusk. MPISH: A parallel shell for MPI programs. In Proceedings of the 1st Workshop on System Management Tools for Large-Scale Parallel Systems (IPDPS ’05), Denver, Colorado, USA, April 2005. [3] R. Mooney, R. Studham, K. Schmidt, and J. Nieplocha. NWPerf: A system wide performance monitoring tool for large linux clusters. In Proceedings of the 6th IEEE International Conference on Cluster Computing (CLUSTER04). IEEE Computer Society, 2004. [4] Fabrizio Petrini, Darren J. Kerbyson, and Scott Pakin. The case of the missing supercomputer performance: Achieving optimal performance on the 8,192 processors of ASCI Q. In Proceedings of SuperComputing 2003, 2003. [5] Federico D. Sacerdoti, Mason J. Katz, Matthew L. Massie, and David E Culler. Wide area cluster monitoring with Ganglia. In Proceedings of the 5th IEEE International Conference on Cluster Computing (CLUSTER03), pages 288–298. IEEE Computer Society, 2003. [6] Matthew J. Sotille and Ronald G. Minnich. Supermon: A high-speed cluster monitoring system. In Proceedings of the 4th IEEE International Conference on Cluster Computing (CLUSTER02), pages 39–46. IEEE Computer Society, September 2002.