J. Phys. Chem. B 2006, 110, 4679-4685
4679
Dispersion of SiO2-Based Nanocomposites with High Performance Liquid Chromatography Jun Wang,*,† William B. White, and James H. Adair* Materials Research Institute and Department of Materials Science and Engineering, The PennsylVania State UniVersity, UniVersity Park, PennsylVania 16802 ReceiVed: August 19, 2005; In Final Form: December 18, 2005
Core-shell structured Ag/SiO2 nanocomposite has been synthesized by a cyclohexane/Igepal/water reverse micelle system. The spherical nanocomposite particles were washed and concentrated with high performance liquid chromatography (HPLC) to remove the surfactant added during synthesis. Spherical SiO2 micrometerscale particles were packed in the HPLC column as a stationary phase for the washing and dispersing of Ag/SiO2 nanocomposite particles. Surface modification of Ag/SiO2 nanocomposite particles and SiO2 microspheres with silane coupling agent enhanced the surface charge of the particles and improved the efficiency of washing with HPLC. Well-dispersed Ag/SiO2 stable suspensions were successfully attained in ethanol/ water mixed solvents after HPLC washing. The state of dispersion for the Ag/SiO2 nanocomposite suspension was systematically assessed using dynamic light scattering (DLS) and transmission electron microscope (TEM) and spin coat/atomic force microscope (AFM) analyses. The mechanism of the enabling HPLC washing protocol for SiO2-based nanoparticles is discussed.
Introduction Synthesis and patterning of nanoparticles has become one of the most popular topics in recent research activities.1 Unfortunately, most of the nanoparticles generated through colloidal approaches require large quantities of surfactant or polymeric species to ensure the stability of the nanoparticle suspension.2 The trade-off is obvious because surfactant additives will be transferred to the subsequent process steps and could have a negative impact on the homogeneity of the arrays and devices assembled from the nanoparticles. Therefore, it is important to develop a protocol that can produce nanoparticle suspensions with much more modest concentration of dispersant additives. Dispersion essentially starts with washing freshly prepared nanoparticles in most wet chemical synthesis routes such that surfactants used in the synthesis may be removed. However, washing and dispersion of nanoparticles are always a challenge because of the strong van der Waals attraction between neighboring particles.3,4 For this reason, nanoparticle suspensions are stabilized with surface coatings of capping agents, which balance the interaction forces with increasing repulsive energies created by these protective molecules.5 However, the content of organic dispersants should be minimized to achieve better functionalities for nanoparticle-based devices.6,7 Conventional methods such as centrifugation, sedimentation, Soxhlet extraction, and filtration were applied to disperse Ag/SiO2 nanocomposites, but none of the approaches could produce well-dispersed nanoscale dispersion.8 Utilizing the concept of protection dispersion initially proposed by Zsigmondy,9 Kimel and Adair 10 have been able to make stable aqueous suspensions of 8-nm ZrO2 nanoparticles without serious alteration in the chemistry of the system. High performance liquid chromatography (HPLC) is a promising alternative to simultaneous washing and dispersion * J.W. - Telephone: (508) 351-7952. Fax: (508) 351-7740. E-mail:
[email protected]. J.H.A. - Telephone: (814) 863-6047. Fax: (814) 863-9704. E-mail:
[email protected]. † Present address: Saint-Gobain Ceramics and Plastics, Northboro R&D Center, Northboro, MA 01532, U.S.A.
of nanocomposite particles. The initial inspiration for washing and dispersion of nanoparticles by HPLC stems from the separation of the Fullerenes C60 and C70 originally reported by Hawkins et al.11 and Cox et al.12 using functionalized silica as the stationary phase. The physical shape of fullerenes and silica nanoparticles are quite similar, but with typical silica nanoparticles (∼20 nm) significantly larger than fullerenes (∼1 nm). Both systems have accessible surface sites that can be functionalized.2 Therefore, it was hypothesized that a separation and dispersion scheme could be established for metal/SiO2 nanocomposites by selecting a suitable stationary phase and modifying the HPLC procedures to accommodate the larger silica nanoparticles and interfacial chemistry relative to silica. This report demonstrates the washing and dispersion of the Ag/SiO2 nanocomposites by the HPLC technique. The resulting Ag/SiO2 ethanol/water suspension was characterized by TEM and dynamic light scattering (DLS) methods. The average agglomeration number (AAN) for the Ag/SiO2 nanocomposites suspension is calculated. The Ag/SiO2 suspensions obtained via surface grafting with APS and HPLC washing exhibit excellent stability at room temperature. Such particles provide an ideal precursor for the fabrication of electrooptic devices by colloidal methods such as self-assembly or electrophoretic deposition (EPD). Experimental Procedure 1. Synthesis of Ag/SiO2 Nanocomposites. The Ag/SiO2 nanocomposite particles were prepared following the procedure reported by Li et al.,13,14 and Wang et al.,8 all chemicals involved were used as received. Nonionic surfactant poly(oxyethylene)nonylphenyl ether (Igepal CO-520), cyclohexane, silver nitrate, tetraethoxysilane (TEOS), silane coupling agent 3-aminopropyltriethoxysilane (APS), hydrazine, and NH4OH (28-30%) were obtained from Aldrich Chemical Co. (Milwaukee, WI). Dehydrated ethanol (200 proof, Pharmca Products Inc. Brookfield, CT), and glacial acetic acid (J. T. Baker Chemicals, NJ) were used without further purification. All aqueous stock
10.1021/jp0547010 CCC: $33.50 © 2006 American Chemical Society Published on Web 02/17/2006
4680 J. Phys. Chem. B, Vol. 110, No. 10, 2006
Wang et al.
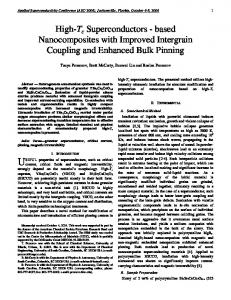
Figure 1. Schematic setup of the HPLC system for washing and dispersion of Ag/SiO2 nanocomposites ethanol/water suspension based on the size exclusion chromatography. The UV-vis detector wavelength is set at 405 nm for Ag/SiO2 nanocomposites. The size of the HPLC column is HR 5/5 (5 mm × 50 mm).
solutions were prepared with deionized water (specific conductivity ) 0.4 × 10⁻⁷ S/m). The reverse micelle system was formed by mixing 10 mL of cyclohexane and 4 mL of Igepal CO-520 followed by the addition of a prescribed amount of 0.01 M AgNO3 aqueous solution under vigorous stirring according to the R molar ratio (R ) [water]/[surfactant]). The Ag+ ions were reduced to metallic Ag by adding a drop of hydrazine into the microemulsion. An appropriate amount of TEOS was added to coat the metal cluster based on the H molar ratio (H ) [water]/[TEOS]), and a drop of NH4OH aqueous solution was introduced as a catalyst to ensure the hydrolysis of TEOS in an alkaline pH regime. The microemulsion was sealed and allowed to proceed 24 h for the completion of the SiO2 coating under stirring. 2. Washing with HPLC. A sketch of the configuration for the HPLC system is shown in Figure 1. Reverse micelle microemulsions containing Ag/SiO2 nanocomposite particles were first treated with APS-ethanol stock solution (1 w/o, percentage with respect to overall solids. 15 g of APS mixed with 15 mL anhydrous ethanol, 0.15 mL of glacial acetic acid, and 0.75 µL of DI water). The surfaces of the Ag/SiO2 nanocomposite particles are positively charged (∼30 mV) at pH 7.0 due to the surface grafting of APS. The microemulsion was mixed with 50 mL of 0.02 M acetic acid/ethanol stock solution with rapid stirring to maintain the pH below 7. The suspension was then washed and concentrated with the HPLC system (Waters Delta Prep 3000 HPLC system, Milford, MA). The stationary phase of the HPLC system was freshly packed SiO2 microspheres. To construct the stationary phase, an empty HR 5/5 column was obtained from Amersham Pharmacia Biotech (Piscataway, NJ) and packed with 20 µm APS-treated spherical silica (Stellar Phases, Inc. PA). The terminal end of the column was connected to a UV-vis spectrometer with detector set at a wavelength of 405 nm, the wavelength of the surface plasmon peak of the Ag quantum dot core. The suspension containing Ag/SiO2 nanocomposite particles was pumped into the HPLC system followed by dehydrated ethanol as the washing solvent. Flow rate of the entire HPLC operation was fixed at 2 mL/min. The nanocomposites were collected with ethanol/water solution (volume ratio 7:3). A fraction collector
Figure 2. Morphology of Ag/SiO2 nanocomposites (R ) 2, H ) 100, X ) 1) washed with conventional method. TEM images show the coreshell structure (top and inset). Particle size distribution obtained from TEM image on the top. D50 ) 30 nm, SD ) 1.2 nm (with 95% confidence interval).
was utilized to collect the solution from the HPLC column during the course of the washing procedure. 3. Characterization. The zeta potentials of Ag/SiO2 nanocomposite suspensions were determined using ZetaPALS Analyzer based on phase amplitude light scattering principle (Brookhaven Instruments Co., NY). The suspension pH was adjusted by either 0.1M HNO3 or 0.1M KOH aqueous solutions. The morphology and dispersibility of Ag/SiO2 suspensions were first examined with an atomic force microscope (AFM) (MultiMode, Digital Instruments) in Tapping Mode. The samples for AFM experiments were prepared by placing drops of the Ag/SiO2 suspension on a freshly cleaved mica substrate and spin coating the substrate at 1500 rpm for 30 s. High-resolution transmission electron microscope (HRTEM) (HF 2000, Hitachi, Japan and JEOL 2010F, Tokyo, Japan) was used to obtain images of the nanocomposite particles. A drop of freshly prepared suspension was placed on a carbon film supported on a copper grid and dried overnight in a vacuum oven. A quasielastic light scattering system (Malvern Nanosizer, Malvern Instruments, UK) was used to determine the particle size distribution for Ag/SiO2 suspensions. The morphology of asreceived SiO2 microspheres was obtained by a scanning electron microscope (SEM, Hitachi S-3000H, Japan). The surface structure of SiO2 microspheres used in the HPLC column were determined by scanning with AFM after a typical washing and dispersion cycle. All the pH measurements were carried out with a Sentron pH meter (Argus IP 65 ISFET probe, Sentron Inc., WA) calibrated against standard aqueous buffer solutions. Results and Discussion 1. Morphology of Ag/SiO2 Nanocomposites. Figure 2 shows the morphology of Ag/SiO2 nanoparticles derived from water-
Dispersion of Ag/SiO2 with HPLC
J. Phys. Chem. B, Vol. 110, No. 10, 2006 4681
Figure 3. SEM image of SiO2 microspheres used as the stationary phase in the HPLC system. The SiO2 microspheres were treated with APS (90 g of SiO2 mixed with 0.336 mL of APS, 1.5 mL of glacial acetic acid, 7.5 mL of DI water and 150 mL of ethanol, kept stirring overnight and dried at 70 °C). The surface area is 425 m2/g with average pore size of 6.5 nm (Data courtesy of Stellar Phase, Inc.).
Figure 4. HPLC spectrum of Ag/SiO2 ethanol/water suspension (R ) 2, H ) 100, X ) 1) washed with the HPLC system. Spectrum acquired at 405 nm (surface plasmon resonance of Ag quantum dots) by a UVvis detector. The washing solvent is an ethanol/water solution (volume ratio 7:3), and the flow rate is 2 mL/min. The spectrum was deconvoluted by PeakFit, the central positions of the peaks are 95.1, 112.2, and 150.7 s.
in-oil reverse micelle synthesis with conventional washing protocols. The formation mechanism and chemical kinetics of nanoparticles in the cyclohexane/Igepal/water reverse micelle system have been discussed in detail by Arriagada and OsseoAsare.15-17 The size and shape of the particles generated from the reverse micelle synthesis depend on the molar ratio of water to surfactant, R, and the molar ratio of water to TEOS, H. The general trend for the growth of Ag/SiO2 nanocomposites is that the silver core diameter is proportional to R while silica shell thickness decreases as H increases.13,18 For example, at R ) 2, H ) 100, and X ) 1 ([NH4OH] to [TEOS]), the diameter of the Ag/SiO2 nanocomposite particles obtained through reverse micelle synthesis is about 30 ( 1.2 nm, and the silver quantum dot is about 5 ( 0.6 nm ((95% confidence interval). The SiO2 layer thickness is about 12 nm. The conventional methods used to wash and collect as-synthesized nanocomposite particles result in aggregation induced by the van der Waals forces between particles, as clearly illustrated in the TEM images. Detailed comparison of these methods was made elsewhere.8 There is insufficient data to identify the formation step of the agglomeration during the entire synthesis. However, nanocomposite particles trapped in the aggregation micelle should not agglomerate due to the protective layer of surfactant.17 In many cases surfactants were applied to modify the surfaces of nanoparticles to obtain monodispersed suspensions,19-21 which would be used as ideal precursors to create nanoparticle-based devices. Therefore, it was hypothesized that removing the surfactant layer during washing induces aggregation. To minimize the aggregation during the synthesis of Ag/SiO2, it is important to simultaneously wash while maintaining dispersion of the nanoparticles. 2. HPLC Washing. The HPLC system was employed to wash and disperse nanocomposite particles to produce welldispersed Ag/SiO2 suspensions. Figure 3 shows the morphology of silica microspheres used as the stationary phase in the HPLC system. The silica particles are uniform spheres with a mean particle size of 20 µm and a pore size of 65 Å (surface area 425 m2/g). A packing density of 57% was obtained when the silica microspheres were dry-packed in the HPLC column. This generates a column porosity as high as 43%, which could form multiple microchannels for nanoparticles to migrate during HPLC operation. The silica microspheres were treated with APS to produce positive charges to prevent the positively charged
Ag/SiO2 nanoparticles from adhering to the surfaces of the stationary phase silica.22 Thus, control of the surface charge on the microspheres is a critical step in the HPLC washing to produce well-dispersed nanoparticles.23 The spectrum shown in Figure 4 reflects the washing process of Ag/SiO2 in the HPLC column. Elute of Ag/SiO2 from the HPLC column took about 3 min when the extraction solvent (ethanol/water, volume ratio 7:3) was being pumped at 2 mL/ min. The spectral intensity increased significantly at the onset point where Ag/SiO2 nanocomposite particles pass through the detector, and a stable suspension was continuously collected at the terminal end of the HPLC system. The HPLC spectrum appeared to be a relatively narrow band with a high intensity (recorded as voltage because of the HPLC detection setup) accompanied by a secondary shoulder observed in the range of the washing cycles, which was the basis for collecting wellwashed Ag/SiO2 suspension. Deconvolution of the spectrum by PeakFit yields three discrete peaks (area ratio of the three peaks is 1.1:1.8:1 with the central positions of the peaks at 95.1, 112.2, and 150.7 s. Goodness of fit r2 ) 0.9986), which may correspond to the resolution of the HPLC column for individual Ag/SiO2 nanocomposite particles and their aggregates (doublets, triplet, etc.). The entire washing procedure takes about 45 min, including an actual eluent collection time of about 3 min. This is much more efficient than conventional washing procedures such as centrifugation and sedimentation which can require days to weeks. The profile of the spectra suggests that the majority of the Ag/SiO2 nanoparticles travel through the HPLC column at a constant rate, which allows nanoparticles to continuously move inside the interstitial channels and thereby reduces the chance that particles will aggregate and deposit on the surface of stationary SiO2 microspheres. However, the asymmetrical profile of the spectra also indicates that a small number of Ag/ SiO2 nanoparticles need a longer time to go through the column due to the variation of particle size, as related to the principle in chromatography that smaller particles tend to take more time to elute.24 This could be an indication that a few doublet, triplet, or even larger clusters were formed in the washing process along with individual Ag/SiO2 nanoparticles. Figure 5 shows the morphology of Ag/SiO2 nanoparticles washed by the HPLC method. According to the UV-vis analysis from 200 to 600 nm, the Ag/SiO2 nanoparticles were free of surfactant within instrumental detection limits because
4682 J. Phys. Chem. B, Vol. 110, No. 10, 2006
Wang et al.
Figure 5. Morphology of Ag/SiO2 nanocomposites ethanol/water (7:3 vol) suspensions washed with HPLC. Digital images: suspension A, R ) 2, H ) 100, X ) 1, D50 ) 30 nm, SD ) 1.2 nm. Suspension B, R ) 8, H ) 300, X ) 1, D50 ) 20.3 nm, SD ) 1.5 nm. (with 95% confidence interval). TEM images show the size, core-shell architecture and state of dispersion of the suspensions A and B.
the characteristic 280 nm absorption band for Igepal CO-520 is not present. The zeta potential, +30 mV, firmly indicates robust surface grafting with APS even after the HPLC washing. The average size of the Ag/SiO2 nanocomposite particles remains the same as determined by TEM prior to the HPLC washing, with a Ag core of 5 ( 0.6 nm and overall diameter around 30 ( 1.2 nm (R ) 2, H ) 100, X ) 1). An average size of 20.3 ( 1.5 nm is observed for R ) 8, H ) 300 and X ) 1 after HPLC washing. Besides the individual nanoparticles, nanoscale clusters formed by two, three, or four particles were also observed in HRTEM. Aggregates with continuous interparticle connections are not found. This implies that the HPLC method breaks the nanoparticulate aggregates down to a size that allows the nanoparticles to penetrate through the interstitial channels of the HPLC column. These observations support the conclusions drawn from the previous HPLC spectral analysis. An AFM image of Ag/SiO2 ethanol/water suspension (R ) 2, H ) 100, X ) 1) spin-coated onto a freshly cleaved mica substrate is shown in Figure 6. At a spin rate of 1500 rpm, nanoparticles were found sparsely distributed on the surface of mica. Further analysis indicated that the mean particle size is around 60 nm, which gives an average agglomeration number of about 2 if the particle size of 30 nm in HRTEM was taken as the primary unit. Furthermore, the Ag/SiO2 suspension treated with HPLC turned out to be very stable as experimentally confirmed by sedimentation tests over a span of one month. The state of dispersion of Ag/SiO2 ethanol/water suspension was determined by the DLS method. The hydrodynamic size distribution of the Ag/SiO2 nanocomposite particles is presented in Figure 7 (R ) 8, H ) 300 and X ) 1). An average size of 18.6 ( 1.5 nm was found for the Ag/SiO2 nanocomposite particles with a relatively narrow monomodal distribution. The light scattering result is in agreement with the particle size measured by TEM (20.3 ( 1.5 nm). The AAN (average agglomeration number, which is defined as the following: AAN ) (d1/d2)3, where d1 and d2 are the average particle size determined by DLS and TEM analysis, respectively) for the
Figure 6. AFM images of Ag/SiO2 nanocomposites (R ) 2, H ) 100, X ) 1) suspension obtained with the HPLC washing. Images obtained by Tapping Mode. The samples were prepared by placing a drop of the Ag/SiO2 ethanol/water suspension on a freshly cleaved mica substrate and spin coat at 1500 rpm for 30 s. The 3D image shows the aggregate size about 60 nm, Z scale is 21.36 nm/div.
Figure 7. Particle size distribution of Ag/SiO2 nanocomposites (R ) 8, H ) 300, X ) 1) measured by DLS and TEM image analysis. D50 ) 18.6 nm, SD ) 1.5 nm for DLS, the particle size from TEM image analysis is 20.3 ( 1.5 nm (30 particles were counted). Note the close match between DLS and TEM analysis.
HPLC washed sample is around 1.0.8,25 Thus, Ag/SiO2 nanocomposite particles are well dispersed in ethanol/water cosolvent after HPLC washing, because light scattering is more precise in revealing the aggregate size distribution for a colloidal
Dispersion of Ag/SiO2 with HPLC
J. Phys. Chem. B, Vol. 110, No. 10, 2006 4683
TABLE 1: Silane Coupling Agents for Surface Modification of SiO2-Based Particles name
structure
pH window
remarks
references
3-aminopropyltrimethoxysilane (APS)
H2NC3H6Si-(OCH3)3 (or OC2H5)
2.0-9.0
modify the surface of SiO2
3-aminopropylsilsesquioxane 3-glycidoxypropyltrimethoxysilane (GPS) Trimmethoxysilylpropyldiethylenetriamine (DETA) 3-trimethoxysilyl propylsuccinic anhydride
(H2N)8(CH2)24-O12Si8
2.0-6.5
surface coating of SiO2 and Ag modify SiO2 surfaces surface coating of SiO2 surfaces coating of SiO2
Plueddemann22 Mulvaney27 Mann28 Caruso29
H2NC6H11O2-Si(OCH3)3
8.0
Schmidt30 Tan31 Hemplemann32
suspension than TEM.26 The consistency between DLS data and TEM size analysis indicates that the hydrodynamic effect is compressed, which reflects the presence of ions in the asprepared suspension.4 Determination of ionic strength in suspension is essential for further investigation to understand the mechanisms of HPLC dispersion.3 3. APS Grafting. Silane coupling agents are frequently used to modify the surface of silica-based particles. Table 1 summarizes some of the silane coupling agents utilized for a number of applications.27-32 APS is one of the most widely used silane coupling agents. The effectiveness of the APS surface grafting is illustrated in Figure 8. Ag/SiO2 nanoparticles without an APS coating have a small negative zeta potential when pH is higher than pH 2 in ethanol/water solutions.33 The zeta potential curve becomes flat with a plateau that is reached above pH 7.0 at a maximum value of about -30 mV. However, the APS-grafted SiO2 nanoparticles have a relatively high positive surface charge. In the acidic region below pH 7.0, the APS-coated Ag/SiO2 nanocomposites show zeta potentials as high as 30 mV, but a pronounced effect by APS concentration on surface charge is not observed. By contrast, the SiO2 microspheres exhibit a noticeable increase of zeta potential when the APS concentration reaches 1.5 w/o (Figure 9). This is likely due to the high surface area (425 m2/g) and the nature of the SiO2 microsphere
surfaces associated with their manufacturing procedures. A detailed discussion of the graft mechanism can be found elsewhere.22,27,32,34,35 A surface reaction takes place between APS and SiO2 to form a chemical bond. Exclusively desired was the resulting configuration in which the amine group tail is oriented toward the solvent and protonates at pH < 7.0, giving a positively charged surface.22,27 The zeta potential measurements indicate that the surface charge for the treated samples is positive at pH < 7.0. A further decrease in pH to below pH 6 rapidly increases zeta potential to a plateau value of around +30 mV, supporting this interpretation. The importance of surface grafting of both Ag/SiO2 nanocomposites and SiO2 microspheres with APS can also be seen from Figure 10, which shows the AFM image of the untreated SiO2 microsphere surface after HPLC washing. The HPLC column was easily blocked in the washing process prior to surface grafting of Ag/SiO2 with APS. This can be explained if the surface morphology revealed in Figure 10 is taken into account. A three-dimensional (3D) top view of the silica microsphere indicated that the previously smooth surface was significantly compromised due to the interaction with Ag/SiO2 nanocomposite particles. The morphology of silica microspheres prior to the HPLC washing was uniformly spherical with a very low surface roughness according to SEM (Figure 3) and AFM
Figure 8. Zeta potential of Ag/SiO2 nanocomposites (R ) 2, H ) 100, X ) 1) ethanol /water suspensions as a function of pH and APS concentration (w/o ) percentage with respect to overall solids). Note the conversion of negative to positive charge after the addition of APS. The pHs of the suspensions were measured using a Sentron pH meter calibrated against standard aqueous buffer solutions. Error bars are the 95% confidence interval.
Figure 9. Zeta potential of SiO2 microspheres as a function of pH and APS concentration (w/o ) percentage with respect to overall solids). The average size of SiO2 is 20 µm with a surface area of 425 m2/g and 6.5 nm average pore size. The SiO2 microspheres were dispersed in ethanol/water (7:3 vol) solution. The pHs of the suspension were measured by a Sentron pH meter calibrated against standard aqueous buffer solutions. Error bars are the 95% confidence interval.
4684 J. Phys. Chem. B, Vol. 110, No. 10, 2006
Figure 10. AFM image of Ag/SiO2 nanocomposites (R ) 2, H ) 100, X ) 1) aggregation formed on the surface of a SiO2 microsphere. APS surface coating only applied to Ag/SiO2 nanocomposites (average size 30 nm); the SiO2 were used without further treatment (average size 20 µm, image in inset). SiO2 particles from a blocked HPLC column were placed on a freshly cleaved mica substrate. Z scale is 900.0 nm/div.
observations (Figure 10). However, the surface was fouled during HPLC washing, and aggregates of Ag/SiO2 nanocomposite particles were observed to adhere to the surface of the large silica spheres. One of the aggregates on the silica microsphere was about 0.5 µm across, and must have therefore consisted of at least 150 individual nanocomposite particles if the primary particle size is 30 nm. There are a number of mechanisms for the aggregation of Ag/SiO2 nanocomposites on the surface of SiO2 microspheres. However, the Coloumbic interaction between APS-grafted Ag/SiO2 nanocomposites and negatively charged SiO2 microspheres significantly impacts the evolution of aggregates. As the HPLC washing was carried out in weak acidic pH regime (pH 5.0-7.0), the nanocomposites gain positive charge because of the APS coating, while SiO2 microspheres were negatively charged in this pH range.33,36 The nanocomposites deposit on the SiO2 stationary phase unless they are treated to bear like charge. This is very likely the mechanism of the blocked column that caused the initial washing and collection attempts with HPLC to fail. Therefore, the same surface grafting was applied to SiO2 microspheres to control the surface potential and thereby eliminate particle agglomeration. This is a critical step for HPLC washing of Ag/SiO2 nanocomposite particles based on size exclusion chromatography. Stable suspensions of Ag/SiO2 nanocomposite particles in ethanol/water solvent were routinely produced once this principle was precisely followed. 4. Washing Solvent. In addition to the surface modification with APS for both mobile and stationary phase, the selection of a proper extraction solvent is also critical to successful operation. The Ag/SiO2 nanocomposites remain clustered in the upper part of the HPLC column when DI water, pure anhydrous ethanol, 2-propanol, and acetone solvents were used. When an ethanol/water cosolvent (ethanol/water ) 7:3 vol) was pumped in, the clusters started to migrate downward and eventually elute out of the column.37 The mechanism for this experimental observation is not known at present. However, it is proposed that the ability of the surfactant to dissolve in the solvent is critical. Poor solvents for the surfactant lead to agglomeration because of phase separation. A series of recent reports by
Wang et al.
Figure 11. Effect of pH on the state of dispersion for Ag/SiO2 nanocomposites ethanol/water suspensions (R ) 8, H ) 300, X ) 1). The TEM images were taken by placing a drop of the suspension on a lacy carbon grid and dried at 25 °C. Note the dissolution of SiO2 shell at pH 9.7 which gives rise to the bimodal distribution.
Velegol, Cole, and co-workers regarding the van der Waals forces among nanoparticulates also provides support that the mixed solvent system is important if not essential in achieving well-dispersed nanocolloids. It has been proposed that the solvent molecules sequester near the solid-solution interface, creating additional interaction energy to maintain dispersion in mixed solvent systems.38 The theoretical predictions in this series of articles, particularly the article directed toward mixed solvent systems,38c are consistent with the experimental findings in the current study that 7:3 ethanol/water system produces the easiest processing pathway to dispersion of the nanocomposite colloids. 5. Suspension pH. Suspension pH is another critical parameter that must be controlled in preparing well-dispersed Ag/ SiO2 nanocomposite colloids. This is illustrated in Figure 11. At pH 2.8, the Ag/SiO2 nanocomposite suspension shows considerable aggregation based on the TEM and DLS analyses, and the AAN is about 15 due to the bimodal particle size distribution. In the alkaline regime with a measured pH of 9.7, the dissolution of SiO2 shell leads to the formation of Ag metal core contact and a small particle size.33 The poorly dispersed suspension shows an AAN of 0.02, which illustrates the damage to the nanocomposite architecture by the elevated pH solution. A well-dispersed Ag/SiO2 nanocomposite suspension can be obtained when the pH is adjusted to around pH 6.0. DLS data of this sample suggests that the particle size distribution is monomodal, which is consistent with the TEM analysis. The corresponding AAN is around 1, indicating a well-dispersed suspension under pH 6.0. 6. Column Length. One of the parameters that affects the efficiency of HPLC washing is the length of the column. More washing solvent and time are required for a longer length of column. Three types of HPLC columns with specific size dimensions were studied; columns HR 16 (16 mm × 500 mm) and HR 10/10 (10 mm × 100 mm) were too long for the Ag/ SiO2 nanocomposites to elute. In contrast, the short column HR 5/5 (5 mm × 50 mm) is suitable for Ag/SiO2 dispersions. The total accessible pore volume (V) to a nanoparticle with
Dispersion of Ag/SiO2 with HPLC
J. Phys. Chem. B, Vol. 110, No. 10, 2006 4685
size R0 can be expressed by eq 124
(5) Shchukin, D. G.; Sukhorukov, G. B. AdV. Mater. 2004, 16, 671682. (6) Velikov, K. P.; Moroz, A.; Blaaderen, A. Appl. Phys. Lett. 2002, 80, 49-51. (7) Schiffrin, D. J. MRS Bull. 2001, 12, 1015-1019. (8) Wang, J.; White, W. B.; Adair, J. H. J. Am. Ceram. Soc. 2006, in press. (9) Zsigmondy, R.; Spear, E. B. The Chemistry of Colloids; John Wiley & Sons: New York, 1917. (10) Kimel, R. A. Aqueous Synthesis and Processing of Nanosized Yttria Tetragonally Stabilized Zirconia. Ph.D. Thesis, The Pennsylvania State University, May 2002. (11) Hawkins, J. M.; Lewis, T. A.; Loren, S. D.; Meyer, A.; Heath, J. R.; Shibato, Y.; Saykally, R. J. J. Org. Chem. 1990, 55, 6250-6252. (12) Cox, D. M.; Behal, S.; Disko, M.; Gorun, S. M.; Greaney, M.; Hsu, C. S.; Kollin, E. B.; Millar, J.; Robbins, J.; Robbins, W.; Sherwood, R. D.; Tindall, P. J. Am. Chem. Soc. 1991, 113, 2940-2944. (13) Li, T.; Moon, J.; Morrone, A. A.; Mecholsky, J. J.; Talham, D. R.; Adair, J. H. Langmuir 1999, 15, 4328-4334. (14) Adair, J. H.; Li, T.; Kido, T.; Havey, K.; Moon, J.; Mecholsky, J. J.; Morrone, A. A.; Talham, D. R.; Ludwig, M. H.; Wang, L. Mater. Sci. Eng. Rep. 1998, 23, 139-242. (15) Arriagada, F. J.; Osseo-Asare, K. J. Colloid Interface Sci. 1999, 211, 210-220. (16) Arriagada, F. J.; Osseo-Asare, K. Colloids Surf., A 1999, 154, 311326. (17) Osseo-Asare, K.; Arriagada, F. J. J. Colloid Interface Sci. 1999, 218, 68-76. (18) Bae, D. S.; Han, K. S.; Adair, J. H. J. Mater. Chem. 2002, 12, 3117-3120. (19) Fendler, J. H. Chem. Mater. 1996, 8, 1616-1624. (20) Caruso, F. AdV. Mater. 2001, 13, 11-22. (21) Nooey, R. I.; Thirunavukkarasu, D.; Chen, Y.; Josephs, R.; Ostafin, A. E. Langmuir 2003, 19, 7682-7637. (22) Plueddemann, E. P. Silane Coupling Agent; Plenum: New York, 1982; pp 29-48. (23) Adair, J. H.; Rouse; S. M.; Wang, J.; et al. Unagglomerated Core/ Shell Nanocomposite Particles. U.S. Patent Application No. 60/575887, 2004. (24) Meyer, V. R. Practical High-performance Liquid Chromatography, 3rd ed.; John Wiley & Sons: New York, 1998. (25) Adair, J. H.; Roese, A. J.; McCoy, L. G. AdVances in Ceramics, 111; The American Ceramic Society: Columbus, OH, 1984; pp 142-156. (26) Allen, T., Ed. Particle Size Measurement, 2nd ed.; Powder Sampling and Particle Size Measurement, Vol. 1; Chapman & Hall: New York, 1997. (27) Ung, T.; Liz-Marzan, L. M.; Mulvaney, P. Langmuir 1998, 14, 3740-3748. (28) Hall, S. R.; Davis, S. A.; Mann, S. Langmuir 2000, 16, 14541456. (29) Cassagneau, T.; Caruso, F. AdV. Mater. 2002, 14, 732-736. (30) Csogor, Z.; Nacken, M.; Sameti, M.; Lehr, C. M.; Schmidt, H. Mater. Sci. Eng. C 2003, 23, 93-97. (31) Santra, S.; Zhang, P.; Wang, K.; Tapec R.; Tan, W. Anal. Chem. 2001, 73, 4988-4993. (32) Beck, C.; Hartl, W.; Hemplemann, R. Angew. Chem., Int. Ed. 1999, 38, 1297-1300. (33) Iler, R. K. The Chemistry of Silica; John Wiley & Sons: New York, 1979. (34) Chiang, C. H.; Ishida, H.; Koenig, J. L. J. Colloid Interface Sci. 1980, 74, 396-403. (35) Chiang, C. H.; Liu, N. I.; Koenig, J. L. J. Colloid Interface Sci. 1982, 86, 26-34. (36) Abendroth, R. P. J. Phys. Chem. 1972, 76, 2547-2549. (37) Dixit, S.; Crain, J.; Poon, W. C. K.; Finney, J. L.; Soper, A. K. Nature 2002, 416, 829-832. (38) (a) Calbi, M. M.; Gatica, S. M.; Velegol, D.; Cole, M. W. Phys. ReV. A 2003, 67, 0332011-0332015. (b) Gatica, S. M.; Calbi, M. M.; Cole, M. W.; Velegol, D. Phys. ReV. B 2003, 68, 2054091-2054098. (c) Gatica, S. M.; Cole, M. W.; Velegol, D. Nano Lett. 2005, 5, 169-173.
V ) π(Rp - R0)2(L - R0)
(1)
where Rp is the pore radius, and L is the pore length. For Ag/ SiO2 nanocomposites, the condition L . R0 is satisfied, and the total volume V is proportional to L. Hence, larger pore length L increases the washing time. For instance, assuming the pores are composed of octahedral interstices, Rp is 4.1 µm (0.414 of the radius of SiO2 microsphere), and R0 is 20 nm for Ag/SiO2 nanocomposites. Using eq 1, the estimated pore volume V is 2.7 × 10⁻⁵ mL for L ) 500 mm (HR 16 column, assuming that the octahedral interstices form straight channels) and 2.7 × 10⁻⁶ mL for L ) 50 mm (HR 5/5). Therefore, the washing time for a long-length column (L ) 500 mm) is approximately an order of magnitude higher than that of short-length column (L ) 50 mm). Conclusions The silane coupling agent APS effectively reacted with Ag/ SiO2 nanocomposite particles, thereby increasing the surface charge of Ag/SiO2 nanoparticles to ensure that the Ag/SiO2 nanocomposite particles can diffuse through the positively charged spherical SiO2 stationary phase matrix during HPLC operation. This size exclusion chromatography approach eliminates agglomeration and deposition of Ag/SiO2 nanocomposite on the silica microspheres. Therefore, elute dispersion generated by the HPLC method demonstrates excellent homogeneity and stability with the zeta potential up to +30 mV. The resulting ethanol/water suspension is an ideal precursor for colloid chemistry-based “bottom-up” nanoscale assembly for macroscopic devices. Processing parameters such as surface modification of both mobile and stationary phases, solvent, suspension pH, and column dimension are of great importance to the HPLC dispersion. In the separation process, this approach could be extended to many similar nanoparticulate systems where surfactant-free dispersion is a major concern. Acknowledgment. This project was supported by NASA under Contract No. NAG8-1675, the Ben Franklin Technology Partnership Center of Excellence in nanoparticulates, and the NSF Particulate Materials Center (PMC) at the Pennsylvania State University. Dr. Rafaat Malek is acknowledged for his help with AFM work. References and Notes (1) Liz-Marzan, L. M.; Giersig, M. Low-dimensional Systems: Theory, Preparation, and Some Applications; NATO Science Series Vol. 91; Kluwer Academic Publisher: Boston, 2003. (2) Fendler, J. H. Nanoparticles and Nanostructured Films; WileyVCH: New York, 1998. (3) Wu, K. L.; Lai, S. K. Langmuir 2005, 21, 3238-3246. (4) Hiemenz, P. C.; Rajagopalan, R. Principles of Colloid and Surface Chemistry, 3rd ed.; Marcel Dekker: New York, 1997.