laptop PC) at a resolution of 1024 x 768, the maximum for the projector. ... computer models leading to the landscape being rated as far more dynamic, even ...
Display Methods for Real-Time Landscape Models: An Initial Comparison Katy APPLETON and Andrew LOVETT
1
Introduction
Due to continuing improvements in available hardware and software, interactive, real-time landscape models are becoming a more viable proposition both for landscape professionals involved in communication and decision-making, and researchers investigating perceptions, opinions and responses to landscape issues (LOVETT et al., 2002; STOCK & BISHOP, 2002). The prime forces behind the development of many of these techniques, in whole or in part, are military users and industries such as aerospace and automotive engineering, oil and gas exploration, and of course entertainment. Their demands have led to sophisticated viewing methods being developed alongside software and hardware, including head-mounted displays, multi-sided “caves”, and screen shapes including curved planes and spherical segments, any of which may be further enhanced by the use of stereography (KASIK et al., 2002). Such non-traditional viewing equipment is often marketed as providing a more immersive experience, thereby implying that the viewers’ experience and understanding will be better. When undertaking environmental decision-making exercises based on computerised landscape models, it is of considerable importance to be aware of any potential differences introduced by the way in which the information was displayed to the audience, yet little such information exists at present. Research on the effects of using different kinds of graphics displays has focused to date on the ability of viewers to complete a particular task such as wayfinding or component recognition (e.g. SWINDELLS et al., 2004, KASIK et al., 2002), but landscape research and environmental decision-making usually involve audience perceptions and other more subjective assessments of the information on display. RICE (2003) examined audience perceptions of an urban campus design comparing a hemispherical screen display to a physical scale model and a real-life walkthrough, but much of the information gathered was more relevant to aspects of the built environment than the large natural or semi-natural areas usually considered in environmental decisionmaking (e.g. the balance between ceiling and walls, or plants and paving). It was therefore decided to assess the effects of using one such piece of non-traditional display equipment, a 1.5m diameter spherical section screen (Elumens Vision Station: http://www.elumens.com), to show a real-time interactive landscape model of a relatively large area.
K. Appleton and A. Lovett
2
2
Data & Methods
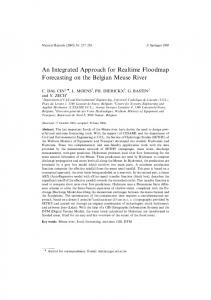
2.1 Input Data The landscape model employed in this study is a 2 x 3 km area in the Humberside region of England (Figure 1). It consists of a flat, floodplain area, a wide river (the Trent) constrained by embankments, a small village (East Butterwick), and scattered farms among arable fields. This area was chosen primarily for the ready availability of geographic data and landscape models from ongoing work on climate change scenarios. GIS data provided the base for the visualisations. A 10m resolution elevation model (Ordnance Survey Profile® data) was used with land use information derived from Ordnance Survey MasterMap® and fieldwork. Land use data showed the layout of fields, water, buildings and built-up areas as well as the location of a set of electricity pylons. Crop information was not contained within the OS data, but was derived to a basic level from aerial photography online at Multimap (http://www.multimap.com). While crops could not be reliably identified, the distribution of different vegetation (e.g. cereals, root crops or bare earth) could at least be discerned and a “best-guess” label given to each field.
Fig. 1: Location and detail of the area for the landscape model
2.2 Landscape Model The model was constructed using Visual Nature Studio version 2 from 3DNature (http://www.3dnature.com), with the additional Scene Express real-time export extension. GIS files were imported, and visual properties assigned to all landscape features; as only a low-detail model, suitable for real-time display, was to be produced, less effort was required than for a full-detail still rendering or animation. Buildings were shown using simple extrusions with flat roofs instead of importing full 3D geometry; the river was represented by a bluish-grey flat colour on the land surface, rather than simulated water with reflectivity, transparency and rippled surface; and instead of many individual items of
Display Methods for Real-Time Landscape Models: An Initial Comparison
3
crop vegetation, procedural textures were used to represent land cover types. Labels (tall “billboards” anchored to a specific surface point) were used to inform viewers of the field contents as well as to identify points of interest (the river, village, specific farms). The landscape has few trees, but a set of three distinctive poplars were included, and trees were also included in the “village” area As the 10m resolution of the elevation data was insufficient to show the river embankments and field ditches, these were added in at the visualisation stage using the “Terraffector” feature in VNS. This allows for local terrain modification according to a user-defined elevation profile, applied symmetrically along a vector. In preparation for export to real-time format, a number of pre-set fixed and animated cameras were set up. These comprised an overhead view, a circling camera at an altitude of approximately 500m, a stationary ground level view, and a panning ground level view. Such cameras give an alternative overview of the model for viewers who do not wish to navigate interactively.
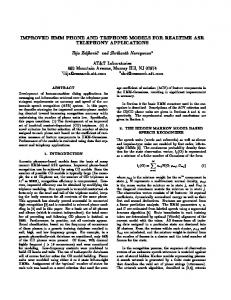
Fig. 2
Screenshots giving an overview of the landscape model used.
3DNature’s own NatureViewExpress format was used to export and view the landscape model. This was chosen for ease of export and the speed of interaction; it was run on both a
K. Appleton and A. Lovett
4
laptop (2.8GHz, 1Gb RAM, 64Mb video card) and desktop (2.8GHz, 1Gb RAM, 256Mb video card) with no problems. Screenshots of the landscape model used can be seen in Figure 2. The landscape model was exported with a terrain resolution of approximately 2.5m and a drape image resolution of around 1.5m. These settings are the primary determinant of the resulting file sizes; the total archive, including elevation files, drape images, foliage images, and 3D object files as well as the main model file, was approximately 56Mb. As an example, halving the resolution of both the terrain and the drape image leads to a total size of 30Mb.
2.3 Display Methods Three display methods were compared: •
• •
A set of six images, screenshots of the real-time model, laser printed in colour on three sheets of A4 paper. The set comprised two high-level, two medium-level, and two ground-level views. The NatureViewExpress model running on a 17” flat (TFT) monitor (via a desktop PC) at a resolution of 1280 x 1024. The NatureViewExpress model running on a 1.5m Elumens Vision Station (via a laptop PC) at a resolution of 1024 x 768, the maximum for the projector.
In the case of the NatureViewExpress models, the setup was identical for both display methods. Control is via the mouse and keyboard, and participants were given oral and written instructions on using both pre-set cameras and interactive navigation.
2.4 Surveys Experimental sessions were run over four days; two of these were in the foyer area of the School of Environmental Sciences at UEA, and two were in the Virtual Reality Suite within the department. Advertising took place throughout the school via e-mail and posters, and participants were able to pre-book or simply turn up. Seventy-one people participated in the survey. In order to keep participation time short, only eight responses were requested for each display method, with a further four demographic questions (age, sex, familiarity with computers, familiarity with computer games) and space for comments if desired. The main questions were, for each display method: •
•
“To what extent does this model/viewer combination allow you to imagine the real landscape?” (using a rating scale of 1-9, where 1 = not at all, and 9 = very well). Six adjective pairs, also on a 1 to 9 scale (the adjective at the lower end of the scale is named first in each pair): beautiful/ugly; cramped/spacious; simple/complex; interesting/boring; static/dynamic; attractive/unattractive. The adjectives were chosen from KASMAR’s (1970) lexicon.
Display Methods for Real-Time Landscape Models: An Initial Comparison
•
3
5
The order in which the method was seen (first/second/third).
Results
Participants found the landscape easier to imagine using either of the two computer methods than with the prints (p < 0.01, Kruskal-Wallis H test), but there was no significant difference between the computer displays, each having a median rating of 7 compared to 4 for paper. Figure 3 shows the distribution of responses for each method. It can be seen that the results for the visualisation dome are slightly more skewed to the high end of the scale than those for the flat screen, but not significantly so. Both computer methods also have a small tail of results at the low end, indicating a small number of viewers were dissatisfied with the model shown.
Fig. 3
Participants’ ability to imagine the real landscape, split by display method
This result implies that the larger curved screen gave little or no benefit over a conventional flat screen in terms of the viewer’s ability to understand the information presented and picture the landscape in a holistic sense. In fact, participants’ comments indicated a variety of opinions on the three methods, not all of which can be reflected in the simple rating scale used. Some positively enjoyed the novelty of the visualisation dome, while others appreciated the familiarity of the flat screen and paper images. A number reported a greater sense of immersion or “being there” when using the dome, while for several others the size of the screen and the closeness of the viewing position made the experience uncomfortable and even led to feelings of motion sickness in some cases. The relatively low resolution of the projector compared to the monitor was noted by some as a disadvantage, as was the
6
K. Appleton and A. Lovett
distortion of the projected image, and the fact that the central desk obscures part of the display, including in this software the viewer orientation/location map. Some of these problems could be addressed by technical changes such as a higher resolution projector, and software changes including a different screen layout and incorporating spherical geometry correction, but others are limitations of the equipment, with a great deal being down to individual preferences. There is no doubt that an additional benefit of the dome is generating interest in whatever you wish to present to people; while conducting the survey in the foyer, many survey respondents were students and staff who had been intrigued by the equipment while passing by. Figure 4 shows the effects of display method on the six adjective pair ratings scales. As with the participants’ ability to imagine the real landscape, it is the paper information which gives a significantly different result in each case (Kruskal-Wallis H test, p < 0.01 for all except attractive/unattractive, p < 0.05), with the two computer methods not differing from each other sufficiently to be significant. In general, from viewing the printed information, participants rated the landscape as uglier, more cramped, simpler, more boring, more static, and less attractive. Perhaps not unexpectedly, the largest difference between paper and electronic methods occurred on the static-dynamic scale, with the computer models leading to the landscape being rated as far more dynamic, even though there are no moving elements such as trees blowing in the wind, flowing water, or people and vehicles travelling. Only the viewer’s location changes, although technology increasingly offers the opportunity for animated elements within a scene, and this would be an aspect worth revisiting.
Display Methods for Real-Time Landscape Models: An Initial Comparison
7
Fig. 4 Ratings on the six adjective scales, split by display method. Boxes show the mean rating, and the bars indicate the 95% confidence interval above and below the mean. Examination of participants’ responses with regard to the order in which they viewed the three methods revealed no consistent effect, although the split between all six possible viewing orders was not particularly even due to “drop-in” participants preferring to view the methods as others finished rather than waiting to proceed in a specific order. Several respondents made comparisons between the methods, but any noted good or bad points were largely consistent across all possible viewing orders. The demographic and background information collected was simple, and again no consistent pattern was observed in terms of the impact on participants’ ratings of the three viewing methods.
4
Conclusions & Outlook
It is interesting that this survey, admittedly a relatively small one, indicates little difference between a conventional flat-screen monitor and a moderately sized visualisation dome in terms of communicating information to viewers about the nature and certain qualities of a landscape. The equipment is expensive, with a visualisation dome of this size costing well over ten times as much as a relatively high-specification PC, and it is logical to assume that there must be certain expectations on the part of those who buy it about the effects of using it. However, the research literature reveals no real qualitative information on the benefits of using such equipment. While some people clearly do find this sort of display beneficial, and there are undoubted advantages in terms of engaging people’s interest, sufficient drawbacks were noted that care is advised in using a dome, at least in considering the setup and the configuration of the landscape display. However, the results also suggest that a flat screen could be set up as an alternative/additional display point with little impact on the responses of viewers who saw one or the other. The differences noted in Figure 4 suggest that caution is necessary if different groups within a consultation exercise are presented with different information, for example if meeting attendees can view a real-time landscape model while non-attendees are sent printed images. Questions about the acceptability of a particular landscape future could clearly be affected by the differences in perception, and the results in this paper indicate that equivalence of information cannot be assumed across paper prints and real-time information. In particular, the matter of a landscape’s perceived attractiveness is of great importance in determining audience approval, although it is acknowledged that aesthetics is just one of several aspects of any future landscape scenario which might be presented, alongside biodiversity, natural resource and socio-economic considerations. In this study, the objective was to compare display methods using identical information, which is why the paper-based images were simply screenshots of the interactive model. However, one previously-noted strength of non-interactive information is that greater detail can be incorporated (APPLETON et al., 2002). An extension to this research would therefore be to include more detailed visualisations of the area, either on paper or as still
K. Appleton and A. Lovett
8
images on a computer screen, and obtain ratings to determine any difference in preferences and perceptions between more realistic images from a limited number of viewpoints, and the ability to explore a more abstract model at will. It must be said that the landscape model used here represents an area which is by nature quite open and not very complex, nor would it be considered particularly attractive according to commonly accepted theories of landscape aesthetics. An interesting further step would be to assess a range of landscape types and see whether the effects described above are consistent. Finally, a very desirable addition would be to include further methods of communicating landscape information. The department’s Virtual Reality laboratory contains a large (2 m × 5 m) screen, and to use this would be an obvious extension, giving yet another sense of scale. Another practical progression would be to actually visit the landscape in question, as was done by RICE (2003). The distance to the study area in this case prevented such a visit, but to compare visualisations of any kind to real life experiences is perhaps the most important extension to this sort of work, and the one which will allow the effects of different presentation methods to be most fully quantified.
5
References
Appleton, K. Lovett, A., Sünnenberg, G., Dockerty, T. (2002), Visualising Rural Landscapes From GIS Databases: a comparison of approaches, options and problems. Computers, Environment and Urban Systems, Vol. 26, No. 2-3, pp 141-162. Kasik, D. J., Troy, J. J., Amorosi, S. R., Murray, M. O., Swamy, S. N. (2002), Evaluating Graphics Displays for Complex 3D Models, Computer Graphics and Applications Vol. 22, No. 3 (May/June 2002), pp. 56-64 Kasmar, J. V. (1970), The development of a usable lexicon of environmental descriptors, Environment and Behaviour, September 1970, pp. 153-169 Lovett, A., Sunnenberg, G., Appleton, K., Dockerty, T., Dolman, P.M., Cobb, D. & O’Riordan, T. (2002) The use of VRML in landscape visualisation, in Buhmann, E., Nothhelfer, U., and Pietsch, M. (eds.) Trends in GIS and Virtualization in Environmental Planning and Design. Heidelberg: Wichmann Nelson, L., Cook, D., and Cruz-Neira, C. (1999), XGobi vs. the C2: Results of an Experiment Comparing Data Visualization in a 3-D Immersive Virtual Reality Environment with a 2-D Workstation Display, Computational Statistics Vol. 14, No. 1 (January 1999), pp. 39-51 Rice, A. (2003), Exploring the Impact of Emerging Landscape Visualisation Tools on Spatial Perception and Design Education, in Buhmann, E., Ervin, S. (eds.), Trends in Landscape Modeling, Heidelberg: Wichmann Stock, C., Bishop, I. D. (2002), Immersive, Interactive Exploration of Changing Landscapes, Proceedings, iEMSs 2002, pp30-35; http://www.iemss.org/iemss2002/proceedings/pdf/volume%20uno/40_stock.pdf