Estuaries Vol. 23, No. 2, p. 188-198
April 2000
Dissolved Silicate Dynamics of the Rhode River Watershed and Estuary DAVIDL. CORRELL' THOMAS E. JORDAN DONALD E. WELLER Smithsonian Environmental Research Center Smithsonian Institution Edgewater; Maryland 21 037 ABSTRACT: We continuously measured dissolved silicate concentrations and fluxes discharged from various Rhode River subwatersheds for a period of 14 yr from 1984 to 1998 and for 15 mo in 1971-1972. We also measured dissolved silicate concentrations along a transect from the head of the tide in Rhode River estuary to Chesapeake Bay. The average concentration of dissolved silicate discharged from the Rhode River watershed was 10.8 mg Si I-'. There were consistent and significant differences in silicate concentrations discharged over time and space among subwatersheds. Mean annual silicate flux from the watershed was 26.6 kg Si ha-' and 93% of this occurred during the winter and spring seasons. There were large interannual variations in silicate flux, due primarily to differences in precipitation and water discharge, rather than silicate concentration. Land use had little or no effect on silicate flux from various subwatersheds. Silicate concentrations discharged from a subset of subwatersheds in 1995-1996 were 25% to 35% lower than in a period with similar precipitation in 1971-1972. Mean annual concentrations of silicate discharged from nine subwatersheds have been declining about 1.5% yr-I or by 0.21-0.26 mg Si 1-' yr-I over the last 25 yr. Despite high average silicate fluxes from the watershed, at times the Rhode River estuary developed low dissolved silicate concentrations, which could have been limiting to the growth of diatoms. Examples were in the spring after a winter with low watershed discharge (as low as 0.019 mg Si I--' in 1995) and after protracted drought (as low as 0.041 mg Si 1-' in 1993).
changed phytoplankton species composition seems to be fairly common in both freshwater and marine ecosystems but has not been widely studied. DSi concentrations may be reduced seasonally due to diatom growth in natural waters. In small unshaded streams such as Canajoharie Creek in New York, diatom growth in the periphyton reduced DSi concentrations from 4 to 5 mg Si 1-' in the nongrowing season to one or less during the growing season (Wall et al. 1998). The effects of eutrophication on DSi dynamics in Chesapeake Bay were first noted by D'Elia et al. (1983), who found that DSi behaved nonconservatively in the summer and fall with concentrations sometimes declining as low as 0.028 mg Si 1-'. In the James, York, and Rappahannock Rivers (major tidal tributaries to Chesapeake Bay), DSi concentrations approach zero when large diatom blooms occur (Anderson 1986). These findings were further documented for Chesapeake Bay by Fisher et al. (1988, 1992) and Conley and Malone (1992). Similar DSi dynamics were also found in Delaware Bay (Sharpe et al. 1982), San Francisco Bay (Cloern 1996), Ochlockonee Bay, Florida (Kaul and Froelich 1984), the Bay of Brest (Ragueneau et al. 1994), and the Black and Baltic Seas (Conley et al. 1993). DSi in surface waters comes primarily from watershed discharges and regeneration from bottom
Introduction By weight, about 28% of the Earth's crust is composed of silicon, most of which is present as alkali and aluminum silicate minerals (Cotton and Wilkinson 1966). As these minerals undergo biogeochemical reactions, silicon is gradually released as ortho-silicate (Si0,-4), which is present as the undissociated silicic acid (H4Si04)at the pHs of most receiving waters (Hutchinson 1957). This dissolved silicic acid is commonly referred to as silicate and we follow that convention and use the abbreviation DSi. Phosphorus and nitrogen are widely accepted as the key elements that may become limiting to phytoplankton growth in aquatic systems (Ryther and Dunstan 1971; Likens 1972; Correll 1998). With the pervasive, world-wide occurrence of eutrophication of surface waters, caused by high levels of P and N (Carpenter et al. 1998), silicon has increasingly become a limiting element for the growth of diatoms and other silicon-requiring algae. This effect, first noted by Schelske and Stoermer (1971) in studies of Lake Michigan and reviewed by Conley et al. (1993), where DSi depletion led to
' Corresponding author: present address: 3970 Timucua Point N., Crystal, River, Florida 34428; tele: 352/5649137; email:
[email protected]. 0 2000 Estuarine Research Federation
188
Silicate Dynamics of the Rhode River
sediments. Laboratory studies of dissolution rates (weathering) of various minerals under various conditions (e.g., Holdren and Speyer 1986; Sverdrup and Warfvinge 1988), may not be relevant from a relatively short-term, non-geologic perspective. For example, in forests in eastern France, little silicon was found in plant biomass, but soils had 335,000 kg Si ha-' that was readily available for weathering, most in the form of soil biogenic silicate (Bartoli 1983). These deposits of non-crystalline, relatively easily dissolved material seem to be the immediate source of dissolved silicate in many watershed discharges. Watershed discharges include both DSi and particulate biogenic silicate. Some of this biogenic silicate may derive directly from the soils, but some also results from biological processes in streams and rivers. For the Rhode River, biogenic silicate constituted < 4% of the total silicate discharge, but some large rivers discharged as much as 74% of their total silicate as biogenic silicate (Conley 1997). Benthic regeneration of DSi has been inferred or measured in several ways. In the Rappahannock River estuary (Anderson 1986) and the Hudson River estuary (Clark et al. 1992), positive departures from conservative behavior in axial transects were used to infer significant summertime benthic releases, but insignificant releases in the nongrowing season. Benthic exchange chambers were used in Narragansett Bay (McCaffrey et al. 1980), the Bay of Brest (Ragueneau et al. 1994), and the Bay of Morlaix (Lerat et al. 1990) to measure mean rates of DSi release of 22, 1.9, and 1.1 mg Si m-' hr-l, respectively. On the Chesapeake Bay, both chambers and axial gradient analysis indicated that benthic regeneration exceeded riverine inputs of DSi by at least five-fold (D'Elia et al. 1983). What concentration of DSi is limiting for diatom growth in receiving waters? For Lake Michigan plankton assemblages enriched with phosphate and nitrate, silicate uptake ceased at about 0.023 mg Si 1-' (Schelske and Stoermer 1972). During diatom blooms, when DSi concentrations reach a minimum of about 0.014 to 0.028 mg Si lV1, the diatom bloom dissipates (e.g., Lerat et al. 1990; Conley and Malone 1992; Ragueneau et al. 1994). This paper examines DSi fluxes from the Rhode River watershed and their potential effect on the phytoplankton of the Rhode River estuary. We address the following questions: What are the effects of interannual variations in precipitation? Are there any measurable effects of land use? Does DSi concentration change with water discharge rate? Are the fluxes of DSi changing over time as a result of such factors as decreasing atmospheric deposition of acids?
189
Methods The watersheds studied are all subwatersheds of the Rhode River, a small tidal tributary on the midwestern shore of Chesapeake Bay in Maryland, U.S. (38"511N, 76'32'W) on the inner Atlantic Coastal Plain (Fig. 1). The watershed has sedimentary soils from the Pleistocene Talbot formation at low elevations on the eastern portion, Eocene Nanjemoy formation soils at low elevations further west, Miocene Calvert formation soils at intermediate elevations, and Pleistocene Sunderland formation soils at the highest elevations. The soils are fine sandy loams and the mineralogy of the soils is fairly uniform, with a high level of montmorillonite and quartz, intermediate levels of illite and kaolinite, and low levels of gibbsite, chlorite, potassium feldspar, and plagioclase (Correll et al. 1984). Bedrock is about 1,000 m below the surface, but the Marlboro Clay layer forms an effective aquiclude slightly above sea level throughout the watershed (Chirlin and Schaffner 1977), causing each subwatershed to have a perched aquifer and overland storm flows, interflow, and groundwater discharges move to the channel draining the subwatershed. The slopes of the subwatersheds average between 5% and 11% and the subwatersheds range in size from 6.1 ha to 1157 ha (Table 1). The subwatersheds also differed in land use from heavily rowcropped to completely forested (Table 1). For more detailed descriptions of the watershed see Correll (1981) and Correll and Dixon (1980). The Rhode River estuary is 550 ha in area and averages 2 m in depth, with a maximum depth of 4 m. The mean tidal range is 30 cm, and salinity varies from 0 % ~at the head of the estuary in spring to about 2 0 % ~at the mouth in fall during years of low rainfall. Mixing processes in the lower Rhode River are driven by changes in salinity in the surface layer of Chesapeake Bay (Han 1974) as in many subestuaries of Chesapeake Bay (Schubel and Pritchard 1986). From June 1984 through May 1998, discharges of water and DSi were measured from nine Rhode River subwatersheds with a total area of 2,050 ha (Table 1) or 62% of the total area of the Rhode River watershed. Discharges of water from 7 subwatersheds were measured with sharp-crested Vnotch weirs, whose foundations were in contact with the Marlboro Clay aquiclude (Correll 1977). All of these weirs were 120" notches, except for watershed 111, which was 150". Each weir had an instrument building and a stilling well. Depths were measured to the nearest 0.3 mm with floats and counterweights and were recorded every 5 min for subwatersheds 101, 109, 110, and 111 and every 15 min for subwatersheds 102, 103, and 108.
190
D. L. Correll et al.
Fig. 1. Map of the study area (38"511N,76"32'W). An inset shows the location of the Rhode River o n Chesapeake Bay. The Rhode River tidal axis is shown as a heavy dashed line with the distances marked in km from the head of the tide. Subwatersheds studied are marked and numbered (see Table 1) and the stream network and subwatershed boundaries are shown.
For DSi flux measurements, water samples were composited and volume-integrated for 1-wk intervals. Weekly fluxes were summed to obtain seasonal and annual fluxes (winter = December, January, February; spring = March, April, May; summer = June, July, August; fall = September, October, November). Until the summer of 1996, a Stevens, model 61R, flow meter actuated the sampling of an aliquot once every 154 m3 of flow on the second order streams and once every 77 m3 of flow on the first order streams. Beginning in the summer of 1996, a Cambell Scientific data logger (model CR10) was used to control volume-integrated sampling.
Subwatersheds 119 and 120 were tidally influenced at the locations where discharges were measured. Concrete 2.3 and 3.6 m-wide tidal flumes (for watersheds 119 and 120, respectively) with shallow V-shaped sills, were equipped with custom tide gauges, electromagnetic current meters (Marsh-McBirney model 711), and electronic interfaces which computed water flux and integrated it over time (Correll 1981). The current meter sensor was mechanically held in the middle of the water column by a linkage to the tide gauge. Water samples, of volumes proportional to water fluxes, were taken every 30 min. These samples were combined to produce volume-integrated (flow-weight-
TABLE 1. Characteristics of Rhode River subwatersheds. The Rhode River watershed is located at 38"511N,76"32'W. Land Cse' Watershed
Stream Order
Area' (ha)
% Forest
Correll 1977.
Until 1989 when it was planted in pine, Correll et al. 1995.
IRow Crops
% Pasture and Hav Fields
W Residential
% ' Old Fields
Silicate Dynamics of the Rhode River
191
TABLE 2. Summary statistics for dissolved silicate concentrations in weekly spot samples taken from Rhode River subwatersheds for the period from summer 1984 through spring 1998. Values are arithmetic mean mg Si I-' (1 SE). Confidence Range Watershed
101 102 103 108 109 110 111 119 120 Rhode River (area-weighted)
Mean
N
9.25 (0.10) 11.04 (0.08) 12.85 (0.09) 14.44 (0.10) 15.60 (0.11) 13.35 (0.11) 14.97 (0.11) 11.68 (0.12) 10.88 (0.13) 10.77 (0.10)
650 602 620 593 576 480 727 728 728 664
ed) samples for 1-wk periods as in the case of the V-notch weirs. Flooding and ebbing tidal water samples were collected in separate containers. Spot samples of stream water were also collected from all watersheds at various stage heights and different times of year. This facilitated the characterization of the concentrations of DSi as a function of water discharge rate. Spot samples were also taken weekly from September 1971 through November 1972 at stations 101,102,103, and 119 (Table 1). Estuarine water samples were periodically collected at a series of stations along the tidal axis of Muddy Creek (a tidal creek through which most of the Rhode River watershed drainage is transmitted), the Rhode River, and Chesapeake Bay adjacent to the mouth of Rhode River (Fig. 1;Jordan et al. 1991). Rainfall volume was measured at the Smithsonian Environmental Research Center's weather station on subwatershed 101. All of the watershed drainage under study was within 6 km of the weather station. Rainfall volumes were measured with standard manual rainfall gauges, and with a Belfort weighing gauge. Samples were filtered through prewashed Millipore 0.45-pm filters prior to analysis. Stream samples prior to spring of 1991 and all estuarine samples were analyzed manually for DSi by reaction with ammonium molybdate and colorimetry (Strickland and Parsons 1972). Subsequently, stream samples were analyzed for DSi by reaction with ammonium molybdate in a Technicon AutoAnalyzer I1 (method 696-82W).
Results DSI DISCHARGES FROM THE WATERSHED Mean DSi concentrations from the 9 subwatersheds ranged from 9.25 to 15.6 mg Si 1-' (Table 2) with an average for the area-weighted overall watershed of 10.8 mg Si lk'. There were consistent differences among the watersheds, and all of the
95 W
9.04-9.45 10.88-1 1.20 12.67-13.03 14.24-14.65 15.38-15.82 13.14-13.56 14.75-15.18 11.43-1 1.92 10.62-11.13 10.57-10.96
991
8.98-9.51 10.83-1 1.25 12.62-13.08 14.18-14.71 15.32-15.89 13.07-13.63 14.69-15.25 11.35-12.00 10.54-1 1.21 10.51-1 1.03
differences were significant (most at p < 0.01), with the exception of watersheds 102 and 120 (Table 2). Week to week changes in DSi concentration among watersheds over time were also highly significantly correlated, as indicated by paired t-tests. While DSi concentrations in spot samples were often significantly correlated with rate of water discharge, these correlations only explained a few percent of the variability in DSi concentration (e.g., for watershed 101; DSi concentration = 0.0672Q 8.78; r2 = 0.03, p < 0.0001). To test this relationship more rigorously, 50 samples taken for watershed 101 during five storm events at discharges from 0.01 1 ha-' s-' to 4.7 1 ha-' s-' were analyzed for silicate concentration with similar results (DSi concentration = -0.367Q + 6.35; r2 = 0.05, p = 0.12). Mean annual DSi fluxes ranged from 20 to 36.5 kg Si ha-' (Table 3) with an area-weighted mean for the overall watershed of 26.6 kg Si ha-'. The largest mean seasonal fluxes were in the spring, when 51% of the annual flux occurred, followed by the winter (43%). This seasonal pattern was found on all 9 subwatersheds. There were large interannual differences in seasonal and yearly DSi flux. For the overall watershed, annual DSi flux was 58.6 kg Si ha-' in 1989 and only 14.6 kg Si ha-' in 1995. Overall watershed annual DSi flux was highly correlated with the volume of water discharged (DSi flux = 0.0892Q + 1.27; r2 = 0.89, p < 0.0001). While volume-weighted mean DSi concentrations varied from 8.01 mg Si 1-' in 1994 to 12.5 mg Si 1-' in 1985, there was no significant correlation with the volume of water discharged. The variations observed in annual DSi fluxes were primarily the results of interannual variations in water discharge. Interannual variability in seasonal DSi flux was highest in the summer and fall and lowest in the winter. In the fall of 1993, overall watershed DSi flux was nearly zero (0.090 kg Si ha-'), while in the fall of 1989 the flux was 138-fold higher (12.5
+
192
D. L. Correll et a1
TABLE 3. Flow-weighted mean dissolved silicate fluxes from Rhode River subwatersheds for the period from summer 1984 through spring 1998. Values are kg Si ha-' (1 SD). Watershed
Winter
101 102 103 108 109 110 111 119 120 Rhode River (area-weighted)
Sorlna
Summer
Fall
Annual
9.74 (3.91) 9.54 (3.56) 10.28 (4.27) 13.72 (7.00) 9.99 (4.16) 6.51 (4.69) 9.13 (5.01) 11.88 (4.46) 11.11 (4.11) 11.34 (4.36)
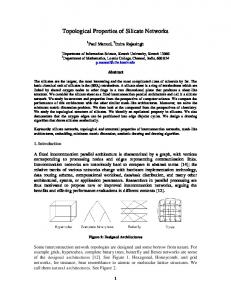
kg Si ha-'). In the summer of 1988, overall watershed DSi flux was 0.199 kg Si hak1but in the summer of 1989 the flux was 105-fold higher (20.9 kg Si ha-'). Even though there was less variability in the winter and spring, over four-fold variations were observed in 14 yr. As in the case of annual fluxes, these variations in seasonal DSi flux were highly correlated with the volume of water discharged, and volume-weighted mean DSi concentrations were not significantly correlated with water discharge. Rhode River watershed DSi fluxes were not correlated with land use. Watershed 109 was primarily cropland, watershed 110 was completely forested, and watershed 111 was primarily used for cattle grazing. When weekly integrated DSi fluxes for these 3 single-land-use watersheds and the areaweighted Rhode River watershed were compared (Fig. 2), fluxes from the forested watershed were lowest, but all were quite similar. DSi concentrations measured for subwatersheds 101, 102, 103, and 119 for 15 mo in 1971-1972 were compared with concentrations measured 25 yr later on the same watersheds. The 1995-1996
time period was chosen for the comparison because the precipitation was the most similar to that of the earlier time period (Table 4). Although the second time period had about 5% more total precipitation, there was a very good match, season by season. The largest discrepancy in precipitation was in the summer (18% higher in the second time period). Each season the DSi concentrations for each subwatershed were lower in the second time period, 35% lower on average for the second-order watersheds and 25% for the larger third-order watershed 119. Linear regressions of mean annual DSi concentration versus measurement year had highly significant negative slopes for all four watersheds, whether or not the 1971-1972 data were included in the regressions (e.g.,Fig. 3). These regressions explained from 51% to 73% of the variation in DSi concentration over time. The regression slope for subwatershed 119 was -0.248 mg Si lkl yrkl or a decrease of about 1.5% yr-I over the last 25 yr. Without the 1972 data the regression had a slope of -0.257 mg Si lkl yrkl (r2 = 0.37, p = 0.03). For the three second-order subwatersheds, the slopes averaged -0.210 mg Si 1-I yr-I, which corresponded to a decrease of about 1.5% yr-l. Similar trends were found from 1984 through 1998 for all Rhode River subwatersheds, regardless of land use. For the completely forested watershed 110, the slope was -0.378 mg Si l k lyrkl (r2 = 0.40, p < 0.03).
TABLE 4. Precipitation depths (cm) for seasons when comparative silicate concentration data were taken on Rhode River subwatersheds. Precipitation
Time
-l.OO
'
Area-Weighted Rhode Rwer
_i
Cropland
Period
1971-1972
1095-1996
Fall Winter Spring Summer Fall Total
38.84 29.01 31.34 34.55 32.82 166.6
39.03 26.16 31.81 40.85 34.19 175.0
I -
Mature Forest
Grazed Land
Fig. 2. Comparisons of weekly dissolved silicate fluxes from area-weighted Rhode River watershed and three single-land-use small Rhode River subwatersheds. For each data set the mean, + 2 SE, and + 2 SD are shown.
193
Silicate Dynamics of the Rhode River I
2nd Order WMs Si conc. = -0.210X t 428; r 2= 0.61, p = 0.001 Wtsd 119 Si conc. = -0.248X + 505; r 2 = 0.60, p = 0.001
-
-16kh,
8 1971
1976
1
1
I
1981
1986
1991
I 1996
Watershed Year
Fig. 3. Changes in mean annual dissolved silicate concentrations discharged from Rhode River subwatersheds over time. Solid circles and broken line are annual means for subwatershed 119. Solid squares and solid line are annual weighted means for subwatersheds 101, 102 and 103.
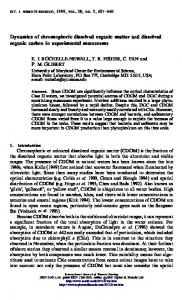
DSI CONCENTRATIONS IN THE RHODERIVER ESTUARY Discharges of DSi from Rhode River watershed are highly variable over time (Fig. 4). They are normally high in the winter and spring, then decline to a minimum in the fall. During periods of extended drought, as in 1993, watershed discharge is very low (Fig. 4) and DSi concentrations in the water column of the Rhode River estuary become depressed. Figure 5a illustrates this depletion in time and space along the tidal axis of the Rhode River at four times in 1993. On day 244 of 1993, DSi concentrations varied from 1.67 to 3.89 mg Si 1-I along the 8.2-km transect, but by day 279 DSi concentrations were depressed all along the transect with a minimum of 0.041 mg Si 1-I at from 3 to 5 km (Fig. 5a). On day 307, DSi concentrations had increased, especially in the upper part of the transect, but were about 0.50 mg Si I-' in the downstream part of the transect. By day 335, DSi concentrations were again depressed to a minimum of 0.069 mg Si 1-I at 5 km (Fig. 5a). A similar but less protracted sequence was observed in 1995 (Fig. 5b), following an unusually low winter seasonal discharge (Fig. 4). On day 81, DSi concentrations at the upper end of the transect were 4.8 mg I-', but declined to about 0.5 mg I-' at 2.5-3 km, then increased somewhat farther down the transect (Fig. 5b). By day 108,while DSi concentrations were still from 3-8 mg Si 1-I at the upper end of the transect, they had declined to 0.058, 0.019, and 0.092 mg Si 1-' at 3, 5, and 7 km, respectively, then increased somewhat farther down the transect. By day 136, DSi concentrations were from 6.8 to 9.5 mg Si I-' at the upper end of the transect, declined to 1.0 mg Si 1 - I by km 3 and 0.49 mg Si I t 1 at km 8 (Fig. 5b). Rhode River watershed DSi fluxes for these
1
I
90
91
92
93
94
95
96
I
97
98
Year Fig. 4. U7eeklydissolved silicate fluxes from the Rhode River watershed into the Rhode River estuary.
two time periods are shown in more detail in Fig. 6. In the case of the 1993 sequence (Fig. 6a), there had not been any fluxes of more than 0.01 kg Si ha-' wk-I since day 172 and DSi delivery was essentially zero until day 335. In the 1995 sequence (Fig. 6b), DSi flux from the watershed varied from 0.25 to 0.50 kg Si ha-' wk-I and the highest flux preceding the sequence of transects was about 1.0 kg Si ha-' wk-' at day 73. Discussion Mean DSi concentrations in discharges from the Rhode River subwatersheds averaged 10.8 mg Si I-' (Table 2). This is higher than values reported for other parts of the Chesapeake Bay watershed: almost five times higher than the Valley and Ridge province and over three times higher than the northern Piedmont (Table 5). Rhode River watershed DSi concentration seemed to decline somewhat at times of high water discharge, but discharge only explained a small percentage of the variability in DSi concentration. Smith et al. (1996) also found no significant relationship between DSi concentration and water discharge and O'Brien et al. (1993) found small but noticeable declines in DSi concentration at the height of storm events.
194
D. L. Correll et al.
TABLE 5 . Comparison of mean annual dissolved silicate concentrations (mg Si iographic provinces of the Chesapeake Bay watershed. Physiographic Province
Valley and Ridge Blue Ridge Northern Piedmont Coastal Plain Coastal Plain
I-I)
in discharges from watersheds in various phys-
Description
Silicate
Source
Shenandoah Valley, Virginia Catoctin Mountains, Maryland Baltimore and Carroll Counties, Maryland Eastern Shore, Maryland Rhode River, Maryland
2.2 4.2 3.3 5.4 10.8
O'Brien et al. (1993) O'Brien et al. (1993) Jordan et al. (1997b) Jordan et al. (1997a) this study
plained only 27% of the variation in mean DSi concentrations in watershed discharges and only had a p = 0.09. If atmospheric deposition of hydronium ions is the main driving mechanism in soil weathering releases of DSi, then the effects seem to be averaged out over a period of years. The steady decline in DSi concentrations in watershed discharges is difficult to explain. If this decline were to continue at the same rate for another 25 yr, mean DSi concentrations would fall to only 3.54 mg Si 1-' (36% of present concentrations). Some authors (e.g., April et al. 1986) argue that increased weathering rates in recent years could be the result of increases in acid deposition. The highest atmospheric deposition flux of hydronium ions at Rhode River was in 1979 (1340 eq ha-' yr-'; Jordan et al. 1995). A linear regression of mean annual hydronium ion concentration in bulk precipitation versus year for the period of 1984-1998 had a slope of -3.16 (r2 = 0.53, p = 0.003; Fig. 7). This is a decrease in hydronium ion concentration of about 2% yr-' and might help explain our trend of decreasing DSi concentrations rather directly. Other explanations are also possible. Perhaps the more readily weathered silicon compounds in the watershed soils are becoming depleted? If Bartoli (1983) is right about the sources and pools of readily weatherable silicon in the soils, it would take on the order of 10,000 yr to deplete this pool at our present rate. In a model of soil silicate weathering, verified in several locations, the ratio of hydronium ion to dissolved aluminum is a critical factor (Sverdrup and Warfvinge 1988). The hydronium ions in rain at the Rhode River site are utilized in geochemical reactions near the surface releasing high concentrations of aluminum (Correll et al. 1987). The released alu-
The DSi fluxes found in this study are consistent with those from other parts of the world (Table 6). The low DSi flux in northern California and the very high fluxes from the Caribbean are probably primarily the result of low and very high precipitation in those regions, respectively (Meybeck 1979). Atmospheric acid deposition is sometimes invoked as the causal element in the release of DSi from watershed soils (e.g., Holdren and Speyer 1986; Sverdrup and Warfvinge 1988). The weighted mean concentration of hydronium ions in bulk atmospheric deposition from 1984 through 1998 at Rhode River was 65.4 Feq 1-' and the mean flux of hydronium ions was 732 eq ha-' yr-' (Jordan et al. 1995; and unpublished data). Essentially all of these hydronium ions are consumed in various biogeochemical reactions on the watershed (Correll et al. 1984; Weller et al. 1986). A one-to-one release of DSi from reactions of hydronium ions with soil minerals would release 18.3 mg Si 1-' and a flux of 20.5 kg Si ha-' yr-', which is close to the measured mean of 10.8 mg Si 1-I (Table 2) and flux of 26.6 kg Si ha-' yr-I. Two of the most abundant minerals on the watershed, montmorillonite and kaolinite, give 2 and 1 mole of DSi per mole of hydronium ion consumed, respectively (Correll et al. 1987). We do not know what chemical form of silicon is reacting with the hydronium ions in atmospheric deposition, but DSi fluxes (Table 3) are in the right range to be the product of weathering by acidic atmospheric inputs. Year-to-year fluctuations in the concentrations of hydronium ions in wet and bulk atmospheric deposition were only weakly correlated with DSi concentrations in watershed discharges. A linear regression of mean annual hydronium ion concentration in wet deposition ex-
TABLE 6. Comparison of fluxes of dissolved silicate (kg Si ha-' yr-') from various watersheds.
Location
Northeast Scotland England and Wales Northern California Caribbean Maryland
Vegetation
Grass, Forest Grazing Land Forest Mixed, Cropland, Forest, Grazing
S o , of Watersheds
Years of Study
Silicate Flux
Source of Data
2 2 1 3 7
1 n o data 7 2 14
30.7, 38.5 11.2, 6.72 12.6 267 26.6, 27.8, 20.1, 24.0
Creasey et al. 1986 Hornung et al. 1986 Smith et al. 1996 McDowell et al. 1995 this study
195
Silicate Dynamics of the Rhode River
Day 244
Day 279
1
Day 335 Day 307 I
1
0
I
Day 108
I
Distance from Head of Tide (km) Fig. 3, Dissolved silicate concentrations along axial transects of the Rhode River estuary. Panel A = 1993, Panel B = 1995. Times of individual transects are given in Julian dates. The headwaters of the Rhode River branch into two tidal creeks.
minum ions then might greatly inhibit the weathering of silicates below this thin surface layer of soil.,Several decades of acid deposition may have begun to deplete the most readily weatherable forms of amorphous silicates in a thin layer of surface soils. How do our declines in DSi concentrations compare to other sites? The USGS Water Quality Monitoring Network (WQN; Alexander et al. 1996) had one site on the Coastal Plain part of the Chesapeake Bay watershed, at Greensboro, Maryland on the upper Choptank River watershed, where DSi was measured from 1973 through 1994 (Fig. 8). These DSi concentrations declined over time at a rate of about 0.7-0.8% yr-' (p < 0.02), which is lower than the rate at the Rhode River watershed (1.5% yr-I). WQN DSi concentrations from 1978 through 1995 for the Susquehanna River at Conowingo (the largest watershed on Chesapeake Bay) had no significant trend over time. Unlike the Rhode River and Choptank River watersheds, the
0.0 A 95.1 95.2 95.3 95.4 95.5 Time (yrs)
Fig. 6. Rhode River watershed dissolved silicate fluxes. Panel A = summer of 1993, Panel B = spring of 1993. Days of estuarine axial transect samplings are noted.
Susquehanna River watershed is in the Piedmont and Appalachian physiographic provinces, which have been highly weathered over millions of years. DSi concentrations were much lower in discharges from Appalachian and Piedmont watersheds than in discharges from Coastal Plain watersheds (Table 5).
.
100
I
30 1984
Hydronium Ion = -3 04(Yr) + 61 14,r 2 = 0 57, p = 0 001 I
I
I
I
1986
1988
1990
1992
I
I
1994
1996
1998
Year
Fig. 7. Changes in weighted mean annual hydronium ion concentrations in bulk precipitation at the Rhode River site over time.
196
D. L. Correll et a1
55
DSI = -0 0325 (yr) + 68 9, r 2 = 0 26,
I
=0
016
'
I
I
1975
1980
1985
1990
1995
Year
Fig. 8. Changes in mean annual dissolved silicate concentrations discharged from the Choptank River watershed at Greensboro, Maryland over time.
DSi concentrations in the Mississippi River had a significant negative correlation with rates of P fertilization on the watershed between 1950 and 1987 (Turner and Rabalais 1991). This decline in DSi was attributed to P-stimulated increases in algal assimilation along the course of the river although 1974-1994 WQN DSi concentration data at Vicksburg, Mississippi showed no significant change over time. The negative correlation with phosphate fertilization rates reported by Turner and Rabalais (1991) does not seem to be a simple correlation with time, or was strongly influenced by the period 1950-1974. Our declines in DSi concentration over time at the Rhode River watershed are not related to increased fertilizer application rates. Two of the watersheds were completely forested and were not fertilized at all. The others have had a slow decline in agricultural activity over time. Even fertilizer application rates on the Choptank River watershed have declined in recent years (Jordan et al. 1997a). Our findings seem to be applicable only to the Atlantic Coastal Plain physiographic province. It would be of considerable interest to look for time series data on DSi concentrations at other sites on the Coastal Plain to test the generality of our findings. Interestingly, even though the Rhode River watershed has a very high average annual flux of DSi compared to other regions of the Chesapeake Bay watershed, depletion of DSi in the Rhode River estuary has been observed. The area of the Rhode River Estuary where these depletions occur is influenced by discharges from two watersheds, the Rhode River and the Susquehanna River (via transport down-bay and tidal exchange into the Rhode River; Gallegos et al. 1992). The DSi concentrations in Chesapeake Bay were always lower than at the mouth of the Rhode River, when measured
along axial transects (Figs. 4 and 5). At these times, the net transport of DSi was from the Rhode River to Chesapeake Bay. DSi concentrations in Susquehanna River discharges, at the head of the Bay are much lower than those at the head of the Rhode River, and plankton uptake has lowered these DSi concentrations even further by the time these waters reach the mouth of the Rhode River (D'Elia et al. 1983; Conley and Malone 1992; Fisher et al. 1992). Benthic regeneration may have caused the temporary increase in DSi concentration observed on day 307 of 1993 at a time of essentially zero watershed inputs (Figs. 5 and 6). Depletions of DSi in the Rhode River may have occurred more frequently but were not observed due to the infrequency of axial transect samplings. Chesapeake Bay, like many other coastal waters, has undergone substantial enrichment with N and P, sometimes resulting in DSi limitations for diatom populations. ~ h : l sstudy demonstrates that coastal Plain watersheds are more i m ~ o r t a n tas DSi sources to Chesapeake Bay than their areas would imply. These Coastal Plain DSi discharges are especially important to the subestuaries of the Bay, such as Rhode River. Monitoring of DSi fluxes to ' ~ h e s a ~ e a kBay e at the fall line of major rivers (the point where they enter the Coastal Plain) misses these important Coastal Plain sources and therefore underestimates total DSi flux to Chesapeake Bay. Widespread declines in DSi concentrations in Coastal Plain discharges could have major impacts on phytoplankton populations in ~ h i s a peake Bay and other similar coastal waters. More research is needed to discover the cause of these declines in DSi concentrations and to determine how widespread an area of the Coastal Plain is experiencing these declines.
This research was supported by a series of grants from the Smithsonian Environmental Science Program, the National Science Foundation, the Environmental Protection Agency, and the National Oceanic and Atmospheric Agency's Coastal Oceans Program. Much of the sampling and laboratory analyses were carried out by Joseph J. Miklas and Nancy Goff. We also thank Daniel Conley, Ministry of Environment and Energy, Denmark, for his review of this paper and his helpful suggestions.
ALEXASDER, R. B., A. S. LCDTKE,K. K. FITZGERVD,AYD T. L. SCHERTZ. 1996. Data from Selected U.S. Geological Survey National Stream M7ater-QualityMonitoring Networks (MTQN) o n CD-ROM. United States Geological Survey. Open-File Report 96337, Reston, Virginia. L k G.~F. 1986. ~ Silica, ~ diatoms ~ and ~ a freshwater ~ , productivity maximum in Atlantic Coastal Plain estuaries, Chesapeake Bay. Estuarine Coastal and Shelf Science 22:183-197. APRIL,R., R. NEUTON,AYD L. T. COLES.1986. Chemical weathering in two Adirondack watersheds: Past and present-day rates. G~olopcalSociety ofAmm'ca Bulletin 97:1232-1238.
Silicate Dynamics of the Rhode River
BARTOLI,F. 1983. The biogeochemical cycle of silicon in two temperate forest ecosystems. Ecologzcal Bulletins (Stockholm) 35: 469-476. CARPENTER, S. R., N. F. CARACO, D. L. CORRELL, R. M7.HOWARTH, A. N. SHARPLEY, . h v ~V. H . SMITH.1998. Nonpoint pollution of surface waters with phosphorus and nitrogen. EcologzcalAp plications 83559-568. CHIRLIS,G. R. AYD R. W. SCH.WFSER. 1977. Observations o n the water balance for seven sub-basins of Rhode River, Maryland, p. 277-306. In D. L. Correll (ed.), Watershed Research in Eastern North America: A Workshop to Compare Results. Smithsonian Press, U'ashington, D.C. C m , J . F., H . J . SIMPSOS,R. F. BOPP,AYD B. DECK.1992. Geochemistry and loading history of phosphate and silicate in the Hudson estuary. Estuarine Coastal and Shelf Science 34:213-233. CLOERN, J. E. 1996. Phytoplankton bloom dynamics in coastal ecosystems: A review with some general lessons from sustained investigation of San Francisco Bay, California. Rmieun of Geophysics 34: 127-168. CONLEY, D. J. 1997. Riverine contribution of biogenic silica to the oceanic silica budget. Limnology and Oceanography 42:774777. CONLEY, D. J. AYD T. C. MALONE. 1992. Annual cycle of dissolved silicate in Chesapeake Bay: Implications for the production and fate of phytoplankton biomass. Marine Ecology Progress Series 81:121-128. CONLEY, D. J., C. L. SCHELSKE, AWD E. F. STOERMER. 1993. Modification of the biogeochemical cycle of silica with eutrophication. marine Ecolog~Progress Series 101: 179-192. CORRELL, D. L. 1977. An overview of the Rhode River watershed program, p. 105-124. In D. L. Correll (ed.), U'atershed Research in Eastern North America. Smithsonian Press, U'ashington, D.C. CORRELL, D. L. 1981. Nutrient mass balances for the watershed, headwaters intertidal zone, and basin of the Rhode River estuary. Limnology and Oceanography 26:1142-1149. CORRELL, D. L. 1998. The role of phosphorus in the eutrophication of receiving waters: A review. Journal ofEnvironmenta1 Quality 27:261-266. CORRELL, D. L. AYD D. DIXON.1980. Relationship of nitrogen discharge to land use o n Rhode River watersheds. Agrc-Ecosystems 6:147-159. CORRELL, D. L., N. M. GOFF,AWD W. T. PETERJOHS.1984. Ion balances between precipitation inputs and Rhode River watershed discharges, p. 77-1 l l . In 0 . P. Bricker (ed.), Geological Aspects of Acid Deposition. Butterworth Publishers, Boston. CORRELL, D. L., T. E. JORDAW, .hv~ D. E. U'ELLER.1995. Livestock and pasture land effects o n the water quality of Chesapeake Bay watershed streams, p. 107-1 17. In K. Steele (ed.), Animal Waste and the Land-Water Interface. Lewis Publishers, Nelv York. CORRELL, D. L., J. J. MIKWS,A. H. HISES, AWD J. J. S C H . ~ R . 1987. Chemical and biological trends associated with acidic atmospheric deposition in the Rhode River watershed and estuary. Water Air and Soil Pollution 35:63-86. COTTON,F. A. AYD G. ~ 7 1 ~ ~ 1966. ~ ~ Advanced ~ O S . Inorganic Chemistry. Interscience, New York. CE~SEY,J., A. C. EDWARDS, J. M. REID,D. A. MACLEOD, MD M. S. CRESSER. 1986. The use of catchment studies for assessing chemical weathering rates in two contrasting upland areas in northeast Scotland, p. 467-501. In S. M. Colman and D. P. Dethier (eds.), Rates of Chemical Weathering of Rocks and Minerals. Academic Press, New York. D'ELIA,C. F., D. M. NELSOS,AYD U'. R. BOINTON.1983. Chesapeake Bay nutrient and plankton dynamics: 111. The annual cycle of dissolved silicon. G~ochimicaet Cosmochimica Acta 47: 1945-1955. FISHER,T. R., L. W. HARDING, JR., D. W. S T . ~ ~ L EAWD Y , L. G.
197
WARD. 1988. Phytoplankton, nutrients, and turbidity in the Chesapeake, Delaware, and Hudson estuaries. Estuarine Coastal and Shelf Science 2751-93. FISHER, T. R., E. R. PEELE, J. U'. AUMERMAN, . h v ~L. U'. HARDING, JR. 1992. Nutrient limitation of phytoplankton in Chesapeake Bay. marine Ecolog~Progress Series 82:51-63. GALLEGOS, C. L., T. E. J o R D . ~.~h,v ~D. L. CORRELL.1992. Eventscale response of phytoplankton to watershed inputs in a subestuary: Timing, magnitude and location of blooms. Limnolog). and Oceanography 37:813-828. HAW,G. C. 1974. Salt balance and exchange in the Rhode River, a tributary embayment to the Chesapeake Bay. Ph.D. Thesis, The Johns Hopkins University, Baltimore, Maryland. HOLDREN, JR., G. R. AWD P. M. SPEYER.1986. stoichiometry of alkali feldspar dissolution at room temperature and various pH values, p. 61-81. In S. M. Colman and D. P. Dethier (eds.), Rates of Chemical Weathering of Rocks and Minerals. Academic Press, New York. HORYUNG, M., J. D. ADAMSON, B. REINOLDS,AWD P. A. STEVESS. 1986. Influence of mineral weathering and catchment hydrology on drainage water chemistry in three upland sites in England and Wales. Journal of the Geolqcal Society (London) 143:627-634. HCTCHINSON, G. E. 1957. A Treatise o n Limnology Volume I. Geography, Physics and Chemistry. John Wiley & Sons, New York. JoRDAW, T. E., D. L. CORRELL,J.MlKLX, AYD D. E. U'ELLER.1991. Nutrients and chlorophyll at the interface of a watershed and an estuary. Limnology and Oceanography 36:251-267. JORDAS,T. E., D. L. CORRELL, AYD D. E. WELLER. 1997a. Effects of agriculture o n discharges of nutrients from Coastal Plain watersheds of Chesapeake Bay. Journal ofEnvironmenta1 Quality 26:836-848. JoRD.ks, T. E., D. L. CORRELL, AYD D. E. M7ELLER. 1997b. Nonpoint source discharges of nutrients from Piedmont watersheds of Chesapeake Bay. Journal of American Water Resources Association 33531-645. J o R D . ~ ~T., E., D. L. CORRELL, D. E. U'ELLER,AWD N. M. GOFF. 1995. Temporal variation in precipitation chemistry o n the shore of the Chesapeake Bay. Water Air and Soil Pollution 83: 263-284. KkCL, L. W. AWD P. N. FROELICH, JR. 1984. Modeling estuarine nutrient geochemistry in a simple system. Geochimica et Cosmochimica Acta 48:1417-1433. LERAT,Y , P. L~SSERE, AYD P. LE CORRE.1990. Seasonal changes in pore water concentrations of nutrients and their diffusive fluxes at the sediment-water interface. Journal ofExpm'mental Marine Biology and Ecology 135:135-160. LIKENS, G. E. (ED.).1972. Nutrients and Eutrophication. Special
Symposium Volume 1. American Society of Limnology and
Oceanography. Allen Press, Lawrence, Kansas.
MCCAFFREY, R. J., A. C. MYERS,E. DAVEY, G. MORRISON, M. BENDER, N. L u ~ D. ~CCLLES, ~ ~P. FROELICH, , A S D G. KLINKHAMMER. 1980. The relation between pore water chemistry and benthic fluxes of nutrients and manganese in Narragansett Bay, Rhode Island. LimnologJ and Oceanography 25:31-44. MCDOUTLL,W. H., A. E. LCGO,AYD A. JAMES.1995. Export of
nutrients and major ions from Caribbean catchments. Journal
of North Ammican Benthologzcal Society 14:12-20.
MEYBECK,M. 1979. Pathways of major elements from land to ocean through rivers, p. 18-30. In J.-M. Martin, J. D. Burton, and D. Eisma (eds.),River Inputs to Ocean Systems, Proceedings of the Scientific Committee o n Oceanic Research U'orkshop. United Nations, New York. O'BRIES,A. K., K. C. RICE,M. M. KESNEDY, AYD 0 . P. BRICKER. 1993. Comparison of episodic acidification of Mid-Atlantic upland and Coastal Plain streams. Water Resources Research 29: 3029-3039. RAGUENEAC, O., E. D. B. \ . r ~ ~P. , TREGUER, B. QUEGUISER,
198
D. L. Carrel et al.
.&VDY. DELAVO. 1994. Phytoplankton dynamics in relation to the biogeochemical cycle of silicon in a coastal ecosystem of western Europe. Marine Ecology Progress Series 106:157-172. RYTHER, J. H . AYD U'. M. DUNST.&V. 1971. Nitrogen, phosphorus and eutrophication in the coastal marine environment. Science 171:100&1013. SCHELSKE, C. L. AVD E. F. STOERMER. 1971. Eutrophication, silica depletion, and predicted changes in algal quality in Lake Michigan. Science 173:423-424. SCHELSKE, C. L. AYD E. F. STOERMER. 1972. Phosphorus, silica, and eutrophication of Lake Michigan, p. 157-171. In G. E. Likens (ed.), Nutrients and Eutrophication, Special Symposium Volume 1, American Society of Limnology and Oceanography. Allen Press, Lawrence, Kansas. SCHUBEL, J. R. AYD D. W. PRITCHARD. 1986. Responses of upper Chesapeake Bay to variations in discharge of the Susquehanna River. Estuaries 9:236249. S W E , J . H., C. H. CULBERSOS, AYD T. M. CHURCH. 1982. The chemistry of the Delaware estuary. General considerations. Limnology and Oceanography 27:1015-1028. SMITH,S. V., R. M. CHAMBERS, AYD J. T. HOLLIB.~UGH. 1996. Dis-
solved and particulate nutrient transport through a coastal watershedestuary system. Journal of Hydrology 176:181-203. S T R I C ~ J. D D. , H. AYD T. R. PARSOSS.1972. A Practical Handbook of Seawater Analysis. 2nd edition. Number 165. Bulletin of the Fisheries Research Board of Canada. Ottawa, Canada. SVERDRUP, H. .&VDP. WARRINGE.1988. Weathering of primary silicate minerals in the natural soil environment in relation to a chemical weathering model. U'ater Air and Soil Pollution 38:387-408. TURNER, R. E. AYD N. N. R~BAws. 1991. Changes in Mississippi River water quality this century. Bioscience 41:140-147. AYD K. WA-MURRAY. 1998. Seasonal U ~ LG,. R., P. J. PHILLIPS, and spatial patterns of nitrate and silica concentrations in Canajocarie dree, New York. Journal ofEnuzronmenta1 Qualzty 27: 381-389. U'ELLER,D. E., W. T. PETERJOHS, N. M. GOFF,AYD D. L. CORRELL. 1986. Ion and acid budgets for a forested Atlantic Coastal plain watershed and their implications for the impacts of acid deposition, p. 392-421. In D. L. Correll (ed.),M7atershed Research Perspectives. Smithsonian Press, Washington, D.C.
Received for consideration, May 10, 1999 Accepted for publzcation, October 11, 1999