data in near real time. The system has a visual analytics interface, which allows different emergent clusters to be vi- sualized, selected, and used for scoring of ...
Distributed Discovery in E-Science: Lessons from the Angle Project∗ Robert L. Grossman†, Michael Sabala, Yunhong Gu, Anushka Anand, Matt Handley, Rajmonda Sulo and Lee Wilkinson University of Illinois at Chicago National Center for Data Mining, 851 S. Morgan Street Chicago, IL USA
Abstract We describe the design of a system called Angle that detects emergent and anomalous behavior in distributed IP packet data. Currently, Angle sensors are collecting IP packet data at four locations, removing identifying information, and building IP-based profiles in temporal windows. These profiles are then clustered to provide high-level summary information across time and across different locations. We associate meaningful changes in these cluster models with emergent or anomalous behavior. Emergent clusters identified in this way are then used to score the collected data in near real time. The system has a visual analytics interface, which allows different emergent clusters to be visualized, selected, and used for scoring of current or historical data. Each Angle sensor is paired with a node on a distributed computing platform running the Sector middleware. Using Sector, data can be easily transported for analysis or reanalysis.
1
Introduction
There are millions of computers connected to the Internet and billions of networks flows that access them. Unfortunately not all these flows are benign, and an increasing number of them are associated with some type of anomalous behavior, such as sending spam, probing for system vulnerabilities, attempting to install malware, and related behavior. Detecting suspicious flows across the Internet is a challenging problem in high performance analytics. One of the reasons the problem is challenging is because the types of suspicious flows change all the time. One of the ∗ This work was supported in part by the National Science Foundation through grants SCI-0430781, CNS-0420847, and ACI-0325013. † Robert Grossman is also the Managing Partner of Open Data Group. He is the corresponding author.
goals in this project was to detect behavior that is suspicious but different that the type of suspicious behavior that has been seen before. We call this type of suspicious behavior emergent and give a precise definition of it in Section 3. There were three technical challenges in this project: 1. The first challenge was to develop an architecture for the system that supports discovery from large, distributed data sets. 2. The second challenge was how to define emergent behavior in a meaningful way and to develop an algorithm to detect it. 3. The third was to develop a visual analytics interface that could be used effectively by analysts and was designed in such a way as to encourage collaborative analysis. There was also one practical challenge in the project: 4. The organizations we worked with were very reluctant to share data, due to the privacy required when working with IP traffic. A practical challenge was to develop an anonymization procedure powerful enough so that institutions would share IP data but that left enough information so that sharing data was still useful. In this paper, we introduce a system called Angle for making discoveries from distributed IP data. Angle is based upon a framework so that information from geographically distributed locations can be combined together easily in order to detect emergent behavior that may not be readily apparent simply by analyzing data from one location. The majority of prior work in this area is what is usually called signature based. Signatures of specific attacks are created and IP data is screened using these signatures. Snort is one of the most widely deployed systems for analyzing IP packet data using signatures [8]. There are also a variety of
• In contrast to a grid computing architecture where data is generally moved to a shared pool of compute nodes as required by computing tasks [1], the Angle infrastructure provides persistent storage to data in edge nodes that are co-located as close as possible to the sensor nodes where the data is collected. In this way, as much as the computation as possible is done without moving the data.
statistical based techniques. See, for example, [4] and the references cited there. Angle is a statistical based system.
2
Angle Architecture
In this section, we describe the architecture of the Angle System. Angle consists of three types of nodes:
• Some of the Angle Edge nodes are connected by a 10 Gbps network, which is faster than the backplane of some computers. This type of wide area distributed computer was first popularized by the OptIPuter [7], and with the proper middleware, such as Sector and UDT, enables certain data intensive computing tasks to be completed almost as efficiently as if the data were co-located in one place.
1. The first type of nodes are sensor nodes that are attached to the commodity Internet and collect IP data. 2. The second type of nodes are edge nodes that are connected to a wide area a high performance network. Each sensor node is associated to a nearby edge node and data is passed from the sensor node to the edge node. Edge nodes can be used both for processing data locally as well as for distributed processing of data. In particular, features from the collected data are extracted by the edge nodes. Edge nodes also provide persistent storage for data collected by the associated sensor node. 3. The third type of nodes are pooled nodes. Pooled nodes are used for compute intensive tasks, such as the re-analysis of previously collected data. Data is moved to pooled nodes as required. See Figure 1. If a computer has two network cards, one for the commodity internet and one for a high performance network connecting the Angle edge nodes, then an Angle Sensor node and an Angle Edge node may both share the same physical computer. The Angle System also contains additional types of nodes called core nodes, that are also connected with a high performance network, but for the overview provided here, their role is not relevant. Angle edge nodes run a peer-to-peer storage system called Sector that is designed to manage large remote and distributed data over wide area high performance networks [2]. Sector is based on the Chord peer-to-peer routing API [9]. All participating edge nodes belong to the storage system, which uses the Chord routing API to locate files by their names. A data channel is then set up between the Sector node that a storage client connects to and the Sector storage server node that holds the desired file. To transport data efficiently over high performance networks with high bandwidth delay products, Angle uses a network transport protocol called UDT [3], for the data channel. Angle Sensors, running on sensor nodes, collect IP packet data and buffer it. In addition, Angle Sensors run code that extract features from IP packet data belonging to a rolling window and transport it to an Angle edge node running Sector. We close this section with two remarks.
3
The Angle Data Analysis Methodology
In this section, we describe the approach used by Angle to analyze distributed IP data. Collecting and Processing Packets. Network data is captured by independently managed network monitoring servers running IP packet capture software that we have developed. Typically these are fast Opteron or Xeon servers monitoring a port-mirror of an output port of a switch or router on the edge of a network. Angle capture software was designed to preserve privacy while capturing sufficient packet information to allow behavioral data mining. Source and destination IP addresses are hashed using a randomly generated salt, which is changed automatically by the software every time it is restarted or when the previous salt is one week old. Payload checksum is computed and stored, and the payload itself is nulled. MAC address fields along with checksum are nulled. Geo-location information is looked up based on IP addresses prior to their hashing and includes country, state, city and zip code (as available). The captured data is stored in a standard pcap format [5] to allow processing with standard tools and at no time are non-anonymized packets stored on disk. Furthermore, salts are non-recoverable. Uploads of pcap files are handled automatically by a robust upload tool that manages an upload queue on disk, spools files and uploads them to Angle Edge nodes. Currently a compressed pcap file is sent by each monitoring location every ten minutes. Computing Profiles. The next step is that the pcap files are processed to produce profiles, which is summary data associated with a specific entity. In the examples, we compute profiles associated with Source IP addresses, but other types of profiles can be easily generated using the system. In the
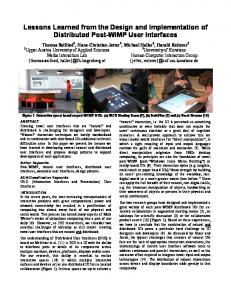
Angle Sensors collect data from commodity internet
Sector distributed computing platform utilizing wide area 10 Gbps network
Angle nodes used for processing pcap files, computing profiles, computing clusters, and computing emergent clusters in near real time.
Grid used for: a) the reanalysis of pcap files to compute new features; b) for the reanalysis of profiles to compute new models; and c) for the reanalysis of models to compute new emergent clusters.
Figure 1. This is an overview of the Angle architecture. Data is collected in near real time from sensors located on the commodity internet. Each Angle Sensor node is paired to an Angle Edge node on a distributed computing platform running Sector and UDT middleware. Data analysis is done using the Angle Edge nodes.
examples below, the profiles consist of eight features, but the Angle System can produce profiles containing more or fewer features. The pcap queuing process running on the Angle Sensor receives pcap files and queues them for processing by the Angle Edge nodes that compute profiles. The results are stored in files and are also tracked in a SQL database. The database stores information about each pcap file; site, time interval, number of packets, number of dropped packets, number of hosts; and stores URLs to the pcap file along with URL to the computed profile file. Computing Models. Next each profile file is processed to determine clusters, which we view as a convenient way of summarizing the behavior at a particular location over a particular time period. Currently, clusters are computed using the k-means algorithm, but other algorithms can also be easily used. Every ten minutes, the cluster models for each site, as well as global cluster models for all the sites, are stored in a SQL database to allow easy access and search capability. Meta-analysis of Models. Next collections of models are analyzed to determine emergent clusters. Emergent clusters can be defined in various ways. One way is to define an emergent cluster as a new cluster that appears when there has not been one before. Another way is to define an emergent or anomalous cluster as a cluster that is present in one site or just a few sites. We describe how we compute emergent clusters in more detail below. Real time scoring of profiles. The Angle system allows
models to be browsed, visualized and selected. Once a model is selected, emergent clusters in the model are scored using the Angle scoring functions. This process is described below.
3.1
Computing Features
Using the pcap data captured from all sensor locations at ten minute intervals, statistical summaries for each distinct IP address are extracted. As an example of the features that we have used, some of our experimental studies have used the followed eight features: number of ports touched by the IP, number of destination IPs touched by the IP, number of packets sent, average packet size, average data size, maximum packets per destination, maximum packets per port and maximum inter packet interval. The features are normalized using data collected over a period of time and over several locations. The Angle system is designed so that features can be easily added or removed.
3.2
Computing Stable and Emergent Clusters
After the feature extraction step, large volumes of data are clustered to allow for fast meta-analysis. A set of clusters for a selected combination of sensor locations and time represent a “model” in the Angle application. The clustering can be seeded with centroids from the previous run to identify and relate similar clusters over time as well as to achieve faster computation.
Both the features and cluster profiles are stored in a database as they are computed every ten minutes. This gives Angle the option to build or compute models from any time and sensor location that has been collected. Currently we have about a year’s worth of data. Models are analyzed to detect emergent behavior. As there is no well-established definition of emergent behavior, our approach is first to identify clusters that are stable either across time or across locations or some combination of both. The multivariate F-statistic is used to determine if there is a significant difference between two models (sets of clusters). If there is no difference the clusters are considered to be stable. Given two or more stable clusters, any new cluster that emerges is considered to be emergent.
3.3
The Angle Score
In this section, we describe how the Angle score is computed. First, we describe how Angle models are computed. Then, we describe how an Angle model is used for scoring. 1. Given event data from a new pcap file, we retrieve the corresponding feature vector and update it using the event data. 2. We then choose a model. A model contains zero or more emergent or what we also call red clusters. We let µk denote the center of each red cluster and σk denote the variance of each red cluster in the model. 3. Each model has weights θk and λk associated to it. Here the weights θk sum to 1, while the weights λk control the influence of the particular cluster in the score. 4. Given the updated feature vector x, we assign a score ρ to it using the red clusters R using the formulas:
To get a concise view of models and emergent behavior in the Model View, we utilize Multidimensional Scaling (MDS). MDS is a technique that allows the projection of points in a multidimensional space into a lower dimensional space (in our case, 2D space). The benefit of MDS is that it places similar clusters close together and dissimilar clusters far apart. The user can observe the spatial arrangement of clusters to infer relations between clusters within a model and across models. The axes of this plot are arbitrary (because the MDS model is invariant with respect to rotation and translation), so we omit other annotations in the plot. The goal of this plot is simply to identify clusters of similar clusters and to recognize similarities among emergent clusters. While the emergent behavior analysis and visualization helps identify anomalies, the time series Inspector View helps characterize the anomaly. In some cases certain features are more helpful for explaining a given type of behavior. The baseline can be constructed by aggregating the information we capture from all our monitored locations or any single one of them. This helps the analysis of both global and local structure and will expose suspicious behavior that would not otherwise be obvious. Angle takes advantage of new web technologies to provide a responsive and an intuitive interface for navigating large amounts of network packet data. The user browsing the web interface can select many options that regulate how data should be analyzed. These options are sent to the Angle server using AJAX (Asynchronous Javascript And XML). This technology lets a web page make a request for information in the background without disrupting the user’s browsing experience. The server receiving these requests performs an analysis using the user’s parameters. Once the analysis is complete, the results are returned to client’s web browser and appropriate views are updated.
ρ(x) = max ρk (x) k∈R
� ρk (x) = θk exp
4
−λ2k ||x − µK ||2 2σk2
�
Visual Analytics
The Angle visualization was developed to monitor anomalous flows or events across the system. Flows and events that are likely to be related to unusual behaviors are identified visually. Our visual analytics system represents statistical models in data viewers to allow easy recognition of both regularities and anomalies in data. The visual analytic components in Angle are the Map View, the Model View and the Inspector View. The Map View shows the spatial locations of IP hashes identified as anomalies.
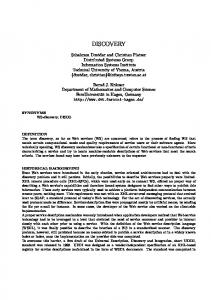
Figure 2. This is a view of one of the Angle models. Squares represent emergent clusters, while circles represent regular clusters. The Angle system currently has over 10,000 separate models that can be selected and used to look for anomalies and emergent behavior in near real time or from historical data.
To use the interface, the first task for the user is to select a model to determine emergent behavior. This is accomplished using the lower-right Model View panel of the interface. Next, the user selects the type of comparison to occur (Prior clusters, Common clusters or Daily average) and the data capture location for Angle to use for signaling emergent behavior. Data sets captured at any interval may be specified to search for emergent clusters.
Figure 3. In the map view above of emergent behavior, once a model is selected, emergent or anomalous IPs are identified in pink. Once emergent behavior is located, a user can determine which IP address hashes (IPhash) are involved in the anomalous activity. The upper Map View panel, showing a map of the world, is utilized to place anomalous IPhashes onto the world map. The angle score slider at the upperright corner of the panel controls the threshold of Angle scores to be visualized. The user can experiment with this slider, starting it near 0, and moving it up to filter visualization of low-scoring IPhashes. Clicking on red circular icons reveals information about the selected IPhash.
5
Status
Angle Sensors are currently installed at four locations: the University of Illinois at Chicago, the University of Chicago, Argonne National Laboratory and the ISI/University of Southern California. Each day, Angle processes approximately 575 pcap files totaling approximately 7.6GB and 97 million packets. By the time of the NGDM 2007 Conference, the Angle Sector System will contain approximately 3.4TB of pcap files, 43.7e9 packets, and 53,000 K means clustering models. We expect additional organizations to join the Angle project during 2008, which will provide a larger and more interesting collection of data.
6
Lessons Learned
In the section, we summarize some of the lessons learned during the first year or so of the project during which we have developed a preliminary prototype of the Angle System.
Lesson 1. The current grid-based distributed computing infrastructure is well-suited for sharing cycles, but less suited for making discoveries using distributed data. With the Angle architecture, a persistent distributed infrastructure is used to store and manage the distributed data over a wide area high performance network (Sector). With Sector, computations can be performed locally use edge nodes or data may be moved using specialized protocols (UDT) when data is required to be co-located for computation. Lesson 2. Much of the power of Angle derives from the ability to work with many different analytic models (there are currently over 10,000 different models available for identifying emergent behavior). It has been recognized for some time the necessity of developing algorithms that scale as the number of records increases and as the number of dimensions increases. Applications such as Angle also show the desirability of developing algorithms and infrastructure that scale as the number of analytic models increase. Lesson 3. The Angle system is designed in a flexible way so that properly anonymized data can be shared, as well as models that contain no identifying information. Note that models built locally can be built on a richer set of features than models built on shared data. Even with this design, a great deal of effort was spent on developing policies and procedures so that anonymized data could be shared between organizations. This process substantially slowed the pace at which the project could proceed, which is an important lesson to keep in mind when designing projects that require sharing data.
7
Summary and Conclusion
In this project, we have described the Angle Project that identifies suspicious and anomalous flows in distributed IP data. Angle is noteworthy for several reasons. First, Angle employs a distributed computing architecture called Sector that is designed to provide persistent storage for large distributed data sets and to move the analytic computation to the data whenever possible. In contrast, many grid-based distributed computing systems are designed to move data to pools of compute servers when they become available. Second, the Angle middleware supports computing with a large number of different analytic models, an approach, which for some applications, can lead to discoveries that are quite difficult when just one or a few analytic models are used, as is usually done. Third, Angle introduces statistical algorithm for identifying new types of behavior that have not been previously seen. This is an example of what is sometimes called emergent behavior. Angle also employs visual analytic techniques for identifying emergent behavior.
References [1] I. Foster and C. Kessleman. The Grid: Blueprint for a New Computing Infrastructure. Morgan Kaufmann Publisher, second edition, 2003. [2] R. L. Grossman, Y. Gu, D. Handley, M. Sabala, J. Mambretti, A. Szalay, A. Thakar, K. Kumazoe, O. Yuji, M. Lee, Y. Kwon, and W. Seok. Data mining middleware for wide area high performance networks. Journal of Future Generation Computer Systems (FGCS), 22(8):940—948, 2006. [3] Y. Gu and R. L. Grossman. UDT: UDP-based data transfer for high-speed wide area networks. Computer Networks, page to appear, 2007. [4] A. Lazarevic, L. Ertoz, A. Ozgur, J. Srivastava, and V. Kumar. Evaluation of outlier detection schemes for detecting network intrusions. In Proceedings of the Third SIAM International Conference on Data Mining, San Francisco, CA, 2003. [5] Programming with pcap. www.tcpdump.org/pcap.htm, retrieved on September 1, 2007. [6] R project. www.r-project.org, retrieved on September 1, 2007. [7] L. L. Smarr, A. A. Chien, T. DeFanti, J. Leigh, and P. M. Papadopoulos. The optiputer. Commun. ACM, 46(11):58–67, 2003. [8] Snort. www.snort.com, retrieved on September 1, 2007. [9] I. Stoica, R. Morris, D. Karger, M. F. Kaashoek, and H. Balakrishnan. Chord: A scalable peer-to-peer lookup service for internet applications. In Proceedings of ACM SIGCOMM’01, pages 149—160, San Diego, CA, 2001.