January 2007 (vol. 8, no. 1), art. no. 0701-o1001 1541-4922 © 2007 IEEE Published by the IEEE Computer Society
Grid Computing
Distributed Graphics Pipelines on the Grid Ade J. Fewings • Technium CAST Nigel W. John • University of Wales, Bangor jgViz uses standard Grid technologies and Chromium cluster graphics software to schedule the best available distributed graphics pipeline. Visualization of large data sets using computer graphics techniques has become a mainstream requirement for many scientists and engineers. However, achieving interactive performance when rendering a complex visualization often requires high-performance computing facilities. One solution is to exploit real-time graphics accelerators, which are used in the full range of computing devices from games consoles and set-top boxes to supercomputers and advanced training simulators. Recent work has coupled these accelerators to enable parallel and distributed visualization.1 Developments in network connectivity and remote-resources access have also led to exciting new possibilities that can benefit highperformance visualization users. At the same time, the service infrastructure for distributed networks has produced the third generation of the connected world: the Grid.2 The development of Grid middleware such as the Globus toolkit has been instrumental in supporting a distributed supercomputing infrastructure. Key developments include information exchange systems3 and distributed data handling.4 jgViz, our Java-implemented Grid visualization system, uses Grid functionality to enable transparent access to reliable parallel graphics pipelines. Lightweight and highly portable, jgViz aims to be plug-andplay for the existing Grid resource allocation mechanism. Peter V. Coveney of the RealityGrid project defines Grid computing as “distributed computing performed transparently across multiple administrative domains.” We hypothesize that it’s possible to make practical use of a distributed graphics system that conforms to this definition.
Background and related work Parallel visualization and Grid systems have matured since the seminal works of Steven Molnar and his colleagues5 and Ian Foster and Carl Kesselman.6 The graphics accelerator market and the availability of high-performance, low-cost networking technologies have enabled construction of inexpensive, highperformance visualization clusters out of commodity components. Also, distributed computing’s development first into metacomputing and then into Grid computing provides solutions for the security, administration, scheduling, and data-transfer problems that traditionally accompany a geographically and administratively dispersed set of resources. The convergence of parallel visualization and Grid systems has made using distributed graphics pipelines on the Grid possible. Graphics clusters Chromium is a general-purpose system for enabling cluster visualization through a stream-processing architecture.7 It supports sort-first, sort-last, and hybrid parallel rendering using OpenGL (Open Graphics Library) as the underlying language. This enables it to run existing applications with little or no modification and to run Chromium-customized applications that exploit additional features. A Chromium rendering pipeline is configured as a directed acyclic graph made up of two principal node types: client nodes that host applications to produce graphics output, and server nodes that process such
IEEE Distributed Systems Online (vol. 8, no. 1), art. no. 0701-o1001
1
data streams. The basis of this configurable, customizable framework is stream processing units that run on server nodes, take in GL streams, and process them in some way. Commercial solutions for cluster visualization include x x x
ModViz’s Virtual Graphics Platform, an OpenGL cluster visualization system that dynamically instantiates render, composite, and display components as required; Sun Microsystems’ Sun Fire Visual Grid product, which networks high-end Sun graphics hardware; and IBM’s Deep Computing Visualization hardware, which aims at both cluster rendering and remote visualization.
Although these cluster systems are becoming more readily available, their cost still prohibits widespread use. Remote visualization systems Scientific visualization is either carried out on a user workstation after computation on a remote server or performed remotely and streamed over a network. Eric J. Luke and Charles D. Hansen describe a remote visualization framework that can deliver high frame rates and low latency, which are essential for interaction.8 The Griz remote rendering system9 achieves high frame rates by using the Quanta highperformance networking toolkit.10 Luc Renambot and his colleagues have used Griz across four graphics pipes, providing an output of 1,600 × 1,200 pixels at interactive frame rates (16–23 fps) over large geographic distances.9 Commercial solutions for remote visualization are also available, the best known being Silicon Graphics' OpenGL Vizserver. Typically, the visualization is computed on the server, which then sends only the graphics frame buffer’s contents to the client, compressed if necessary to improve transmission rates. Grid-based visualization systems Remote rendering systems typically lack the flexibility that the Grid aims to provide, so integrating visualization with Grid middleware is often desirable. John Shalf and E. Wes Bethel examine the Grid’s impact on visualization and analyze graphics pipelines that run entirely on a local PC, entirely on a cluster, and partly on a cluster.11 Their work shows that dynamic pipeline scheduling is required. Modular visualization environments (MVEs) are a natural choice for Grid adaptation. The gViz project12 has Grid-enabled IRIS Explorer, using the XML-based skML to describe visualization pipelines. The gViz library enables steering and communication between simulation and visualization components, both running on Grid resources. Other work includes the Grid visualization kernel, a middleware extension that lets a scientific visualization’s various components—data sources, simulation processes, and visualization clients—interconnect.13 GVK can dynamically change this visualization pipeline without user knowledge, adapting to changing network conditions. GVK is implemented as input and output modules for numerous MVEs, including OpenDX and AVS/Express. RealityGrid14 aims to facilitate computational studies of complex condensed-matter systems. RealityGrid applications are built in a three-component structure of simulation, visualization, and steering client. Scientists can interact with applications during runtime through the steering client and view a remote rendering of the output. The Resource Aware Visualization Environment is a Web-services-based, collaborative visualization tool.15 RAVE automatically discovers resources through the Web Services Definition Language standard and uses Java3D to enable either remote or local rendering. Off-screen rendering also occurs, although this restricts performance.
IEEE Distributed Systems Online (vol. 8, no. 1), art. no. 0701-o1001
2
jgViz architecture Such visualization systems effectively support scientific visualization over sometimes great distances. However, they don’t really provide for more tightly coupled, interactive, cluster-based systems in which nodes can be used individually. Ideally, a visualization infrastructure should be able to x x
assign resources for a tiled screen environment in which a single cluster node feeds each screen and enhance the resolution or frame rate on a single machine.
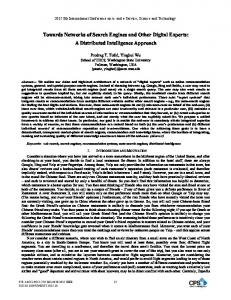
Current visualization systems don’t support interactive Grid-based OpenGL applications, however, and they often require purpose-built applications. Chromium is one of very few open source cluster solutions supporting OpenGL, but it isn’t compatible with Grid middleware. The jgViz approach uses Chromium to handle parallel graphics tasks and provides the missing components to enable the automatic discovery and use of graphics accelerators in a commodity Grid environment across fast networking technologies. jgViz also adapts to changing network conditions. The jgViz architecture is designed to be noninvasive, using standard Grid subsystems and protocols without customization. The overall structure is essentially a client-server system, with the Grid providing the middleware to connect the two. Within this structure, jgViz’s components are organized into three areas—the information model, sequencing and scheduling, and runtime—which flow naturally from one to the other (see figure 1).
Figure 1. The jgViz architecture organized into the information model components, sequencing and scheduling components, and runtime components.
Information model We designed the information model to allow parallel rendering tasks to be specified and appropriate Grid resources to be discovered. It also establishes the necessary communication between the server and client. Language. Describing a general-purpose visualization system is nontrivial.16 We require information about both the visualization resources available on a machine and a job’s resource requirements. Additionally, scheduling requires live data on current utilization and other changeable values. The gViz project studied representing such data in skML17 at three levels: x x x
The conceptual layer loosely explains the structure for visualization and collaboration. The logical layer maps the concepts to software entities. The physical layer maps the logical structure to a Grid environment.
skML has been used to integrate Grid resources into the pipelines of the gViz IRIS Explorer extension. The jgViz system is simpler than skML, however, and employs a schema that focuses on just those elements that create general-purpose parallel rendering in a distributed environment.
IEEE Distributed Systems Online (vol. 8, no. 1), art. no. 0701-o1001
3
Chromium uses its own syntax in configuring the nodes and stream-processing units (the two fundamental configuration elements within a Chromium session) that constitute a parallel graphics pipeline. We use this as a basis for jgViz. This concept maps into our Grid-based structure by letting machines advertise themselves as nodes that can provide a service with numerous possible configurations. These server nodes carry out the actual rendering and deal with three categories of data: x x x
The Chromium configuration data deals with how to configure each server as part of the pipeline. The additional server data deals with how the system will represent the physical environment (such as position in a tiled display). The server status data includes scheduling information relating to external factors such as machine load.
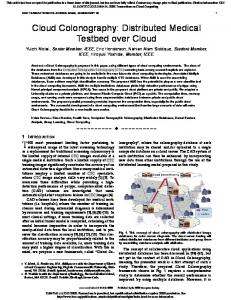
Server. A jgViz server is a Grid-enabled computer that can provide and advertise visualization capabilities. It achieves this using the Metacomputing Directory Service (MDS)3 alongside a custom Lightweight Data Access Protocol schema and an OpenLDAP back-end information provider. The latter is a C program that outputs LDAP Interchange Format data for each jgViz configuration, which then becomes a part of the LDAP database. The three data types are generated differently as appropriate. For example, live load data is generated automatically, whereas tile-group data is contained in a configuration file, and Chromium configuration data can be extracted from an existing Chromium configuration. The information provider back end reads these files and advertises the n defined configurations as 0 through (n í 1), letting the administrator offer as many configurations as required. Multiple configurations are advertised in a tree structure with n branches. As part of this, jgViz servers specify their capabilities (and policies) in terms of whether they’re willing to execute graphical programs (application servers) or act as one of two types of graphicsrendering server (renderers involved in readback or tiled display configurations). The administrator can also mark configurations as read only, restricting access to that resource, or as read-write, letting the end user modify parts of the configuration. The jgViz client enforces this security policy. Resource discovery and scoping in jgViz are thus managed by using the MDS hierarchy of the Grid Resource Information Service (GRIS) and Grid Index Information System (GIIS) servers. Any MDS servers that don’t recognize the jgViz schema will silently drop associated data, and you can configure the OpenLDAP server to forward such data only within certain organization blocks. The administrator must also configure a jgViz server at the operating system level to allow access to its graphics hardware, which isn’t allowed by default. We open up full access to the local X server, although a more restricted version could use securely published secret keys, such as xauth keys. The scheduling metrics currently handle contention for access to graphics resources, but we anticipate that future versions of the system will use a more robust approach. Client. The jgViz client is a graphical Java application that uses the Commodity Grid Toolkit18 to access Grid resources (see figure 2). The user can discover available Grid visualization resources in one of two ways. If the user wants to use jgViz to launch an application on a known distributed graphics pipeline, then the jgViz software can perform discovery of available resources on a single machine. Alternatively, all of an organization’s available resources can be discovered through jgViz by searching an index server (GIIS). The client queries the MDS servers for the MdsVizData object class of LDAP entries and recursively extracts known configurations. jgViz’s scheduling stage also takes place in the client.
IEEE Distributed Systems Online (vol. 8, no. 1), art. no. 0701-o1001
4
Figure 2. The jgViz GUI showing scheduling options. Other tabs let the user access information and configure the Chromium mothership, the available nodes, and the application node.
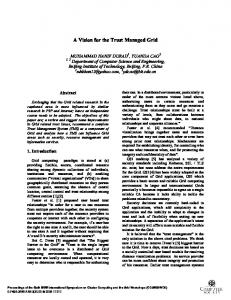
Sequencing and scheduling Figure 3 shows the information flow for scheduling. The resource discovery process outputs the collection of available nodes, which are the machines located through the Grid index search. Once the discovery phase has ended (at the user’s discretion), the client begins to periodically update the “live” data element for each discovered node. Two basic data categories are included in the live update: the remote system load as a proportion of its capability and the network latency. To obtain load information, jgViz queries the GRIS server on the remote node, thus trying to bypass any intermediaries. When jgViz calculates network latency, we assume that enough bandwidth will exist in an organization’s point-to-point links. jgViz continually sends ICMP (Internet Control Message Protocol) Echo packets to measure the latency and establish a consistent average value.
IEEE Distributed Systems Online (vol. 8, no. 1), art. no. 0701-o1001
5
Figure 3. Scheduling flow in jgViz. Information is collected on available nodes and then used to optimize the selection of the active node that will handle tiled display or readback rendering.
Scheduling requires the user to select a few basic pipeline parameters. Mandatory are the type of pipeline (either a tiled wall display or a parallel readback to a single screen), the number of server nodes required, and the output resolution. To schedule a parallel readback system, jgViz chooses the best selection of available machines. To schedule a tiled display, jgViz will group together and then average all the nodes involved. A simple scoring system determines the best solution by measuring and evaluating the two performance metrics independently for each node and providing a score for that node. To simplify user interaction, jgViz has predefined boundaries in each category alongside predefined default scores for each. The user can customize these scores. Once the tiled groups or individual nodes have each been scored, those with the lowest scores become the active nodes. A Chromium session is instantiated through a component called the “mothership.” The mothership is realized as a Python script and deals with configuring and managing a distributed OpenGL session. jgViz automatically generates this Python script from the discovered resource data (including ordering a tiled display correctly). Runtime Turning a scheduled graphics pipeline configuration into a running jgViz system is a two-stage process. The prelaunch stage initializes the distributed graphics pipeline. The postlaunch stage monitors the pipeline and reacts to any changes. With its modular architecture, Chromium fits perfectly in our distributed Grid infrastructure. Providing “dumb” components that rely on communication with a mothership reduces the setup involved in launching them. Additionally, Chromium provides scope for customization and future development in areas such as which network protocols to use. Owing to performance requirements, using Grid native protocols to transfer the data between the Chromium components isn’t possible,14 but we expect it will be in the future. For now, data is transferred using Chromium’s native socket architecture. Prelaunch. Accessing remote graphics resources isn’t straightforward. Beyond the problem of determining whether a remote graphics resource is already being used (which we aim to support in future versions of jgViz), granting permission to access the graphics hardware presents obvious problems. A simple workaround is for remote resources to disable access control to graphics hardware at an obvious cost in terms of security. We’re investigating potential solutions for this security problem. To identify the nodes to launch, jgViz’s runtime component parses the configuration script and extracts the relevant data. This enables the user to customize the automatically generated script if desired. We realize, however, that this feature wouldn’t be wholly beneficial in a less tightly controllable production system. Secure data transfer and machine access are fundamental requirements for Grid resources. Before launching the actual pipeline components on the Grid, jgViz attempts to verify Grid connectivity by
IEEE Distributed Systems Online (vol. 8, no. 1), art. no. 0701-o1001
6
sending a GRAM (Globus Resource Allocation Manager) ping to each machine involved. A failure will cause jgViz to delay launching the pipeline and attempt to reschedule the pipeline without the failed node. As figure 4 shows, once the system has successfully contacted all the nodes, execution can take place. jgViz transfers the configuration script and application binary to the remote systems, then launches the mothership and application node Chromium components. The file transfer takes place using the GridFTP protocol, and the executables are launched through the generation and submission of Resource Specification Language (RSL) to each remote machine. Once both the mothership and application nodes are running, all other network nodes are started, and the pipeline begins functioning.
Figure 4. The ordering involved in launching a jgViz session.
Use of the RSL syntax is critical in launching Chromium components remotely. It’s necessary to establish a number of environment variables, paths, and arguments, including the locations of OpenGL libraries, because Chromium must use a thread-safe variant that might not be the first in the default library search path (we found this to be the case particularly with nVidia graphics card drivers). Additionally, we use Global Access to Secondary Storage to transport stdout and stderr streams back from the Chromium nodes to the client via GASS servers on the client and syntax in the RSL. Postlaunch. Once jgViz has established a graphics pipeline, the client switches to the controlling and monitoring role. The control aspect lets the user stop the pipeline and reset the system via additional GRAM job submissions, reestablishing Grid connectivity. This uses specialized Chromium methods for terminating a session; just killing the Grid job could result in orphan processes continuing to run on remote systems. The client monitors the running pipeline for any significant changes in the network and machine load. jgViz repeatedly measures running nodes’ network latency and load levels and establishes consistent values for them. If they increase beyond a user-definable (but sensibly preset) proportion, the system will react appropriately. If the application is custom-built, the developer can make it keep state-related information in a temporary file. jgViz can access this file and rescue the data before shutting down the pipeline (see figure 5). If the application is just a stateless code with no state change (for example, a model viewer), then jgViz simply shuts the pipeline down. The system then goes back and reschedules the pipeline from the discovered available resources. If the jgViz system rescued a state file, it restores the data to the new application host, and the new pipeline starts as a continuation of the old one. Otherwise, the new pipeline is initialized with the application at its starting point. In either case, the jgViz client will obtain updated performance metric information for the available resources before rescheduling the pipeline.
IEEE Distributed Systems Online (vol. 8, no. 1), art. no. 0701-o1001
7
Figure 5. The jgViz client reschedules a pipeline.
As the following experimentation results quantify, monitoring a graphics pipeline can place (reasonable) demands on the jgViz client, and monitoring performance will drop off if the client is overstretched. We compared round-robin and concurrent monitoring and found that with more than 10 nodes, round-robin monitoring times were too long to maintain a responsive watch over running pipelines. Although concurrent monitoring substantially increases the performance requirement, it’s the only realistic choice for runtime monitoring. Round-robin, however, is useful for background metric gathering before a pipeline is launched. Scalability over large distributed systems (involving more than 30 nodes) requires further development.
Results We aim to effectively run an OpenGL application as a distributed graphics task over the Grid. The jgViz system will support any OpenGL 1.5-compliant application for this purpose. We chose a publicly available roller coaster simulation as the test application because it places variable-geometry demands on the graphics pipeline. The roller coaster tracks show different levels of detail depending on their distance from the “camera.” The velocity variation in the simulation and the variable rate of graphics rendering produce a good scenario for monitoring the pipeline performance. The pipeline is scheduled to provide the best performance in either a tiled-wall (as in figure 6) or readback-compositing configuration.
IEEE Distributed Systems Online (vol. 8, no. 1), art. no. 0701-o1001
8
Figure 6. Running a roller coaster application as a tiled pipeline.
jgViz uses four types of nodes: x x x
x
the client node, on which the jgViz client software runs; the application node, on which the Chromium application faker hosts the application; rendering slave nodes, which render OpenGL commands and then either display the results locally (tiled pipelines) or read back the results and send them over the network to a compositor node (readback pipelines); and the compositor node, which receives multiple rendering streams, reassembles them, and displays them locally (readback pipeline only).
In our test environment, each of these nodes was a standard PC with AMD Athlon-3200+ CPUs (clock speed 2.2 GHz) and 1 Gbyte memory. Each ran Fedora Core Linux 4 and the X.org 6.8.3 X server. Seventeen nodes used modest ATI 7000 series graphics cards (which don’t currently support hardware rendering under Linux), with Tungsten Graphics’ MesaGL 6.2.1 DRI Radeon Driver (supporting OpenGL 1.2). The compositor node had a more powerful nVidia GeForce 3 graphics card supporting Linux driver version 1.0.7664 (OpenGL 1.5.3). The nodes were interconnected with a purpose-built network that we could configure to run over either Fast Ethernet (100 Mbytes/sec) using a 3Com 4300 switch or Gbit Ethernet (1,000 Mbytes/sec) using a Cisco Catalyst 4006 for switching. This was an isolated network and didn’t carry any other traffic during testing. Software components consisted of the Globus toolkit v2.43, Chromium v1.8, and the jgViz software. Resource discovery was performed using the GIIS. Job launching was carried out through the GRAM and file transfer with the GridFTP service. A standard Chromium installation handled all graphics work, and the jgViz client or running application handled user interaction.
IEEE Distributed Systems Online (vol. 8, no. 1), art. no. 0701-o1001
9
We took measurements multiple times in two separate sittings and then averaged them. You can use many metrics to monitor distributed graphics pipelines. We focused on evaluating the effect of the jgViz system—specifically, the parts that initiate graphics pipelines and those that keep the pipelines healthy. We took into account the rendering frame rate and CPU, memory, and network statistics. A more detailed discussion appears elsewhere.19 Rescheduling performance Reschedule time is that which elapses between an event triggering to show that a pipeline is no longer operating optimally and the pipeline being stopped, rescheduled (including updating node metrics), and restarted on a new set of machines. For this experiment, we adjusted the parameters of the postlaunch stage to have a very low tolerance, which triggered such an event and forced jgViz to react. Figure 7 shows how reschedule time scales linearly with node count.
Figure 7. Pipeline reschedule time of (a) tiled and (b) readback pipelines.
In both tiled and readback scenarios, it takes approximately 40 seconds to x x x x
stop the old pipeline (involving stopping the mothership and killing the application via Grid jobs), refresh metrics data on available nodes, transfer the new configuration to the new mothership, and launch both the new mothership and application nodes.
The fluctuations in the Fast Ethernet graphs after eight nodes are due to the network becoming bandwidth limited. The overhead time in a readback pipeline is a few seconds longer because of the launching of the additional compositor node. The network speed makes little difference here because the first node the system stops is the application node, at which point the entire pipeline stops, effectively clearing the network. Tiled versus readback performance Providing a consistent, adequate frame rate is important for interactive visualization—10 to 15 fps is generally the minimum requirement.20 Frame rate is particularly sensitive to both the pipeline type and the network speed—note the contrast in figure 8. With tiled pipelines, Gbit connectivity gives acceptable performance. The frame rate falls linearly after eight nodes, but even at 16 nodes, more than 12 fps is achieved. Fast Ethernet, however, quickly falls below an acceptable frame rate as the network bandwidth becomes a limiting factor at the application node (where the scene is split and sent to the render slaves). We could employ a maximum of 16 rendering slaves for this experiment. At this point, the high CPU load
IEEE Distributed Systems Online (vol. 8, no. 1), art. no. 0701-o1001
10
on the application node managing the tiling process becomes the bottleneck (see the next section). However, using a more powerful PC for this task would let us support more nodes.
Figure 8. jgViz frame rate on (a) tiled and (b) readback pipelines.
Readback results are more prohibitive and indicate network limitations. Fast Ethernet performance provided only around 1 fps throughout the experiment. Gbit performance is also too slow (4.5 to 6 fps). Interestingly, performance here improves as more nodes become available; indicating that lowering the load at each render node reduces the overhead of data that must be transferred between any two hosts (render slave and compositor). In considering results for any rated network speed, we must remember that the actual performance will likely differ from the theoretical and that performance over a duration of one second isn’t defined well enough for a visualization job running at a rate in excess of several fps. Readback performance benefits greatly from improved network performance, both in latency (each frame component is subject to the latency twice) and bandwidth (getting multiple frame components to a compositor node as simultaneously and quickly as possible). Low-level effects CPU statistics at each node can also help identify bottlenecks in a pipeline. Figure 9 summarizes such statistics when using a Gbit network.
IEEE Distributed Systems Online (vol. 8, no. 1), art. no. 0701-o1001
11
Figure 9. Node CPU statistics for (a) a jgViz client node, (b) an application node, (c) a slave render node, and (d) a compositor node.
The application node shows different performance characteristics in the two pipeline types. As the number of nodes increases, a tiled pipeline requires more processing time from the application node. However, a readback pipeline performs similarly only up to a point, reflecting a bottleneck further down the pipeline at the compositor node. The system and user times increase linearly, as we would expect for both pipeline types, whereas the level of waitIO time (that is, how long the CPU waits for I/O) reflects the pipeline load reaching maximum, resulting in increased delays in distributing data. Slave render nodes show increasing idle time as the number of nodes increases in both pipeline types, reflecting that they individually have less work to do. Readback pipelines’ limitation with increasing numbers of nodes is also clear, with the peak user time being at the lowest number of nodes, whereas the tiled-pipeline user time peaks at eight nodes and falls off gradually. This highlights the scalability limitation that a bottleneck in the later stages of a readback pipeline causes.
IEEE Distributed Systems Online (vol. 8, no. 1), art. no. 0701-o1001
12
In readback pipelines alone, network latency heavily limits compositor node performance. At this stage of the pipeline, the amount of data being transferred is consistent for different resolutions of output, whereas at the earlier geometry distribution stage it varies, depending on the application. Different applications will create different relationships in the balance of these two pipeline pinch-points. In particular, heavy use of texture data in an application would greatly affect the initial distribution (although Chromium optimizations would minimize redundant communication). Our approach differs from a remote visualization solution such as OpenGL Vizserver. In such solutions, a single high-performance computer runs the visualization task, typically offering a fixed set of graphics resources and limited fault tolerance. jgViz is closer in functionality to systems such as RAVE—both support Grid-enabled visualization, and our performance results are comparable to RAVE’s.15 However, we believe that jgViz is more generally applicable because it supports (through Chromium) OpenGL applications rather than Java3D. Our results show that you can use commodity PC hardware for distributed graphics visualization within a Grid—for example, in the form of a tiled display (see figure 6). The main limitation is network bandwidth. Fast Ethernet at 100 Mbits/sec couldn’t sustain real-time synchronized transfer of the graphics data to the displays. This is a disadvantage when compared to the remote-rendering approach, where our previous work with OpenGL Vizserver has shown that Fast Ethernet is sufficient.21 Gigabit Ethernet demonstrated real-time performance for jgViz tiled configurations and actually shows some speedup when the number of render nodes in the pipeline increases. Rescheduling a pipeline involves some inherent delay, which becomes prohibitive when larger numbers of nodes are involved; this remains a problem. We have many plans for jgViz’s future development, principally in areas that improve scheduling and monitoring. We believe that we could integrate a simple metadata-based system to describe application requirements, which would provide more automation for user interaction. We could also develop a Webbased interface using Java. Provided that suitable graphics resources are available on demand, users could then launch OpenGL applications from anywhere on the Internet. We also intend to develop added functionality, principally through support for more of Chromium’s ever-growing capabilities. Finally, as we aim for ever more distributed resource utilization, concerns regarding data security and integrity dictate using Grid protocols to transport graphics data throughout the running pipeline. However, this will likely require customizing the Chromium code and analyzing the performance impact. Our approach differs from a remote visualization solution such as OpenGL Vizserver. In such solutions, a single high-performance computer runs the visualization task, typically offering a fixed set of graphics resources and limited fault tolerance. jgViz is closer in functionality to systems such as RAVE—both support Grid-enabled visualization, and our performance results are comparable to RAVE’s.15 However, we believe that jgViz is more generally applicable because it supports (through Chromium) OpenGL applications rather than Java3D. Our results show that you can use commodity PC hardware for distributed graphics visualization within a Grid—for example, in the form of a tiled display (see figure 6). The main limitation is network bandwidth. Fast Ethernet at 100 Mbits/sec couldn’t sustain real-time synchronized transfer of the graphics data to the displays. This is a disadvantage when compared to the remote-rendering approach, where our previous work with OpenGL Vizserver has shown that Fast Ethernet is sufficient.21 Gigabit Ethernet demonstrated real-time performance for jgViz tiled configurations and actually shows some speedup when the number of render nodes in the pipeline increases. Rescheduling a pipeline involves some inherent delay, which becomes prohibitive when larger numbers of nodes are involved; this remains a problem. We have many plans for jgViz’s future development, principally in areas that improve scheduling and monitoring. We believe that we could integrate a simple metadata-based system to describe application requirements, which would provide more automation for user interaction. We could also develop a Webbased interface using Java. Provided that suitable graphics resources are available on demand, users could then launch OpenGL applications from anywhere on the Internet. We also intend to develop added functionality, principally through support for more of Chromium’s ever-growing capabilities. Finally, as we aim for ever more distributed resource utilization, concerns regarding data security and integrity dictate using Grid protocols to transport graphics data throughout the running pipeline. However, this will likely require customizing the Chromium code and analyzing the performance impact. IEEE Distributed Systems Online (vol. 8, no. 1), art. no. 0701-o1001
13
Overall, we believe that jgViz demonstrates our hypothesis. The system bridges the two traditional approaches for visualization tools—client-side and network-side processing. This is important if visualization tools are to be used in a seamless environment. jgViz also demonstrates excellent performance in terms of memory utilization, CPU utilization, and monitoring cycle time. Alongside other projects, we envision an environment that handles all conceivable types of rendering problems and intelligently brings dynamic Grid resources to bear on them. Applications in areas beyond science and research are also possible. More information on the project is available at www.hpv.informatics.bangor.ac.uk/jgviz.php.
References 1.
K. Brodlie et al., “Visual Supercomputing—Technologies, Applications, and Challenges,” Computer Graphics Forum, vol.24, no. 2, 2005, pp. 217–245.
2.
I. Foster, “The Grid: A New Infrastructure for 21st Century Science,” Physics Today, vol. 55, no. 2, 2002, p. 42.
3.
K. Czajkowski et al., “Grid Information Services for Distributed Resource Sharing,” Proc. 10th IEEE Int’l Symp. High-Performance Distributed Computing (HPDC 10), IEEE CS Press, 2001, pp. 181–194.
4.
J. Bester et al., “GASS: A Data Movement and Access Service for Wide Area Computing Systems,” Proc. 6th Workshop Input/Output in Parallel and Distributed Systems (Iopads 99), ACM Press, 1999, pp. 78–88.
5.
S. Molnar et al., “A Sorting Classification of Parallel Rendering,” IEEE Computer Graphics and Applications, vol. 14, no. 4, 1994, pp. 23–32.
6.
I. Foster and C. Kesselman, “Globus: A Meta-Computing Infrastructure Toolkit,” Int’l J. Supercomputer Applications and High Performance Computing, vol.11, no. 2, 1997, pp. 115–128.
7.
G. Humphreys et al., “Chromium: A Stream-Processing Framework for Interactive Rendering on Clusters,” ACM Trans. Graphics, vol. 21, no. 3, 2002, pp. 693–702.
8.
E.J. Luke and C.D. Hansen, “Semotus Visum: A Flexible Remote Visualization Framework,” Proc. 13th IEEE Conf. Visualization (VIS 02), IEEE CS Press, 2002, pp. 61–68.
9.
L. Renambot et al., “Griz: Experience with Remote Visualization over an Optical Grid,” Future Generation Computer Systems, vol. 19, no. 6, 2003, pp. 871–882.
10. E. He et al., “Quanta: A Toolkit for High Performance Data Delivery over Photonic Networks,” Future Generation Computer Systems, vol. 19, no. 6, 2003, pp. 919–933. 11. J. Shalf and E.W. Bethel, “The Grid and Future Visualization System Architectures,” IEEE Computer Graphics and Applications, vol. 23, no. 2, 2003, pp. 6–9. 12. K. Brodlie et al., “Visualization in Grid Computing Environments,” Proc. IEEE Conf. Visualization (VIS 04), IEEE CS Press, 2004, pp. 155–162. 13. P. Heinzlreiter and D. Kranzlmuller, “Visualization Services on the Grid: The Grid Visualization Kernel,” Parallel Processing Letters, vol. 13, no. 2, 2003, pp. 135–148. 14. J.M. Brooke et al., “Computational Steering in RealityGrid,” Proc. UK e-Science All Hands Meeting, 2003; www.nesc.ac.uk/events/ahm2003/AHMCD/pdf/179.pdf. 15. I.J. Grimstead, N.J. Avis, and D.W. Walker, “Automatic Distribution of Rendering Workloads in a Grid-Enabled Collaborative Visualization Environment,” Proc. 2004 ACM/IEEE Conf. Supercomputing, IEEE CS Press, 2004, p. 1. 16. J. Domingue, B.A. Price, and M. Eisenstadt, “A Framework for Describing and Implementing Software Visualization Systems,” Proc. Graphics Interface 92, Canadian Information Processing Soc., 1992, pp. 53–60. 17. D. Duce and M. Sagar, “skml: A Markup Language for Distributed Collaborative Visualization,” Proc. Theory and Practice of Computer Graphics 2005, Eurographics Assoc., 2005, pp. 171–178. 18. G. Von Laszewski et al., “A Java Commodity Grid Kit,” Concurrency and Computation: Practice and Experience, vol.13, nos. 8–9, 2001, pp. 643–662. 19. A.J. Fewings, “Real-Time and Interactive Computer Graphics in Grid Environments,” PhD thesis, School of Computer Science, Univ. of Wales, Bangor, 2006. 20. R.T. Apteker et al., “Video Acceptability and Frame Rate,” IEEE Multimedia, vol. 2, no. 3, 1993, pp. 32–40. 21. N.W. John, R.F. McCloy, and S. Herrman, “Interrogation of Patient Data Delivered to the Operating Theatre during Hepato-Pancreatic Surgery using High Performance Computing,” Computer Aided Surgery, vol. 9, no. 6, 2004, pp. 235–242.
IEEE Distributed Systems Online (vol. 8, no. 1), art. no. 0701-o1001
14
Ade J. Fewings is a visualization engineer at Technium CAST (Centre for Advanced Software Technology), a technology-led business incubation environment. His research interests are in visualization in distributed systems, particularly involving Grid and parallel graphics technologies. He received his PhD in computer science from the University of Wales, Bangor. Contact him at Technium CAST, Parc Menai, Bangor LL57 4HJ, Wales, UK;
[email protected].
Nigel W. John holds a chair in computing at the University of Wales, Bangor. His research interests include high-performance visualization and medical graphics. He received his PhD in mathematical sciences from the University of Bath. He’s a member of the Eurographics Association and is chair of the Eurographics Professional Board. Contact him at the School of Computer Science, Univ. of Wales, Bangor, Dean St., Bangor LL57 1UT, Wales, UK;
[email protected].
Related Links
x x x
DS Online's Grid Computing Community "Grid-Distributed Visualizations Using Connectionless Protocols," IEEE Computer Graphics and Applications "Deploying Web-Based Visual Exploration Tools on the Grid," IEEE Computer Graphics and Applications
Cite this article: Ade J. Fewings and Nigel W. John, "Distributed Graphics Pipelines on the Grid," IEEE Distributed Systems Online, vol. 8, no. 1, 2007, art. no. 0701-o1001.
IEEE Distributed Systems Online (vol. 8, no. 1), art. no. 0701-o1001
15