Faculty of Sciences, University of Amsterdam ... {sloot,jaapk,alfons,bjo}@wins.uva.nl ... many particle system, or cellular automaton method with a macroscopic behav- ...... Greek indices (e.g. in two dimensions âαciαNi = âxcixNi + âyciyNi).
Distributed Simulation with Cellular Automata: Architecture and Applications P. M. A. Sloot, J. A. Kaandorp, A. G. Hoekstra, and B. J. Overeinder Faculty of Sciences, University of Amsterdam Section Computational Science Kruislaan 403, 1098 SJ Amsterdam, The Netherlands {sloot,jaapk,alfons,bjo}@wins.uva.nl www.wins.uva.nl/research/scs/
1
Introduction
Many fundamental problems from natural sciences deal with complex systems. We define a complex system as a population of unique elements with well defined microscopic attributes and interactions, showing emerging macroscopic behavior. This emergent behavior can, in general, not be predicted from the individual elements and their interactions. A typical example of emergent behavior is selforganization, e.g. Turing patterns in reaction-diffusion systems. Complex systems are often irreducible1 and can not be solved in an analytical way. The only available option to obtain more insight into these systems is through explicit simulation. Many of these problems are intractable: in order to obtain the required macroscopic information, extensive and computationally expensive simulation is necessary. Since simulation models of complex systems require an enormous computational effort, the only feasible way is to apply massively parallel computation. A major challenge is to apply High Performance Computing in research on complex systems and, in addition, to offer a parallel computing environment that is easily accessible for applications [62,63]. Traditionally, science has studied the properties of large systems composed of basic entities that obey simple microscopic equations reflecting the fundamental laws of nature. These natural systems may be studied by computer simulations in a variety of ways. Generally, the first step in any computer simulation is to develop some continuous mathematical model that is subsequently discretized for implementation on a computer. An alternative, less widely used approach is to develop solvers that conserve the characteristic intrinsic parallel properties of the applications and that allow for optimal mapping to a massively parallel computing system. These solvers have the properties that they map the parallelism in the application via a simple transformation to the parallelism in the machine. With these transformations the necessity to express the application into complex mathematical formulations becomes obsolete. One example is the modeling of a fluid flow. Traditionally this problem is simulated through mathematical description of the phenomenon via Navier-Stokes 1
Irreducible problems can only be solved by direct simulation
J. Pavelka, G. Tel, M. Bartoˇ sek (Eds.): SOFSEM’99, LNCS 1725, pp. 203–248, 1999. c Springer-Verlag Berlin Heidelberg 1999
204
P. M. A. Sloot et al.
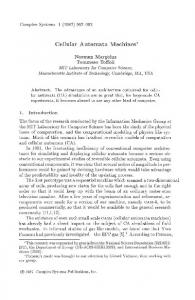
equations, and discretization of these equations into numerical constructs for algorithmic presentation on a computer. This process of simulation involves a number of approximations and abstractions to the real fluid flow problem: intrinsic properties and explicit information of the physical phenomenon is obscured. Even worse, the possible implicit parallelism of the problem becomes completely indistinct in the abstraction process. An alternative approach would be to model the microscopic properties of the fluid flow with cellular automata, where the macroscopic processes of interest can be explored through computer simulation. This approach has the advantage that the physical characteristics of the fluid flow problem remain visible in the solving method and that the method conserves the parallelism in the problem. Although this type of simulation methods is not yet completely understood and certainly not fully exploited, it is of crucial importance when massively parallel computers are concerned. We define this type of solvers as natural solvers. These techniques have in common that they are inspired by processes from nature [64]. Important examples of natural solvers are Genetic Algorithms (inspired by the process of natural selection), Simulated Annealing (inspired by the process of cooling heated material which converges to a state of minimal energy), Lattice Gases and the Lattice Boltzmann method (a many particle system, or cellular automaton method with a macroscopic behavior that corresponds to the hydrodynamic equations), and artificial Neural Networks. We argue that in parallel computing the class of natural solvers results in a very promising approach, since the physical characteristics of the original phenomenon remain visible in the solving method and the implicit and explicit parallelism of the problem remain conserved. In Fig. 1 a “bird’s eye view” of the different steps of the mapping process from application to parallel machines is presented. As can be seen, an application is first transformed into a solver method. Here, detailed knowledge of the problem domain is obligatory. Next, the intrinsic parallelism in the solver is passed through the Decomposition layer that captures the parallelism and dependencies into objects and communication relationships. Finally these two classes are mapped onto a Virtual Parallel Machine model that allows for implementation on a large suite of parallel systems [52]. To be able to capture the generic aspects of parallel solvers and to express the basic properties of the natural system, we will define our own abstract solver model indicated as the Virtual Particle model. The Virtual Particle (VIP) can be defined as the basic element in the simulation model. The VIP can be defined on several levels of abstraction. For example in a simulation model of a biological system, the VIP can correspond to a certain level of organization and aggregation in the system (e.g. molecule-organelle-cell-tissue-organ-organismpopulation). The choice of the abstraction level is determined by a combination of the desired refining of the model and the computational requirements. In the VIP model the microscopic, temporal or spatial, rules have to be specified in such a way that they approximate the microscopic rules as observed in the actual system. In the VIP model, the VIPs may correspond to the individual particles in the natural solver, as for example in lattice gases. Alternatively,
Distributed Simulation with Cellular Automata
205
Application Transforms
Cellular Automata
Monte Carlo
Neural Networks
Molecular Dynamics
Simulated Annealing
Genetic Algorithms
[Hierarchical] Decomposition
Virtual Massive Parallel Machine
Workstation Cluster
Cray T3D
IBM SP2
Fig. 1. Outline of a Parallel Programming Model for Dynamic Complex Systems on Massively Parallel Computers
the particles can be organized hierarchically, where VIPs can be an individual particle or clusters of VIPs. The application model is mapped onto the Virtual Parallel Machine Model (see Fig. 2), which can be another instance of a dynamic complex system consisting of a population of processors. In this case both load balancing and minimization of communication can be taken into account in a graph representation [56,59]. In this paper we will focus on cellular automata methods for modeling phenomena from natural sciences. In Section 2 the theoretical background of Cellular Automata (CA) will be briefly discussed. In Section 3 different execution models for CA will be discussed. Section 4 presents an example of a very specific CA that can be used as a model of fluid flow. In Section 5 we will demonstrate the use of two types of execution models. The first application shows how synchronous cellular automata can model growth processes in a moving fluid. The second application demonstrates an asynchronous execution scheme for a continuous-time Ising spin model.
206
P. M. A. Sloot et al.
MPP Platforms
Applications
Virtual MPP Machine Model
Virtual Particle Models
DCS Internal transformation Explicit transformation rules
Fig. 2. Basic structure of Dynamic Complex System Paradigm: the mapping of the application model onto the machine model. The internal transformation denotes the mapping of the application graph onto the machine graph
2 2.1
Background of Cellular Automata Concepts Introduction
Cellular Automata are discrete, decentralized, and spatially extended systems consisting of large numbers of simple identical components with local connectivity. The meaning of discrete here is, that space, time, and features of an automaton can have only a finite number of states. The rational of cellular automata is not to try to describe a complex system from a global point of view as it is described using for instance differential equations, but modeling this system starting from the elementary dynamics of its interacting parts. In other words, not to describe a complex system with complex equations, but let the complexity emerge by interaction of simple individuals following simple rules. In this way, a physical process may be naturally represented as a computational process and directly simulated on a computer. The original concept of cellular automata was introduced by von Neumann and Ulam to model biological reproduction and crystal growth respectively [66,68]. Von Neumann was interested in the connections between biology and computation. Specifically the biological phenomenon of self-reproduction modeled by automata triggered his research in this field. According to Burks [7], Stanislaw Ulam suggested the notion of cellular automata to von Neumann as a possible concept to study self-reproduction. Since then it has been applied to model a wide variety of (complex) systems, in particular physical systems containing many discrete elements with local interactions [44,73]. Cellular Automata have been used to model fluid flow, galaxy
Distributed Simulation with Cellular Automata
207
formation, biological pattern formation, avalanches, traffic jams, parallel computers, earthquakes, and many more. In these examples, simple microscopic rules display macroscopic emergent behavior. For some Cellular Automata it can be proven that they are equivalent to Universal Computers, thus in principle able to compute any given algorithm, comparable to Turings Universal Computing Machine (see for instance [5]). Furthermore Cellular Automata can provide an alternative to differential equations for the modeling of physical systems. It is this combination of – – – – –
simple local rules, association with universal computing automata, alternative to differential equations, models of complex systems with emergent behavior, and bridging the gap between microscopic rules and macroscopic observables
that has renewed interest in Cellular Automata (CA’s). The locality in the rules facilitate parallel implementations based on domain decomposition, the Universal Computing behavior supports fundamental research into the intrinsics of computation in CA’s, and the modeling power of CA’s is of utmost importance to study a huge variety of complex systems. Although John von Neumann introduced the cellular automata theory several decades ago, only in recent years it became significant as a method for modeling and simulation of complex systems. This occurred due to the implementation of cellular automata on massively parallel computers. Based on the inherent parallelism of cellular automata, these new architectures made possible the design and development of high-performance software environments. These environments exploit the inherent parallelism of the CA model for efficient simulation of complex systems modeled by a large number of simple elements with local interactions. By means of these environments, cellular automata have been used recently to solve complex problems in many fields of science, engineering, computer science, and economy. In particular, parallel cellular automata models are successfully used in fluid dynamics, molecular dynamics, biology, genetics, chemistry, road traffic flow, cryptography, image processing, environmental modeling, and finance [65]. 2.2
Simple 1D Cellular Automata
A CA consists of two components: a lattice of N identical finite-state machines called cells, each with an identical pattern of local connections to other cells for input and output, and a transition rule. Let Σ denote the set of states in the cell’s finite state machine, and k = |Σ| denote the number of states per cell. The state of cell i at time t is denote by sti , with sti ∈ Σ. The state of cell i together with the states of the cells to which cell i is connected is called the neighborhood for each cell i nti of cell i. The transition rule φ (nti ) gives the updated state st+1 i as a function of nti . In a CA a global clock usually provides the update signal for all the cells; cells update their states synchronously. In Section 3 we will discuss the consequences of asynchronous updates.
208
P. M. A. Sloot et al.
Fig. 3. The “space-time” behavior of CA 110, where black = 0 and white = 1. Space is on the horizontal axis, time flows from top to bottom Consider for instance the following one-dimensional CA with k = 2 (i.e. Σ = {0, 1}) and a transition rule given by Neighborhood: 111 110 101 100 011 010 001 000 Output bit: 0 1 1 0 1 1 1 0
(1)
then the transition rule number (due to Wolfram [73]) is given by “110”, being the decimal representation of the output bit-string “01101110”. The “spacetime” behavior of CA 110 is shown in Fig. 3. Starting from a random initialization of the CA with length 250, the transition rule is iteratively applied 50 time steps. The “time” runs from top to bottom. For a one-dimensional CA the size of the neighborhood nti is given by 2r+1 with r the radius of the CA (in CA 110, r = 1). Wolfram studied in great detail the 256 possible one-dimensional k = 2, r = 1 CAs (so-called elementary CAs) and classified them accordingly to dynamical systems [72]. – Class 1: Fixed point behavior. Almost all initial configurations relax after a transient period to the same fixed configuration. – Class 2: Periodic behavior. Behavior like in class one but with temporally periodic cycles of configurations included. – Class 3: Chaotic behavior. Unpredictable space-time behavior. – Class 4: Complex behavior. Complicated localized patterns occur, sometimes “long-lived”. For infinite Class 4 CAs it is effectively undecidable whether a particular rule operating on a particular initial seed will ultimately lead to a frozen state or not, this is the CA analog of Turings Halting problem. It is speculated that all CAs with Class 4 behavior are capable of universal computation [72]. In 1990 it was shown by Lindgren and Nordahl for the first time that a one-dimensional CA (r = 1, k = 7) exhibit universal computing behavior [38]. If Class 4 CAs are capable of universal computing, then CA 110, shown in Fig. 3, is a very good elementary CA candidate for universal computation [37].
Distributed Simulation with Cellular Automata
2.3
209
Requirements for Computability in Cellular Automata
Some authors [13,35,72] suggest that when a system displays complex behavior, universal computations can be performed. Mechanically speaking a computational system requires transmission, storage and modification of information. So, whenever we identify those three components in some dynamical system, the system could be computationally universal. But then the question remains when does this happen? Loosely speaking we can say, using information theoretical results, that it must take place at an intermediate level of entropy: stored information lowers the entropy, but transmission of information increases the entropy level. Therefore we will briefly review entropy measures of Cellular Automata in Section 2.3.1. In a number of papers, Christopher Langton has tried to answer this question by considering Cellular Automata as a theoretical model for a physical system. The hypothesis “Computation at the Edge of Chaos” resulted from this research. Briefly it states that universal computations can take place at the border between order and chaos. This statement partly resulted from the observation that correlations can become infinite during, or at a second order phase transition between, for example, a solid and a liquid phase. Recall that a discontinuous change in an order parameter of the system corresponds to a first order transition. A sudden, but continuous, change corresponds to a second order transition. At such a transition, the system is in a critical state. Langton and Kauffman [33,35] believe that the resulting infinite correlations can be interpreted as long-term memory needed to store information. We will review these notions and recent objections to this hypothesis briefly in Section 2.3.2. 2.3.1 Information in CA In order to observe phase transitions in CA evolution, quantitative order parameters are needed. These order parameters need to distinguish between ordered and disordered states. A commonly used quantity for this purpose is the Shannon entropy [60], defined on a discrete probability distribution pi : X pi logpi (2) H=− i
This measure H can be associated with the degree of uncertainty about a system. In a Cellular Automata, entropy can be defined on the k N possible subsequences of N -length blocks in a k-state CA. In a random sequence all subsequences must occur with equal probability. With probabilities pi for the k N possible subsequences: N
HN = −
k X
pi logpi
(3)
i=1
The spatial block entropy [21] is now defined as: (x)
hN = HN +1 − HN
(4)
210
P. M. A. Sloot et al.
The superscripts (x) indicate that spatial sequences are considered. From Eq. 4 follows the spatial measure entropy, or entropy rate [21]: (x)
h(x) = lim hN N →∞
(5)
The measure entropy gives the average information content per site. Analogous to the spatial entropy, one can define temporal entropy, where blocks of N × T sites are considered: h(t) =
lim
N,T →∞
(t)
hN,T
(6)
(t)
Eq. 4 decreases monotonically with N , while hN,T decreases with T . The difference, (x)
(x)
(x)
δhN = hN − hN +1
(7)
is the amount of information by which a state si+N of a cell i + N becomes (x) less uncertain if the cell state si is known. δhN is called the N -th order mutual information in space. Intuitively one could regard mutual information as the stored information in one variable about another variable and the degree of predictability of a second variable by knowing the first. The space-time (random) processes that occur in deterministic CA can also be studied through Kolmogorov-Sinai entropy per unit time [19]: the so-called (ε, τ )-entropy 1 H(ε, τ, T, V ) , T V →∞ T V
hspace, time (ε, τ ) = lim
where H(T, V ) denotes the entropy of the process over a simulation time T and volume V . For instance H(T, V ) for rule 132 ∼ V log T and for rule 250 where the initial state is attracted towards spatially uniform (or periodic) configuration H(T, V ) ∼ log T V . In all cases the entropy per unit time and unit volume (hspace, time (ε, τ )) is vanishing. 2.3.2 Computation in Cellular Automata If we have a k-state CA with 2r+1 a neighborhood size r, the total number of possible transition rules is k k , which can become very large, even for a moderate number of states and/or a small neighborhood. If a structure is present in this enormous space, it should be possible to identify areas of equal complexity (i.e. the Wolfram classes) and show how these areas are connected to each other. Using this ordering one can locate those areas which support the transmission, storage and modification of information. Langton [35,36], suggested the parameter λ to structure the CA rule-space. An arbitrary state s ∈ Σ is assigned the quiescent state sq . Let there be n transitions to this quiescent state in an arbitrary transition rule. The remaining k r − n transitions are filled randomly by picking uniformly over the other k − 1 states: λ=
kr − n kr
(8)
Distributed Simulation with Cellular Automata
211
If λ = 0.0 then all transitions in the rule will be to the quiescent state sq . If λ = 1.0 there will be no transitions to sq . All states are represented equally in the rule if λ = 1 − 1/k. With the aid of the λ-parameter it should be possible to examine the assumption that complex behavior is located at the intermediate regime between ordered and disordered behavior. The spectrum of dynamical behavior can be explored with the so-called table-walk-through-method which increases the λ-parameter at successive time steps. At each new time step a transition table is incrementally updated using the transition table at the previous time step. Because the described method is actually a “random walk” through a coarse grained version of the CA state-space, each table-walk displays quantitatively different behavior. Several measures can be used to characterize the dynamical behavior of the CA at each new value of the λ-parameter. These measures include the numerical determination of block entropies, and both temporal and spatial mutual information statistics. At intermediate values of λ, i.e. at the edge between ordered and disordered dynamics, several events seem to occur: – transient lengths grow rapidly, analogously to the physical event of critical slowing down, – transient lengths depend exponentially on the size of the CA, – mutual information measures (see Eq. 7) reach their maximum values, see Fig. 4 (left), at the entropy transition, see Fig. 4 (right).
2
0.035
Entropy
Temporal mutual information 1.8
0.03 1.6 0.025
1.4 1.2
0.02
1 0.015
0.8
0.01
0.6 0.4
0.005 0
0.2 0
0.1
0.2
0.3
0.4
λ
0.5
0.6
0.7
0.8
0
0
0.1
0.2
0.3
0.4
0.5
0.6
0.7
0.8
λ
Fig. 4. Temporal mutual information between two sites separated by one time step, and site entropy, both for 4-state 2-neighbor Cellular Automata The exponential dependence of transient lengths on the size of the CA is analogous to the exponential dependence on problem size in the NP and PSPACE complexity classes. As for the halting-computations, it will be formally undecidable for an arbitrary CA in the vicinity of a phase transition whether transients will ever die out. The increase in mutual information indicates that the correlation length is growing, which implies further evidence for a phase transition in that region. Of course we cannot observe a real phase transition other than in the
212
P. M. A. Sloot et al.
thermodynamic limit. Other discussions for the “Edge of chaos” hypothesis can be found in the work of Crutchfield on continuous dynamical systems [12] and the resulting �-machine reconstruction. In [14] the so-called intrinsic computation abilities of a continuous dynamical system are investigated. This term refers to structures that emerge in a system’s behavior that can be understood in computational terms. The output of the system (e.g. an iterative map, xn+1 = f (xn )) in time is coarse grained into a sequence of zeros and ones. In other words the output domain xn is divided into two regions, P0 = {xn < xc } and P1 = {xn ≥ xc }, where xc is an arbitrary chosen division point. The complexity of the dynamical system is quantified by construction of the minimal regular language which accepts the generated sequence. The complexity and entropy (see Eq. 2) for the logistic map was examined in [14] using the method of regular language complexity (size of the corresponding finite automaton). It was found that the lowest values of complexity corresponds to the periodic and fully chaotic regimes of the map. The highest value of the complexity occurs where the period doubling cascade of the map meets the band-merging cascade, i.e. at the border between order and chaos. In [17] the work of Langton and Crutchfield is complemented by examining the dynamical behavior of a well-known computational device: the Turing Machines (TM). A class of 7-state 4-symbol Turing machines, which also includes Minsky’s universal Turing machine [46], was used to address the question whether universal computation is found between order and chaos. A large number of randomly created TM’s was used to generate three different sequences: a sequence of symbols read, a sequence of states and a sequence of moves made by the TM head. For all these sequences, the corresponding regular language complexity was calculated using the technique of �-machine reconstruction and plotted against its block-entropy (see Eq. 4). They found that the most complex TM’s are indeed located at intermediate values of the entropy, including Minsky’s universal TM. Mitchell et al., reviewed this idea of computation at the “edge of chaos” and reported on experiments producing very different results from the original experiment by Packard [54], they suggest that the interpretation of the original results is not correct [48]. Those negative results did not disprove the hypothesis that computational capability can be correlated with phase transitions in CA rule space; they showed only that Packards results did not prove the hypothesis [47]. All in all this is still an open research question that might have a large impact on the understanding of computation in CA’s.
2.4
Modeling with Cellular Automata
Cellular Automata can be an alternative to Differential Equations (DE) for the modeling of physical systems. To integrate a DE numerically, it must be discretized in some way. This discretization is an approximation essentially equivalent to setting up a local discrete (dynamical) system that in the macroscopic limit reduces to the DE under consideration. The idea now is to start with a discrete system rather than a continuous description. There is no telling which model (a-priori discrete, or continuous) models the physics best. It is instructive
Distributed Simulation with Cellular Automata
213
to consider the example of the wave equation in one dimension [1] 2 ∂2f 2∂ f = c . ∂t2 ∂x2
(9)
This equation has two types of solution that are waves traveling to the right and to the left with wave vectors k and frequencies ωk = ck: � X� Ak ei(kx−ωk t) + Bk ei(kx+ωk t) (10) f= k
A particular solution is obtained by choosing coefficients Ak and Bk : f = A (x − ct) + B (x + ct) with A(x) =
X
Ak eikx
(11)
(12)
k
and B(x) analogous, with A(x) and B(x) two arbitrary functions that specify the initial conditions of the wave in an infinite space. We can construct a simple one-dimensional CA analog to this wave equation. For each update, adjacent cells are paired into partitions of two cells each, where the pairing switches from update to update: the dynamics is completely given by switching the contents of two adjacent cells in an update. 1 −1 −1 1 1 −1 1 −1 1 1 −1 −1 1 1 1 1 1 −1 −1 1 1 1 1 −1 1 1 −1 1 1 −1 1 1 1 1 −1
1 −1 1 −1 1 1 −1 1 1 1 1 −1 1 −1 −1 1 1 1 1 1 1 −1 −1 −1 1 1 −1 1 1 1 −1 −1 1 −1 −1 1 1 1 −1 1 1 −1 −1 −1 1
Given an arbitrarily chosen initial condition, it can be seen that the contents of the odd cells move systematically to the right, where the contents of the even cells move to the left; both with a constant velocity c. The dynamics of this CA is the same as the dynamics of the wave equation in infinite space, we only need to code the initial conditions in the cells appropriately. If a binary representation of the cells is used {1, −1}, then the local average over the odd cells represents the right traveling wave A(x − ct), and the local average over the even cells represents B(x + ct). Another useful CA simulation is found in the study of excitable media. Winfree et al. [70] discussed already a simple 2D example that requires three symbols denoting relevant states in a biological cell: Q for quiescent, E for excited, and T for tired. If one of the neighbors is excited, Q is followed by E. After one time step, an excited cell becomes tired and the is set back to Q. This rule gives rise to propagating spirals that are qualitatively similar to those observed in Belousov-Zhabotinsky reactions.
214
P. M. A. Sloot et al.
A beautiful extension to this 2D biological cellular model was first reviewed by Celada et al. [8]. In this system model, B and T lymphocytes are modeled together with antigen and antibody molecules. They showed simulations of cell response to antigens, response regulation, the minimum number of MHC-type of molecules, and natural selection in the MHC-species repertoire. One of the most successful efforts to use CAs for simulation of DEs is the lattice gas automaton to simulate hydrodynamics. This will be described in the Section 4. First different parallel execution models for cellular automata will be presented in the next section.
3 3.1
Execution Models for Cellular Automata Synchronous Cellular Automata versus Asynchronous Cellular Automata
The cellular automata (CA) model is a conceptual simple and effective solver for dynamic complex systems (DCS). From a modelers perspective, a CA model allows the formulation of a DCS application in simple rules. From a computer simulation perspective, a CA model provides an execution mechanism that evaluates the temporal dynamic behavior of a DCS given these simple rules. An important characteristic of the CA execution mechanism is the particular update scheme that applies the rules iteratively to the individual cells of the CA. The different update schemes impose a distinct temporal behavior on the model. Thus we must select the proper update mechanism that aligns with the dynamics of the model. In the previous discussion, the update mechanism of CAs is described as being synchronously in parallel. However, for certain classes of DCS, the temporal dynamic behavior is asynchronously. In particular, systems with heterogeneous spatial and temporal behavior are, in general, most exactly mapped to asynchronous models [3,41]. In case asynchronous models are solved by CA, the asynchronous temporal behavior must be captured by the update mechanism. This class of CA is called Asynchronous Cellular Automata (ACA) [23,39,51,53]. The ACA model incorporates asynchronous cell updates, which are independent of the other cells, and allows for a more general approach to CA. With these qualifications, the ACA is able to solve more complicated problems, closer to reality [75]. Dynamic systems with asynchronous updates can be forced to behave in a highly inhomogeneous fashion. For instance in a random iteration model it is assumed that each cell has a certain probability of obtaining a new state and that cells iterate independently. As an example one can think of the continuoustime probabilistic dynamic model for an Ising spin system [40]. 3.2
Types of Simulation
Essential to every model is the time base on which changes to the system state occur. Accordingly, models can be classified depending on their temporal dynamic behavior [74]. A model is a continuous-time model when time flows
Distributed Simulation with Cellular Automata
215
state
state
smoothly and continuously. A model is a discrete-time model if time flows in jumps of some specified time unit. Continuous time models can be further divided into differential equation and discrete-event classes. A differential equation model is a continuous-time model where changes in the state occur smoothly and continuously in time. In a discrete-event model, even though time flows continuously, state changes can occur only at discrete points in time: time jumps from one event to the next, while these events can occur arbitrarily separated from each other. By the very nature of the CA rules that define the state transformations, the temporal dynamic behavior classes that are applicable to cellular automata are discrete-time and discrete-event. The figures Fig. 5(a) and Fig. 5(b) show the differences between the temporal behavior of state changes in both classes.
10
20
30
40
T
(a) State changes in a discretetime system model
10
20
30
40
T
(b) State changes in a discreteevent system model
Fig. 5. Temporal behavior of discrete-time and discrete-event system model
3.2.1 Discrete-Time Models and Time-Driven Simulation In discretetime models the progress of time is modeled by time advances of a fixed increment, for example time is advanced in increments of exactly ∆t time units. The execution mechanism that implements this temporal dynamic behavior is called time-driven simulation, since the clock initiates the state transitions of each individual cell in the CA. The execution mechanism in time-driven simulation is characterized by an iterative loop that, after each update of the simulation time, updates the state variables for the next time interval ht, t + ∆t]. The new state of a cell at time t + ∆t is calculated from the state of the cell and its neighbors at time t. Time-driven simulation is the most widely known and applied approach for the simulation of CA models and natural systems in general. However, with the usage of time-driven simulation one has to ascertain that the time step ∆t is small enough to capture every state change in the system model. This
216
P. M. A. Sloot et al.
might imply that we need to make ∆t arbitrarily small, which is certainly not acceptable with respect to the computational requirements involved. Therefore, time-driven simulation is less appropriate for the simulation of discrete-event models, as there may be many clock ticks in which no events occur. 3.2.2 Discrete-Event Models and Event-Driven Simulation The progress of time in discrete-event models is modeled by the occurrence of instantaneous state changes, called events, at random times and independent from each other. The execution mechanism that implements this temporal dynamic behavior is called event-driven simulation. In event-driven simulation, the progress of simulation time depends on the occurrence of the next event. The event-driven simulation execution mechanism maintains an ordered event list to hold expected future events. The simulation time progresses from the current time to the next scheduled event time. The simulation of one event may generate new events that are scheduled for future execution. An elegant and efficient characteristic of the event-driven simulation approach is that periods of inactivity are skipped over by advancing the simulation clock from event time to the next event time. This is perfectly save since— by definition—all state changes only occur at event times. Therefore causality and the validity of the simulation is guaranteed. The event-driven approach to discrete systems is usually exploited in queuing and optimization problems. However, as we will see next, it is also a paradigm for the simulation of continuoustime systems. 3.3
Parallel Simulation of Cellular Automata Models
The parallelization of the CA, both for synchronous and asynchronous models, is realized by geometric decomposition. That is, the individual cells of the CA are aggregated into sublattices, which are mapped to the parallel processors. However, the parallel synchronization mechanism between the sublattices are very different for synchronous and asynchronous CA models. 3.3.1 Parallel Synchronous Cellular Automata Simulation Similar to the sequential execution of synchronous CA, the cells in a parallel synchronous CA simulation undergo simultaneous state transitions under direction of a global clock. All cells must finish their state transition computations before any cell can start simulating the next clock tick. The parallelization of the discrete-time simulation is achieved by imitating the synchronous behavior of the simulation. The simulation is arranged into a sequence of rounds, with one round corresponding to one clock tick. Between each round a global synchronization of all cells indicates that the cells have finished their state change at time step t and the new time step t + ∆t can be started. Generally, the simulation proceeds in two phases, a computation and state update phase, and a communication phase. The progression of time in timedriven simulation is illustrated in Fig. 6.
Distributed Simulation with Cellular Automata
217
synchronization/ communication
t
t
t+∆t
t+∆t
t
t
t+∆t
t+∆t
Fig. 6. Time-driven simulation of a synchronous CA model, where computation and communication phases succeed each other
3.3.2 Parallel Asynchronous Cellular Automata Simulation In parallel ACA simulation, state transitions (further called events) are not synchronized by a global clock, but rather occur at irregular time intervals. In these simulations few events occur at any single point in simulated time and therefore parallelization techniques based on synchronous execution using a global simulation clock perform poorly. Concurrent execution of events at different points in simulated time is required, but this introduces severe synchronization problems. The progress of time in event-driven simulation is illustrated in Fig. 7.
5
10
18
15
3
6
8
7
Fig. 7. Progress of simulation time in event-driven simulation. As the cells evolve asynchronously in time, the simulation time of the individual cells are different
The absence of a global clock in asynchronous execution mechanisms necessitates sophisticated synchronization algorithms to ensure that cause-and-effect
218
P. M. A. Sloot et al.
relationships are correctly reproduced by the simulator. Parallel discrete event simulation is essentially concerned with the correct ordering, or scheduling, of the asynchronous execution of events over parallel processors. There are basically two methods to impose the correct temporal order of the asynchronous event execution: conservative and optimistic methods. First, the conservative approach proposed by Chandy and Misra [9] strictly imposes the correct temporal order of events. Second, the optimistic approach, introduced by Jefferson [24], uses a detection and recovery mechanism: whenever the incorrect temporal order of events is detected, a rollback mechanism is invoked to recover. Although both approaches have their specific application area, optimistic methods offer the greatest potential as a general-purpose simulation mechanism. In optimistic simulation, the parallel simulation processes execute events and proceed in local simulated time as long as they have any input at all. A consequence of the optimistic execution of events is that the local clock or Local Virtual Time (LVT) of a process may get ahead of its neighbors’ LVTs, and it may receive an event message from a neighbor with a simulation time smaller than its LVT, that is, in the past of the simulation process. The event causing the causality error is called a straggler. If we allow causality errors to happen, we must provide a mechanism to recover from these errors in order to guarantee a causally correct parallel simulation. Recovery is accomplished by undoing the effects of all events that have been processed prematurely by the process receiving the straggler. The net effect of the recovery procedure is that the simulation process rolls back in simulated time. The premature execution of an event results in two things that have to be rolled back: (i) the state of the simulation process and (ii) the event messages sent to other processes. The rollback of the state is accomplished by periodically saving the process state and restoring an old state vector on rollback: the simulation process sets its current state to the last state vector saved with simulated time earlier than the timestamp of the straggler. Recovering from premature sent messages is accomplished by sending an anti-message that annihilates the original when it reaches its destination. The messages that are sent while the process is propagating forward in simulated time, and hence correspond with simulation events, are called positive messages. A direct consequence of the rollback mechanism is that more anti-messages may be sent to other processes recursively, and that it allows all effects of erroneous computation to be eventually canceled. As the smallest unprocessed event in the simulation is always safe to process, it can be shown that this mechanism always makes progress under some mild constraints [24]. In optimistic simulation the notion of global progress in simulated time is administered by the Global Virtual Time (GVT). The GVT is the minimum of the LVTs for all the processes and the timestamps of all messages (including anti-messages) sent but unprocessed. No event with timestamp smaller than the GVT will ever be rolled back, so storage used by such event (i.e., saved state vector and event message) can be discarded. Also, irrevocable operations such
Distributed Simulation with Cellular Automata
219
as I/O cannot be committed before the GVT sweeps past the simulation time at which the operation occurred. The process of reclaiming memory and committing irrevocable operations is referred to as fossil collection. To summarize, the parallel synchronous execution mechanism for discrete-time models mimics the sequential synchronous execution mechanism by interleaving a computation and state update phase with a synchronization and communication phase. The parallel execution mechanism is fairly simple and induces a minimum of overhead on the computation. The parallel asynchronous execution mechanism for discrete-event models, the so-called optimistic simulation method, is more expensive than its sequential counterpart. The synchronization mechanism in optimistic simulation requires extra administration, such as state saving and rollback. Despite this overhead, optimistic simulation is an efficient parallel execution mechanism for discrete-event models. In Section 5, two applications are presented that are typical examples of respectively synchronous and asynchronous CA models.
4 4.1
Cellular Automata as Models for Fluid Flow Introduction
Section 2 introduced the basic idea behind Cellular Automata (CA) and exemplified how one can reason about information and complexity in general CAs. Here we introduce a very specific CA, which, as will become clear later on, can be used as a model of fluid flow. This class of CA is called Lattice Gas Automata (LGA), and they are described in detail in two recent books [11,58]. Suppose that the state of a cell is determined by bm surrounding cells. Usually, only the nearest and next-nearest neighbors are considered. For example, on a square lattice with only nearest neighbor interactions bm = 4, if next-nearest neighbors are also included bm = 8, and on a hexagonal lattice with nearest neighbor interactions bm = 6. Furthermore, suppose that the state of the cell is a vector n of b = bm bits. Each element of the state vector is associated with a direction on the CA lattice. For example, in the case of a square grid with only nearest neighbor interactions we may associate the first element of the state vector with the north direction, the second with east, the third with south and the fourth with west. With these definitions we construct the following CA rule (called the LGA rule), which consists of two sequential steps: 1. Each bit in the state vector is moved in its associated direction (so in the example, the bit in element 1 is moved to the neighboring cell in the north) and placed in the state vector of the associated neighboring cell, in the same position (so, the bit in element 1 is moved to element 1 of the state vector in the cell in the north direction). In this step each cell is in fact moving bits from its state vector in all directions, and at the same time is receiving bits from all directions, which are stored into the state vector.
220
P. M. A. Sloot et al.
2. Following some deterministic or stochastic procedure, the bits in the state vector are reshuffled. For instance, the state vector (1, 0, 1, 0) is changed to (0, 1, 0, 1). As a refinement, one may also introduce br extra bits in the state vector which, as it were, reside on the cell itself, i.e. are not moved to another cell in step 1 of the LGA rule. In that case the length of the state vector b = bm + br . These br residing bits do however participate in the reshuffling step 2. It is clear that the class of LGA-CA that we have just defined is very large. We have freedom to choose the CA lattice, the interaction list, the number of residing bits, and the reshuffling rule. Once all this is done, we may expect that the specific LGA-CA that we defined has a very rich dynamical behavior, depending on the initial conditions and the size of the grid. Except maybe for 1-dimensional lattices, a detailed study of the dynamics of such CA is probably not feasible. It was shown by Moore and Nordhal [49] that the problem of LGA prediction is P-complete, thus cannot be solved in parallel in polylogarithmic time. This implies that the only way out is a step by step explicit simulation. Our new CA therefore seems like a nice toy that may exhibit a very complex dynamical behavior, but no more than that. However, maybe very surprisingly, if we associate physical quantities to our CA, enforce physical conservation laws on the bit reshuffling rule of step 2, and use methods from theoretical physics to study the dynamics, we are in fact able to analyze the CA in terms of its average behavior, i.e. the average state vector of a cell and the average flow of bits between cells can be calculated. Even better, it turns out, again within the correct physical picture, that this CA behaves like a real fluid (such as water) and therefore can be used as a model for hydrodynamics. Furthermore, as the LGA rule is intrinsically local (only nearest and next-nearest neighbor interactions) we constructed an inherently parallel model for fluid flow. 4.2
Associating Physics with the LGA-CA
Our current image of the LGA-CA is that of bits that first move from a cell to a neighboring cell and are then reshuffled into another direction. Now we associate the bits in the state vector with particles; a one-bit codes for the presence of a particle, and a zero bit codes for the absence of a particle. Assume that all particles are equal and have a mass of 1. Step 1 in the LGA-CA is now interpreted as streaming of particles from one cell to another. If we also introduce a length scale, i.e. a distance between the cells (usually the distance between nearest neighbors cells is taken as 1) and a time scale, i.e. a time duration of the streaming (i.e. step 1 in the LGA-CA rule, usually a time step of 1 is assumed), then we are able to define a velocity ci for each particle in direction i (i.e. the direction associated with the i-th element of the state vector n). Step 1 of the LGA-CA is the streaming of particles with velocity ci from one cell to a neighboring cell. The residing bits can be viewed as particles with a zero velocity, or rest particles. Now we may imagine, as the particles meet in a cell, that they collide. In this collision the velocity of the particles (i.e. both absolute speed and
Distributed Simulation with Cellular Automata
221
direction) can be changed. The reshuffling of bits in step 2 of the LGA-CA rule can be interpreted as a collision of particles. In a real physical collision, mass, momentum, and energy are conserved. Therefore, if we formulate the reshuffling such that these three conservation laws are obeyed, we have constructed a true Lattice Gas Automaton, i.e. a gas of particles that can have a small set of discrete velocities ci , moving in lock-step over the links of a lattice (space is discretized) and that all collide with other particles arriving at a lattice point at the same time. In the collisions, particles may be send in other directions, in such a way that the total mass and momentum in a lattice point is conserved. We can now associate with each cell of the LGA-CA a density ρ and momentum ρu, with u the velocity of the gas: ρ=
b X
Ni ,
(13)
ci Ni ,
(14)
i=1
ρu =
b X i=1
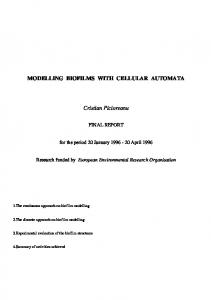
where Ni = hni i, i.e. a statistical average of the Boolean variables; Ni should be interpreted as a particle density. The good thing now is, if we let the LGA evaluate and calculate the density and momentum as defined in Eqs. (13, 14), that these quantities behave just like a real fluid. In Figs. 8A and 8B we show an example of an LGA simulation of flow around a cylinder. In Fig. 8A we show the results of a single iteration of the LGA, so in fact we have assumed that Ni = ni . Clearly, the resulting flow field is very noisy. In order to arrive at smooth flow lines one should calculate Ni = hni i. Because the flow is static, we calculate Ni by averaging the boolean variables ni over a large number of LGA iterations. The resulting flow velocities are shown in Fig. 8B. The evolution of the boolean variables ni can be expressed as ni (x + ci , t + 1) − ni (x, t) = ∆i (n (x, t))
(15)
where x denotes the position of a lattice point and ∆ is the collision operator. The collision operator must obey mass, momentum, and energy conservation, i.e. b X
∆i (n) = 0,
(16)
ci ∆i (n) = 0,
(17)
c2i ∆i (n) = 0,
(18)
i=1 b X i=1 b X i=1
where ci = |ci |. One can ask if the evolution equation 15 is also valid for the averaged particle densities Ni . It turns out that this is possible, but only under
222
P. M. A. Sloot et al.
A
B
Fig. 8. A. LGA simulation of flow around a cylinder, the result of a single iteration of the LGA is shown. The arrows are the flow velocities, the length is proportional to the absolute velocity. The simulations were done with FHPIII, on a 32 × 64 lattice, the cylinder has a diameter of 8 lattice spacings, only a 32 × 32 portion of the lattice is shown; periodic boundary conditions in all directions are assumed. B. As in Fig. 8A, now the velocities are shown after averaging over 1000 LGA iterations the Boltzmann molecular chaos assumption which states that particles that collide are not correlated before the collision, or, in equations, that for any number of particles k, hn1 n2 . . . nk i = hn1 i hn2 i . . . hnk i. In that case one can show that h∆i (n)i = ∆i (N). By averaging Eq. (15) and applying the molecular chaos assumption we find Ni (x + ci , t + 1) − Ni (x, t) = ∆i (N (x, t)) .
(19)
A first order Taylor expansion of Ni (x + ci , t + 1), substituted into Eq. (19) results in ∂t Ni (x, t) + ∂α ciα Ni (x, t) = ∆i (N (x, t))
(20)
∂ , the subscript α denotes the αNote that the shorthand ∂t means ∂t component of a D-dimensional vector, where D is the dimension of the LGA lattice, and that we assume the Einstein summation convention over repeated Greek indices (e.g. in two dimensions ∂α ciα Ni = ∂x cix Ni + ∂y ciy Ni ). Next we sum Eq. (20) over the index i and apply Eqs. (13, 16, 17), thus arriving at ∂t ρ + ∂α (ρuα ) = 0, or
∂ρ + ∇ · ρu = 0, ∂t
(21)
which is just the equation of continuity that expresses conservation of mass in a fluid. One can also first multiply Eq. (20) with ci and then summate over the
Distributed Simulation with Cellular Automata
223
index i. In that case we arrive at ∂t ρuα + ∂β Παβ = 0,
(22)
with Παβ =
b X
ciα ciβ Ni .
(23)
i=1
The quantity Παβ must be interpreted as the flow of the α-component of the momentum into the β-direction, Παβ is the momentum density flux tensor. In order to proceed one must be able to find expressions for the particle densities Ni . This is a highly technical matter that is described in detail in e.g. [11,58]. The bottom line is that one first calculates the particle densities for a LGA in equilibrium, Ni0 , and substitute them into Eq. (23). This results in an equation that is almost similar to the Euler equation, i.e. the expression of conservation of momentum for an inviscid fluid. Next, one proceeds by taking into account small deviations from equilibrium, resulting in viscous effects. Again, after a very technical and lengthy derivation one is able to derive the particle densities, substitute everything into Eq. (23) and derive the full expression for the momentum conservation of the LGA, which again very closely resembles the Navier-Stokes equations for an incompressible fluid. The viscosity and sound speed of the LGA are determined by its exact nature (i.e. the lattice, the interaction list and the number of residing particles, and the exact definition of the collision operator). At first sight the average, macroscopic behavior of the LGA may come as a big surprise. The LGA-CA is a model that reduces a real fluid to one that consists of particles with a very limited set of possible velocities, that live on the links of a lattice and all stream and collide at the same time. Yet, theoretical analysis and a large body of simulation results show that, although the LGA is indeed a very simple model, it certainly is a realistic model of a real fluid. However, it is true that not all LGA behave as a real fluid. The underlying lattice must have enough symmetry such that the resulting macroscopic equations are isotropic, as in a real fluid. For instance, the first LGA, the so-called HPP model, which is defined on a two dimensional square lattice with only nearest-neighbor interactions and no rest particles, is not isotropic. The FHP models, which have a two dimensional hexagonal lattice, do possess enough symmetry and their momentum conservation law have the desired isotropy property. To end this section we stress once more that the LGA is an intrinsically local CA and therefore gives us an inherently parallel model for fluid flow simulations. Some case studies to support this will be provided in later sections. 4.3
The FHP Model
The FHP model, named after its discoverers Frisch, Hasslacher, and Pomeau, was the first LGA with the correct (isotropic) hydrodynamic behavior. The FHP model is based on a 2-dimensional hexagonal lattice, as in Fig. 9. This figure
224
P. M. A. Sloot et al.
A
B
C
Fig. 9. Lattice and update mechanism of the FHP-I LGA. A dot denotes a particle and the arrow its moving direction. In A to C the propagation and collision phases are shown for some initial configuration
A
B
Fig. 10. Collision rules of FHP-I. A dot denotes a particle and the arrow its moving direction. The left figure shows the two particle collisions, the right figure the three particle collisions
also shows examples of streaming and collisions of particles in this model. In the FHP-I model, which has no rest particles (i.e. br = 0 and b = bm = 6), only 2-body and 3-body collisions are possible, see Fig. 10. Note that all these collision configurations can off course be rotated over multiples of 60◦ . For this model we can easily write an explicit expression for the collision operator, as (3)
(2)
∆i (n) = ∆i (n) + ∆i (n) .
(24)
The three body collision operator is (3)
∆i (n) = ni+1 ni+3 ni+5 ni ni+2 ni+4 − ni ni+2 ni+4 ni+1 ni+3 ni+5 ,
(25)
where ni = 1 − ni and the subscript should be understood as “modulo 6”. A similar expression can be obtained for the two-body collisions (see e.g. [58]). It is clear that the implementation of this LGA, i.e. the evolution equation 15 with the FHP-I collision operator (Eq. 24), using bit wise operations, is straightforward and can result in very fast simulations with low memory consumption. Furthermore, the inherent locality of the LGA rule makes parallelization trivial. Next, by averaging the boolean variables ni , either in space or in time, one obtains the particles densities Ni and from that, using Eqs. (13, 14), the density
Distributed Simulation with Cellular Automata
225
and fluid velocity. Many people, especially those who are used to simulate flow patterns based on numerical schemes derived from the Navier Stokes equations, find it hard to believe that such a simple Boolean scheme is able to produce realistic flow simulations. Yet the LGA, which in a sense originated from the original ideas of von Neuman who invented CA as a possible model to simulate life, is a very powerful and viable model for hydrodynamics. 4.4
The Lattice Boltzmann Method
Immediately after the discovery of LGA as a model for hydrodynamics, it was criticized on three points; noisy dynamics, lack of Galilean invariance, and exponential complexity of the collision operator. The noisy dynamics is clearly illustrated in Fig. 8A. The lack of Galilean invariance is a somewhat technical matter which results in small differences between the equation for conservation of momentum for LGA and real Navier Stokes equations, for details see [58]. Adding more velocities in an LGA leads to increasingly more complex collision operators, exponentially in the number of particles. Therefore, another model, the Lattice Boltzmann Method (LBM), was introduced. This method is reviewed in detail in [10]. The basic idea is that one should not model the individual particles ni , but immediately the particle densities Ni , i.e. one iterates the Lattice Boltzmann Equation 19. This means that particle densities are streamed from cell to cell, and particle densities collide. This immediately solves the problem of noisy dynamics. However, in a strict sense we no longer have a CA with a boolean state vector. However, we can view LBM as a generalized CA. By a clever choice of the equilibrium distributions Ni0 the model becomes isotropic and Galilean invariant, thus solving the second problem of LGA. Finally, a very simple collision operator is introduced. This so-called BGK collision operator models the collisions as a single-time relaxation towards equilibrium, i.e. ∆BGK (N) = τ (Ni0 − Ni ). i
(26)
Eqs. (19, 26) together with a definition of the equilibrium distributions result in the Lattice-BGK (L-BGK) model. The L-BGK model leads to correct hydrodynamic behavior. The viscosity, of a two-dimensional L-BGK on a hexagonal lattice is given by: � � 1 1 1 ν= − . (27) 4 τ 2 The L-BGK is also developed for other lattices, e.g. in two or three dimensions cubic lattices with nearest and next nearest neighbor interactions. The LBM, and especially the L-BGK has found widespread use in simulations of fluid flow. 4.5
Parallelism and Applications
The LGA and LBM have been used to simulate many types of flow in, especially, complex geometries. In Section 5.1 we show in detail such an application. Here
226
P. M. A. Sloot et al.
we will further discuss parallelism in LGA and LBM, and show some examples of applications of large scale parallel LGA and LBM simulations. The local nature of the LGA and LBM interactions allows a very straightforward realization of parallelism. A simple geometric decomposition of the lattice with only local message passing between the boundaries of the different domains is sufficient to realize an efficient parallel simulation. For instance, we have developed a generic 2-dimensional LGA implementation that is suitable for any multi-species (thermal) LGA [16]. Parallelism was introduced by means of a 1-dimensional, i.e. strip-wise, decomposition of the lattice. As long as the grid dimension compared to the number of processors is large enough, this approach results in a very efficient parallel execution. This LGA system is mainly used for simulations in simple rectangular domains without internal obstacles. However, in a more general case, where the boundaries of the grid have other forms and internal structure (i.e. solid parts where no particles will flow) the simple stripwise decomposition results in severe load imbalance. In this case, as was shown by Kandhai et al. [30], a more advanced decomposition scheme, the Orthogonal Recursive Bisection (ORB) method, still leads to highly efficient parallel LBM simulations. ORB restores the load balancing again, however at the price of a somewhat more complicated communication pattern between processors. As in many models, the specification of initial and boundary methods turns out the be much more difficult than anticipated. The same is true for LGA and LBM. Solid walls are usually implemented using a bounce back rule (i.e. sending a particle back into the direction where it came from) thus implementing a noslip boundary. Kandhai et al. have investigated this bounce back rule in detail for L-BGK [31] and conclude that this simple rule, although it may have a negative effect on the accuracy of the L-BGK, is a very suitable boundary condition in simulations, as long as one is not interested in the details of the flow close to the boundaries. Khandai et al. also investigated several formulations for initial conditions and other types of boundary conditions (e.g. specifying a certain velocity on a boundary). As an example of a large scale parallel L-BGK simulation we refer to Ref. [34], where flow in a random fibrous network, as a model for paper, was simulated. The permeability that was obtained from the simulations was in very good agreement with experimental results. Another impressive example is flow in a Static Mixer Reactor [32]. Here, L-BGK simulations and conventional Finite Element simulations where compared, which agreed very well. The simulation results also agree very well with experimental results. This shows that L-BGK, which is much easier to parallelize and much easier to extend with more complex modeling compared to FE, (multi-species flow, thermal effects, reactions), is very suitable in real life problems involving complex flow.
Distributed Simulation with Cellular Automata
5 5.1
227
Selected Applications Modeling Growth and Form in a Moving Fluid Using Synchronous Cellular Automata
The basic idea of modeling growth and form of marine sessile suspension feeders, as for example sponges and stony corals [28,29], will be briefly discussed in the next section. The simulated growth forms will be only qualitatively discussed, more detailed quantitative measurements on for example the space-filling properties, expressed in fractal dimensions, centers of gravity of the simulated objects, and absorption measurements are presented elsewhere [28,29]. In the model both the parallelism present in physical environment (dispersion of nutrients through diffusion and flow) and the parallelism present in the growth process, will be exploited. The dispersion of nutrients will be modeled using the lattice Boltzmann method discussed in Section 4.4, while the growth of the stony coral will be modeled using a probabilistic cellular automaton. 5.1.1 Biological Background Many marine sessile suspension feeders from various taxonomic groups, as for example sponges, hydrocorals, and stony corals, exhibit a strong morphological plasticity, which is in many cases related to the impact of hydrodynamics. The exposure to water movement represents one of the dominant environmental parameters. In a number of cases it is possible to arrange growth forms of sponges, hydrocorals, and stony corals along a gradient of the amount of water movement [27]. In the examples of stony corals, the growth form gradually transforms from a compact shape under exposed conditions, to a thin-branching one under sheltered conditions. In Fig. 11 two extreme examples of growth forms are shown of Pocillopora damicornis. Form A originates from a site sheltered to water movement, while B was collected from an exposed site. Between both extremes, a range of gradually changing intermediate growth forms exist [67]. Stony corals are typical modular organisms. Modular growth is defined as the growth of genetic identical individuals by repeated iteration of (multi-cellular) parts: the modules [22]. Modules might be the polyp of a coral or for instance a shoot with an apical meristem in seed plants. The modular growth of stony corals is relatively simple when compared to more complex modular organisms like seed plants. The modular growth of these organisms can be defined as parallel modular growth, where the various modules grow almost independently, only limited by steric hindrance. Because of the almost independently growing modules, which are not limited by the development of other modules, some important simplifications can be made in the modeling of the growth process. The organisms can increase in size without a decrease in growth velocities, where growth of these organisms will be limited by external factors like strong water movements. To obtain insight into the influence of hydrodynamics on the growth process of sessile suspension feeders, a morphological simulation model was developed. In the absence of flow, the distribution of nutrients around the growth form can be modeled as a diffusion process in a steady state: there is a source of
228
P. M. A. Sloot et al.
A
B
Fig. 11. Growth forms of the stony coral Pocillopora damicornis. Form A originates from a site sheltered to water water movement, form B originates from an exposed site suspended material and the organism continuously consumes nutrients from its environment. In general in a marine environment, there will be a significant contribution of the hydrodynamics to the dispersion pattern of the suspended material around the growth form. In this case the distribution of nutrients around the organism will be determined by a combination of flow and diffusion. 5.1.2 A CA model of Flow and Nutrient Distributions The flow pattern around the simulated growth form was computed by applying the lattice Boltzmann method (see Section 4.4) in combination with a tracer step to study the dispersion of “nutrient” in the system. In these simulations the nutrient particles are dispersed by the combined process of flow and diffusion. With this method simulated growth processes can be studied for various P´eclet numbers P e defined as: Pe =
ul D
(28)
where u is the mean flow velocity, l a characteristic length, and D the diffusion coefficient of the nutrient. The contribution of flow to the nutrient distribution can be quantified by the P´eclet number. A low value indicates that particles move mainly by diffusion (no influence of hydrodynamics, diffusion dominates) and a high value indicates that their motion is dominated by flow. Two types of boundary conditions are used: at the borders of the lattice periodic boundary conditions are applied, while in the nodes adjacent to the
Distributed Simulation with Cellular Automata
229
nodes representing the simulated growth form, solid boundary conditions are used. Periodic boundary conditions can be implemented by exchanging the ni ’s of the links at the borders of the lattice. Solid boundary conditions can be represented by exchanging the ni ’s between the adjacent node and a neighboring fluid node. After a lattice Boltzmann iteration, a tracer step is applied where populations of tracer particles are released from source nodes, while the tracer particles are absorbed by the sink nodes: the nodes adjacent to the growth form. The tracer particles can travel from a node at site r in the lattice to one of the 18 adjacent nodes r + ci , where the P´eclet number Eq. (28) determines if flow or diffusion dominates. When flow dominates, most particles will move in the direction of the governing flow, while under diffusion dominated conditions the amount of particles which travels in all 18 directions will be about equal. In the simulations the diffusion coefficient D varies, and u is kept constant by adjusting the driving force F of the system. Due to the growth of the object the velocity in the free fluid would gradually decrease if the driving force is not adjusted. For details on the computational model we refer to [28]. 5.1.3 A CA Model of the Growth Process The growth process is represented by a probabilistic cellular automaton in a similar way as done in the Diffusion Limited Aggregation model [71]. In [42] and [43] it is demonstrated that the Diffusion Limited Aggregation growth model is P-complete for which fast parallel algorithms probably do not exist, the only available option to study this type of growth processes is through explicit simulation. The basic construction of the aggregate is shown in Fig. 12. The cluster is initialized with a “seed” positioned at the bottom. In both the cluster and substrate sites solid boundary conditions are applied. Two flow regimes were studied in the simulations: 1. growth of the aggregates in a mono directional flow; 2. growth of the aggregates in a bidirectional (alternating) flow. The flow velocity in the system is kept at a low value, all simulations are done in the laminar flow regime. Tracer particles are released from the source plane. The tracer particles are absorbed by the fluid nodes adjacent to obstacle nodes, which can be nodes in the substrate plane or the aggregate nodes. In the growth model it is assumed that both the tracer distribution and flow velocities are in equilibrium and the growth velocity of the aggregate is much slower than the dispersion of the tracer. In the sink nodes the amount of absorbed tracer particles is determined and a new node is added to the aggregate. The probability p that k, an element from the set of open circles ◦ (the adjacent sink nodes) will be added to the set of black circles (the aggregate nodes) is given by p(k ∈ ◦ → k ∈ •) = P
(ak ) , j∈◦ (aj )
where ak is the absorbed amount of tracer particles at position k.
(29)
230
P. M. A. Sloot et al.
source plane
flow direction
substrate plane
y
initial ‘‘seed’’ of the aggregate z x
Fig. 12. Basic construction of the aggregate
In the bidirectional flow simulations the flow direction is reversed after each growth step. The aggregation model is summarized in pseudo-code below: initialize aggregate initialize flow direction do { compute flow velocities until equilibrium; compute tracer distribution until equilibrium; compute probabilities p that nodes neighboring to the aggregate nodes will be added to the aggregate; select randomly with probability p one of the growth candidates and add it to the aggregate; for the bidirectional case: reverse flow direction; } until ready 5.1.4 Parallelization of the CA models We performed the simulations on a lattice consisting of 1443 sites. The algorithm was implemented in parallel and the simulations were carried out on 16 nodes of a distributed memory Parsytec CC/40 system (approximately 6 Gflops/s). In this parallel implementation the nearest neighbor locality, present in both the lattice Boltzmann step, tracer calculation and growth model are exploited. In the parallel implementation the 1443 lattice is decomposed into a number of sublattices which are distributed over the processors. The main computation steps (lattice Boltzmann and tracer calculation) are done in the fluid nodes, while only in the growth step some computation is required in the aggregate nodes. Due to the growth of the aggregate a straight forward decomposition (for example partitioning of the lattice in
Distributed Simulation with Cellular Automata
231
equal sized slices or boxes) would lead to a strong load imbalance. To solve this problem we have tested two strategies to obtain a more equal distribution of the load over the processors: 1. Box decomposition in combination with scattered decomposition. 2. Orthogonal Recursive Bisection (ORB) in combination with scattered decomposition. In the box decomposition method the lattice is partitioned in 2D in equal sized boxes. In the ORB method [61] the object (the aggregate) is split into two subdomains perpendicular with respect to the xy-plane; after this similar splits are made for respectively the yz-plane and xz-plane. This method is recursively repeated for each subdomain. In the scattered decomposition method [50,57] blocks of data are scattered over the processors. The original lattice is divided by using a partitioning method. These blocks are randomly scattered over the processors, where each processor has the same number of blocks. An example of a scattered decomposition over 4 processors of an irregular shaped object in a 2D lattice is shown in Fig. 13. In this example the lattice is divided into 100 blocks, where each block is randomly assigned to one of the four processors. Most of the computation is done in the blocks containing exclusively fluid nodes. The scattering of the blocks over the processors leads to a spatial averaging of the load, where decreasing block sizes cause a better load balancing and an increasing communication overhead [57]. Especially in simulations in which the shape of the object cannot be predicted, is scattered decomposition an attractive option to improve the load balance in parallel simulations [42,43]. We have compared both decomposition strategies by computing the Load balancing efficiency: Load balancing efficiency =
lmin lmax
(30)
where lmin is the load of the slowest process and lmax the load of the fastest process. The two decomposition strategies were tested by using two extreme morphologies of the aggregates: a very compact shape and a dendritic shaped aggregate and by measuring the load balancing efficiency during the lattice Boltzmann and tracer computation required in one growth step. 5.1.5 Comparison of the Load Balancing Strategies In Fig. 14 the load balancing efficiencies (see Eq. 30) are shown for the two load balancing strategies: box decomposition in combination with scattered decomposition, and ORB in combination with scattered decomposition. In this comparison the two strategies were tested for both extreme morphologies of the aggregate: a compact shaped aggregate shown in Fig. 15C and a thin-branching (dendritic shaped) object depicted in Fig. 15A. 5.1.6 Simulated Growth Forms in a Mono Directional Flow Regime In the simulations with a mono directional flow regime it was found that the
232
P. M. A. Sloot et al.
Fig. 13. Decomposition of an irregular shaped object in a 2D lattice. In this case 100 blocks are scattered over 4 processors
Fig. 14. The load balancing efficiencies of 4 different experiments as a function of the total number of blocks. The dendritic object is shown in Fig. 15A and the compact object is depicted in Fig. 15C
aggregate gradually changes from a thin-branching morphology (diffusion dominates) into a compact shape (flow dominates), for an increasing P´eclet number. In Fig. 15 the results of the simulations are summarized by showing slices through the aggregate. The simulation box is sectioned parallel to the direction of the flow. In the sequence A–C in Fig. 15, the P e number increases. In this picture it can be observed that the degree of compactness increases for larger P e numbers.
Distributed Simulation with Cellular Automata
233
Furthermore, the effect of the mono-directional flow can be clearly observed: the aggregates tend to grow towards the direction of the flow (the flow is directed from the left to the right).
A
B
C
Fig. 15. Slices through the middle of the aggregates in the xy-plane, onedirectional flow experiment: A–C, P´eclet number increases from approximately 0.0 to 3.0. The flow is directed from the left to the right
5.1.7 Simulated Growth Forms in a Bidirectional (Alternating) Flow Regime In the previous section it is assumed that the growth form develops under mono-directional flow conditions. As a consequence an asymmetric form develops, as shown in Fig. 15, where the aggregates tend to grow in the upstream direction. This trend becomes stronger for higher P e numbers. In reality, the flow direction will basically reverse twice a day due to the tidal movements. A better approximation is to use a bidirectional flow system by using an aggregation model in which the flow direction is reversed after each growth step [29]. The morphology of the aggregates, in the bidirectional flow experiment, is depicted in Fig. 16. In Figs. 17 and 18 slices through the simulation box in the xz-plane are shown in which the nutrient distribution is visualized, for respectively the P e numbers 3.000 (flow dominates) and 0.015 (diffusion dominates). The color shift black– white in these pictures indicate a depletion of nutrients, black indicates the maximum concentration of nutrient, while the regions with nearly zero concentration are shown in white.
234
P. M. A. Sloot et al.
A
B
C
Fig. 16. Slices through the middle of the aggregates in the xy-plane, alternating flow experiment: A–C, P´eclet number increases from approximately 0.0 to 3.0
A
B
Fig. 17. Slice through the simulation box in the xz-plane showing the nutrient distribution in two successive growth stages in the alternating flow experiment in which P e is set to the value 3.000 (flow dominates) in the flow is directed from top to bottom in A and directed from bottom to top in B
5.1.8
Discussion
Parallelization aspects When comparing the load balancing efficiencies (Eq. 30) for the compact and dendritic objects in Fig. 14, comparable results are obtained for the dendritic object with both decomposition strategies. For the compact object the best load balancing efficiencies are obtained with the boxed decomposition in combination with scattered decomposition method. The main explanation for the difference, for both strategies, between the compact and the dendritic object is that in the last case the object is already dispersed over space.
Distributed Simulation with Cellular Automata
A
235
B
Fig. 18. Slice through the simulation box in the xz-plane showing the nutrient distribution in two successive growth stages in the alternating flow experiment in which P e is set to the value 0.015 (diffusion dominates) in flow is directed from top to bottom in A and directed from bottom to top in B
This property, the degree of space-filling of the object, can be quantified using the fractal box dimension Dbox of the object [28]. The fractal dimension Dbox of the surface of the object can be determined using a 3D version of the (cube)boxcounting method described by Feder [18]. In three dimensions its value varies from a minimum of 2, for a solid object with a perfectly smooth surface, to a maximum of 3 for a solid with a space-filling surface. The Dbox of the compact object was approximately 2.0, while in the dendritic case a value of approximately 2.3 was found. A major disadvantage of both strategies is that, although the load balancing efficiencies increase with the number of blocks used in the scattered decomposition, the communication overhead increases also. The results in Fig. 14 show that the morphology of the object strongly influences the degree of improvement introduced by increasing the number of scattered blocks. Biological aspects The nutrient distributions shown in Figs. 17 and 18 demonstrate the main differences between diffusion and flow dominated regimes. For low P´eclet numbers the distribution of nutrient is roughly symmetric about the center of the aggregate, where the highest concentration reside at the tips of the aggregate and where between the branches an area depleted from nutrients is found with a very low growth probability. At higher P´eclet numbers a clear asymmetry develops in the distribution with a depleted region developing downstream of the object (see Fig. 17). As a consequence, there is a low probability of growth in the depleted region. A gradual increase of compactness is demonstrated in Fig. 16 for an increasing influence of hydrodynamics. This gradual increase of compactness corresponds qualitatively to the observations made in stony corals, hydrocorals, and sponges, where growth forms gradually transform
236
P. M. A. Sloot et al.
from a compact shape, under conditions exposed to water movement, into a thinbranching one under sheltered conditions [25,27,67]. When comparing the slices through the aggregates shown in Figs. 15 and 16 it can also be observed that the increasing degree of asymmetry in the aggregate in the mono-directional flow experiment, for increasing P e numbers, has disappeared in the alternating flow experiment. In the last experiments, aggregates have developed with a roughly radiate symmetry, which corresponds qualitatively to the shape of branching sessile organisms, as for example Pocillopora damicornis. These experiments seem to indicate that an alternating flow, a reversal of the flow direction basically twice a day, leads to radiate symmetrical growth forms. The alternating flow model is a strong simplification of the actual growth process. In many stony corals, as for example the species Pocillopora damicornis photosynthesis represents a major energy input. The actual growth process in many sponges, stony-corals, and hydrocorals [25] consists of adding layers of material (varying in thickness) on top of the preceding growth stage, and not by the addition of particles. An accretive growth model, in which layers of material are constructed on top of the previous layers and where the local thickness is determined by the local amount of absorbed nutrients or light intensity [25], also offers possibilities for a quantitative morphological comparison of simulated and actual growth forms [2,26]. 5.2
Ising Spin Model Using Asynchronous Cellular Automata
The Ising spin model is a model of a system of interacting variables in statistical physics. The model was proposed by Wilhelm Lenz and investigated by his graduate student, Ernst Ising, to study the phase transition from a paramagnet to a ferromagnet [6]. A variant of the Ising spin model that incorporates the time evolution of the physical system is a prototypical example how Asynchronous Cellular Automata can be used to simulate asynchronous temporal behavior. The resulting ACA model is executed using the Time Warp optimistic simulation method (see Section 3). A key ingredient in the theory of magnetism is the electron’s spin and the associated magnetic moment. Ferromagnetism arises when a collection of such spins conspire so that all of their magnetic moments align in the same direction, yielding a total magnetic moment that is macroscopic in size. As we are interested how macroscopic ferromagnetism arises, we need to understand how the microscopic interaction between spins gives rise to this overall alignment. Furthermore, we would like to study how the magnetic properties depend on temperature, as systems generally loose their magnetism at high temperatures. 5.2.1 The Ising Spin Model To introduce the Ising model, consider a lattice containing N sites and assume that each lattice site i has associated with it a number si , where si = +1 for an “up” spin and si = −1 for a “down” spin. A particular configuration or microstate of the lattice is specified by the set of variables {s1 , s2 , . . . , sN } for all lattice sites (see Fig. 19).
Distributed Simulation with Cellular Automata
237
Fig. 19. Schematic spin model for a ferromagnet
The macroscopic properties of a system are determined by the nature of the accessible microstates. Hence, it is necessary to know the dependence of the energy on the configuration of spins. The total energy of the Ising spin model is given by E = −J
N X i,j=nn(i)
si sj − µ0 H
N X
si ,
(31)
i=1
where si = ±1, J is the measure of the strength of the interaction between spins, and the first sum is over all pairs of spins that are nearest neighbors (see Fig. 20). The second term in Eq. 31 is the energy of interaction of the magnetic moment, µ0 , with an external magnetic field, H.
E = -J
E = +J
Fig. 20. The interaction energy between nearest neighbor spins in the absence of an external magnetic field
If J > 0, then the states ↑↑ and ↓↓ are energetically favored in comparison to the states ↑↓ and ↓↑. Hence for J > 0, we expect that the state of the lowest total energy is ferromagnetic, i.e., the spins all point to the same direction. If J < 0, the states ↑↓ and ↓↑ are favored and the state of the lowest energy is expected to be paramagnetic, i.e., alternate spins are aligned. If we add a magnetic field to the system, the spins will tend to orient themselves parallel to H, since this lowers the energy. The average of the physical quantities in the system, such as energy E or magnetization M , can be computed in two ways. The time average of physical quantities are measured over a time interval sufficiently long to allow the system to sample a large number of microstates. Although time average is conceptually
238
P. M. A. Sloot et al.
simple, it is convenient to formulate statistical averages at a given instant of time. In this interpretation, all realizable system configurations describe an ensemble of identical systems. Then the ensemble average of the mean energy E is given by hEi =
m X
Es Ps ,
s=1
where Ps is the probability to find the system in microstate s, and m is the number of microstates. Another physical quantity of interest is the magnetization of the system. The total magnetization M for a system of N spins is given by M=
N X
si .
i=1
In our study of the Ising spin system, we are interested in the equilibrium quantity hM i, i.e., the ensemble average of the mean magnetization M . Besides the mean energy, another thermal quantity of interest is specific heat or heat capacity C. The heat capacity C can be determined by the statistical fluctuation of the total energy in the ensemble: � 1 C= hE 2 i − hEi2 . 2 kT And in analogy to the heat capacity, the magnetic susceptibility χ is related to the fluctuations of the magnetization: � 1 hM 2 i − hM i2 . χ= kT For the Ising model the dependence of the energy on the spin configuration (Eq. 31) is not sufficient to determine the time-dependent properties of the system. That is, the relation Eq. 31 does not tell us how the system changes from one spin configuration to another, therefore we have to introduce the dynamics separately. 5.2.2 The Dynamics in the Ising Spin Model Physical systems are generally not isolated, but are part of a larger environment. In this respect, the systems exchange energy with their environment. As the system is relatively small compared to the environment, any change in the energy of the smaller system does not have an effect on the temperature of the environment. The environment acts as a heat reservoir or heat bath at a fixed temperature T . From the perspective of the small system under study, it is placed in a heat bath and it reaches thermal equilibrium by exchanging energy with the environment until the system attains the temperature of the bath. A fundamental result from statistical mechanics is that for a system in equilibrium with a heat bath, the probability of finding the system in a particular microstate is proportional to the Boltzmann distribution [55] Ps ∼ e−βEs ,
Distributed Simulation with Cellular Automata
239
where β = 1/kB T , kB is Boltzmann’s constant, Es is the energy of microstate s, and Ps is the probability of finding the system in microstate s. The Metropolis Algorithm To introduce the dynamics that describes how the system changes from one configuration to another, we need an efficient method to obtain a representative sample of the total number of microstates, while the temperature T of the system is fixed. The determination of the equilibrium quantities is time independent, that is the computation of these quantities does not depend on simulation time. As a result, we can apply Monte Carlo simulation methods to solve the dynamics of the system. The well-known Metropolis algorithm uses the Boltzmann distribution to effectively explore the set of possible configurations at a fixed temperature T [4]. The Metropolis algorithm samples a representative set of microstates by using an importance sampling method to generate microstates according a probability function e−βEs πs = Pm −βE . s s=1 e This choice of πs implies that the ensemble average for the mean energy and mean magnetization can be written as m
hEi =
1 X Es m s=1
m
and hM i =
1 X Ms . m s=1
The resulting Metropolis algorithm samples the microstates according to the Boltzmann probability. First, the algorithm makes a random trial change (a spin flip) in the microstate. Then the energy difference ∆E is computed. The trial is accepted with probability e−β∆E (note that for ∆E ≤ 0 the probability is equal to or larger than one and the trial is always accepted). After the trial, accepted or not accepted, the physical quantities are determined, and the next iteration of the Metropolis algorithm can be started. The number of Monte Carlo steps per particle plays an important role in Monte Carlo simulations. On the average, the simulation attempts to change the state of each particle once during each Monte Carlo step per particle. We will refer to the number of Monte Carlo steps per particle as the “time,” even though this time has no obvious direct relation to physical time. We can view each Monte Carlo time step as one interaction with the heat bath. The effect of this interaction varies according to the temperature T , since T enters through the Boltzmann probability for flipping a spin. The temperature dependency of the physical quantities hM i and C are shown in figures Fig. 21(a) and Fig. 21(b). For temperature T = 0, we know that the spins are perfectly aligned in either direction, thus the mean magnetization per spin is ±1. As T increases, we see in Fig. 21(a) that hM i decreases continuously until T = Tc , at which hM i drops to 0. This Tc is known as the critical temperature and separates the ferromagnetic phase T < Tc from the the paramagnetic phase T > Tc . The singularity associated with the critical temperature Tc is
240
P. M. A. Sloot et al.
also apparent in Fig. 21(b). The heat capacity at the transition is related with the large fluctuations found near the critical temperature. The peak becomes sharper for larger systems but does not diverge because the lattice has finite sizes (singularities are only found in an infinite system). 1.0
2.5
0.8
2.0
M
0.6 0.4
1.0
0.2
0.5
0.0 1.5
2.0
2.5
3.0
3.5
L = 32 x 32 L = 64 x 64 L = 128 x 128
1.5
C
L = 32 x 32 L = 64 x 64 L = 128 x 128
0.0 1.5
2.0
2.5
3.0
3.5
T
T
(a) Temperature dependence of the mean magnetization per spin for lattice size 32 × 32, 64 × 64, and 128 × 128
(b) Temperature dependence of the specific heat for lattice size 32 × 32, 64 × 64, and 128 × 128
Fig. 21. Temperature dependency of mean magnetization and specific heat 5.2.3 Continuous-Time Ising Spin System The standard Ising spin model represents a certain discrete-time model, as Monte Carlo steps are regarded to be time steps. However, the transient evolution of the Ising spin configurations is considered an artifact. Glauber [20] introduced continuous-time probabilistic dynamics for the Ising system to represent the time evolution of the physical system. The Ising spin model with continuous-time probabilistic dynamics cannot be solved by Monte Carlo simulation, since time has no explicit implication on the evolution of the system in the Monte Carlo execution model. To capture the asynchronous continuous-time dynamics correctly, the problem is mapped to the ACA model and is executed by event-driven simulation. In the continuous-time Ising spin model, a spin is allowed to change the state, a so-called spin flip, at random times. The attempted state change arrivals for a particular spin form a Poisson process. The Poisson arrival processes for different spins are independent, however, the arrival rate is the same for each spin. Similar to the Monte Carlo simulation, the attempted spin flip, or trial, is realized by calculating the energy difference ∆E between the new configuration and the old configuration. The spin flip is accepted with the Boltzmann probability e−β∆E . The discrete-time and continuous-time models are similar. They have the same distribution of the physical equilibrium quantities and both produce the same random sequences of configurations. The difference between the two models is the time scale at which the configurations are produced: in discrete-time, the time interval between trials is equal, and in continuous-time, the time intervals are random exponentially distributed.
Distributed Simulation with Cellular Automata
241
5.2.4 Optimistic Simulation of the Parallel ACA Model The resulting continuous-time Ising spin model is parallelized by geometric decomposition. The Ising spin lattice is partitioned into sub-lattices, and the sub-lattices are mapped onto parallel processors. To minimize the communication between sub-lattices, local copies of the neighbor boundaries are stored locally (see Fig. 22). By maintaining local copies of neighbor boundaries, spin values are only communicated when they are actually changed, rather than when they are only referenced. A spin flip along the boundary is communicated to the neighbors by an event message. The causal order of the event messages, and thus the spin updates, are guaranteed by the optimistic simulation mechanism.
a
a’ b’
PE 1 c
b
PE 2
c’
c’ PE 3
Fig. 22. Spatial decomposition of the Ising spin lattice. The grey areas are local copies of neighbor boundary strips. For example, processor PE 2 has a local copy of spin “a” owned by processor PE 1. Processors PE 2 and PE 3 both own a copy of spin “c”. The arrows in the figure indicate the event messages sent upon a spin flip
Asynchronous Cellular Automata, and thus also the Ising spin model, put additional requirements on the original formulation of the Time Warp method. For example, the Time Warp method, as all optimistic PDES methods, must save its state vector each time an event is executed. The state vector of an spatial decomposed ACA can be arbitrarily large, that is, all the cells in the sub-lattice are part of the state vector. For efficient memory management, we incorporate incremental state saving in the Time Warp method [51]. Incremental state saving stores not the full state vector, but saves only the changes to the state vector due to the execution of an event, which is only a small fraction of the full state. Besides efficient memory management, incremental state saving also reduces the time overhead related to the memory copy. With incremental state saving, no full copy of a state vector at a certain simulation time exists in the simulation execution environment. Instead, upon a rollback of a series of events, the state vector is reconstructed by processing the event–partial state collection in reverse order. Although incremental state
242
P. M. A. Sloot et al.
saving requires less state saving time and memory, there is an increased cost of state reconstruction. In general, the number of rolled back events is a fraction of the number of events executed during forward simulation. The fraction of rolled back events and the time overhead difference between state saving is an order of 10 bytes versus an order of 106 bytes, therefore incremental state saving is favorable in spatial decomposed ACA applications. Parallel Performance Results To validate the efficacy of the optimistic Time Warp simulation method, we have designed and implemented the continuoustime Ising spin model to study the parallel scalability behavior of the system. The experiments with the Ising spin model were performed on the Distributed ASCI Supercomputer (DAS) [15]. The DAS consists of four wide-area distributed clusters of total 200 Pentium Pro nodes. ATM is used to realize the wide-area interconnection between the clusters, while the Pentium Pro nodes within a cluster are connected with Myrinet system area network technology. To determine the speedup and relative efficiency of the parallel Ising spin implementation, the execution time of the parallel simulation on one processor is compared with the execution time on different number of processors. Figure 23(a) shows the relation between speedup and the number of processors for a fixed problem size. Together with the results from Fig. 23(b), we can see that the parallel Ising spin for T = 2.0 scales almost linearly up to 6 processors, but eventually drops to a relative efficiency of 0.83 for 8 processors. For temperature T = 3.0 the relative efficiency decreases gradually to 0.68 for 8 processors. The decreasing efficiency is mainly due to the increased costs to synchronize the parallel processes. The difference in parallel performance for different temperatures T can be explained by the measure of dynamic behavior that depends on the temperature of the system. According to the Boltzmann acceptance probability e−∆E/kB T , more trails are accepted as the temperature increases. If there are more changes in the system, relatively more synchronization messages must be sent between the sub-lattices, which affects the performance negatively. With the increase of the number of processors, the time overhead to synchronize the parallel simulation processes increases even more as there are more parallel processes that have to find their mutual synchronization point in time. The parallel ACA model with the Time Warp execution mechanism is an effective solver for continuous-time Ising spin systems. The microscopic ACA rules defining the spin flip probabilities describe the macroscopic magnetization behavior of the Ising spin system (see Fig. 21(a) and Fig. 21(b)). The optimistic simulation method scales reasonably well with the number of parallel processors, although precautions have to be taken. The required overhead time to synchronize the simulation increases with the number of processors. The synchronization overhead can be reduced by limiting the optimism of the Time Warp mechanism. The optimism control effectively bounds the time retardation between the parallel processors such that synchronization between the processors is faster accomplished.
Distributed Simulation with Cellular Automata
243
speedup
4 T = 2.0 T = 2.4 T = 3.0
2 0
0
2
4
6
8
relative efficiency
1.0
6
0.8 0.6 T = 2.0 T = 2.4 T = 3.0
0.4 0.2 0.0
0
2
4
6
8
processors
processors
(a) Speedup of parallel Ising spin for lattice size 128 × 128
(b) Relative efficiency of parallel Ising spin for l attice size 128 × 128
Fig. 23. Parallel performance of the Ising spin simulation
6
Summary and Discussion
A common denominator in the next generation scientific computing applications is the understanding of multi-scale phenomena, where systems are studied over large temporal and spatial scales. The simulation of these natural phenomena requires an ever increasing computer performance. Although computer performance as such still doubles approximately every year, it is our strong belief that the development of algorithms for modern computer architectures stays behind. One of the biggest challenges is, therefore, to develop completely new algorithmic approaches that support efficient modeling of natural phenomena and – at the same time – support efficient distributed simulation. Hence we need to boost the computational power instead of the computer power. One way to approach this is to look closely to the way nature itself performs computation. This is largely an unexplored research field. In this paper we discussed the concept of interacting virtual particles whose dynamics give rise to complex behavior, by using Cellular Automata as a compute metaphor for modeling and distributed simulation. As specific instances of Cellular Automata we described the concepts and use of parallel Lattice Gas Automata and the Lattice Boltzmann model. Although these models have been around for a decade, they were mainly studied from a theoretical physics point of view. Our interest is to study them from a computational science point of view, to apply them to real-life natural phenomena and to compare them with real experiments. We are on the front of the second wave of interest in discrete particle models, where the computational aspects and the modeling abilities are the main research questions. In addition we described a new approach to efficient distributed execution of asynchronous cellular automata through discrete event execution and apply this to different biological and physical models.
244
P. M. A. Sloot et al.
In the near future we will setup an international collaboration to use the developed models and concepts in the exploration of various challenging problems stemming from biology, ranging from tumor growth models to population dynamics. Population dynamics models for instance, can be used to understand fluctuations in natural populations, and are fundamental in fishery, ecological research and management of nature reserves. A well known example of a population dynamics model are the Lotka-Volterra equations, first proposed by Volterra to explain the oscillatory levels of certain fish catches in the Adriatic sea. The inability of Lotka-Volterra models to capture the individual stochastic interaction, has motivated the application of Cellular Automata as an alternative modeling paradigm [45,69]. In the CA model, the populations of preys and predators are no longer considered as homogeneous collections of individuals with identical average properties. CA models form the basis for population dynamics models based on discrete individuals, where the behavior of the individuals is formulated by microscopic rules. An additional advantage is that individual processes, such as movement in space, growth, reproduction, behavioral and ecological interaction, can be represented explicitly. A synchronous update scheme for the CA model is not realistic from a biological point of view: it is not likely that groups of individuals move simultaneously at the exact same time through space. As each individual behaves independently from the others, both in time and space, an asynchronous update scheme is required. The ACA model and the resulting event-driven simulation associates a simulation time with each update, thus enabling a more meaningful interpretation to the time evolution of individual based models.
Acknowledgments The authors wish to thank Arjen Schoneveld, David Dubbeldam, and Marco Visser for their contribution and assistance in preparing this paper.
References 1. Y. Bar-Yam. Dynamics of Complex Systems. Addison-Wesley, 1997. 213 2. R. G. Belleman, J. A. Kaandorp, and P. M. A. Sloot. A virtual environment for the exploration of diffusion and flow phenomena in complex geometries. Future Generation Computer Systems, 14:209–214, 1998. 236 3. H. Bersini and V. Detours. Asynchrony induces stability in cellular automata based models. In Proceedings of the IVth Conference on Artificial Life, pages 382–387, Cambridge, MA, July 1994. 214 4. K. Binder and D. W. Heermann. Monte Carlo Simulation in Statistical Physics. Springer-Verlag, New York, 1992. 239 5. D. Bovet and P. Crescenzi. Introduction to the Theory of Complexity. PrenticeHall, 1994. 207 6. S. G. Brush. History of the Lenz-Ising model. Rev. Mod. Phys., 39:883, 1967. 236 7. A. W. Burks. Essays on Cellular Automata. Univ. Illinois Press, Illinois, 1970. 206
Distributed Simulation with Cellular Automata
245
8. F. Celada and P. E. Seiden. A computer model of cellular interactions in the immune system. Immunology Today, 13(12):56–62, 1992. 214 9. K. M. Chandy and J. Misra. Distributed simulation: A case study in design and verification of distributed programs. IEEE Transactions on Software Engineering, SE-5(5):440–452, September 1979. 218 10. S. Chen and G. D. Doolen. Lattice Boltzmann method for fluid flows. Annu. Rev. Fluid Mech., 30:329, 1998. 225 11. B. Chopard and M. Droz. Cellular Automata Modeling of Physical Systems. Cambridge University Press, 1998. 219, 223 12. J. P. Crutchfield. Critical computation, phase transitions and hierarchical learning. In M. Yamaguti, editor, Towards the Harnessing of Chaos, Amsterdam, 1994. Elsevier Science. 212 13. J. P. Crutchfield and M. Mitchell. The evolution of emergent computation. Proceedings of the National Academy of Sciences, 92(23):10742, 1995. 209 14. J. P. Crutchfield and K. Young. Inferring statistical complexity. Phys. Rev. Lett, 63:105–108, 1989. 212, 212 15. The distributed ASCI supercomputer (DAS). http://www.cs.vu.nl/ bal/das.html. 242 16. D. Dubbeldam, A. G. Hoekstra, and P. M. A. Sloot. Computational aspects of multi-species lattice-gas automata. In P. M. A. Sloot, M. Bubak, A. G. Hoekstra, and L. O. Hertzberger, editors, Proceedings of the International Conference HPCN Europe ’99, volume 1593 of Lecture Notes on Computer Science, pages 339–349, 1999. 226 17. P. A. Dufort and C. J. Lumsden. The complexity and entropy of Turing machines. In Workshop on Physics and Computation, Dallas, Texas, 1994. 212 18. J. Feder. Fractals. Plenum Press, New York, London, 1988. 235 19. P. Gaspard and X.-J. Wang. Noise, chaos, and (ε, τ )-entropy per unit time. Physics Letters, 235(6):291–343, 1993. 210 20. R. J. Glauber. Time-dependent statistics of the Ising model. Journal of Mathematical Physics, 4(2):294–307, February 1963. 240 21. P. Grassberger. Long-range effects in an elementary cellular automaton. J. Stat. Phys., 45(1/2):27–39, 1986. 209, 210 22. J. L. Harper, B. R. Rosen, and J. White. The Growth and Form of Modular Organisms. The Royal Society London, London, 1986. 227 23. T. E. Ingerson and R. L. Buvel. Structure in asynchronous cellular automata. Physica D, 10(1/2):59–68, January 1984. 214 24. D. R. Jefferson. Virtual time. ACM Transactions on Programming Languages and Systems, 7(3):404–425, July 1985. 218, 218 25. J. A. Kaandorp. Fractal Modelling: Growth and Form in Biology. Springer-Verlag, Berlin, New York, 1994. 236, 236, 236 26. J. A. Kaandorp. Analysis and synthesis of radiate accretive growth in three dimensions. J. Theor. Biol., 175:39–55, 1995. 236 27. J. A. Kaandorp. Morphological analysis of growth forms of branching marine sessile organisms along environmental gradients. Mar. Biol., (in press). 227, 236 28. J. A. Kaandorp, C. Lowe, D. Frenkel, and P. M. A. Sloot. The effect of nutrient diffusion and flow on coral morphology. Phys. Rev. Lett., 77(11):2328–2331, 1996. 227, 227, 229, 235 29. J. A. Kaandorp and P. M. A. Sloot. Growth and form of sponges and corals in a moving fluid. In A. Carbone and M. Gromov, editors, Pattern Formation in Biology, Dynamics and Computer Graphics, Singapore. World Scientific. (In press). 227, 227, 233
246
P. M. A. Sloot et al.
30. D. Kandhai, A. G. Hoekstra, M. Kataja, J. Timonen, and P. M. A. Sloot. Lattice Boltzmann hydrodynamics on parallel systems. Comp. Phys. Comm., 111:14–26, 1998. 226 31. D. Kandhai, A. Koponen, A. Hoekstra, M. Kataja, J. Timonen, and P. M. A. Sloot. Implementation aspects of 3D lattice-BGK: Boundaries, accuracy and a new fast relaxation technique. In press, J. Comp. Phys., 1999. 226 32. D. Kandhai, D. Vidal, A. Hoekstra, H. Hoefsloot, P. Iedema, and P. Sloot. LatticeBoltzmann and finite-element simulations of fluid flow in a SMRX static mixer. In press, Int. J. Num. Meth. Fluids, 1999. 226 33. S. A. Kauffman. The Origins of Order. Oxford University Press, 1993. 209 34. A. Koponen, D. Kandhai, E. Hellin, M. Alava, A. Hoekstra, M. Kataja, K. Niskanen, P. Sloot, and J. Timonen. Permeability of three-dimensional random fiber webs. Phys. Rev. Lett., 80:716–719, 1998. 226 35. C. G. Langton. Studying artificial life with cellular automata. Physica D, 22:120– 149, 1986. 209, 209, 210 36. C. G. Langton. Computation at the edge of chaos: Phase transitions and emergent computation. Physica D, 42:12–37, 1990. 210 37. W. Li and N. H. Packard. The structure of the elementary cellular automata rule space. Complex Systems, 4:281–297, 1990. 208 38. K. Lindgren and M. G. Nordahl. Universal computation in simple one-dimensional cellular automata. Complex Systems, 4:299–318, 1990. 208 39. B. D. Lubachevsky. Efficient parallel simulation of asynchronous cellular arrays. Complex Systems, 1(6):1099–1123, December 1987. 214 40. B. D. Lubachevsky. Efficient parallel simulations of dynamic Ising spin systems. Journal of Computational Physics, 75(1):103–122, March 1988. 214 41. E. D. Lumer and G. Nicolis. Synchronous versus asynchronous dynamics in spatially distributed systems. Physica D, 71:440–452, 1994. 214 42. J. Machta. The computational complexity of pattern formation. Journal of Statistical Physics, 70(3/4):949–967, 1993. 229, 231 43. J. Machta and R. Greenlaw. The parallel complexity of growth models. Journal of Statistical Physics, 77:755–781, 1994. 229, 231 44. P. Manneville, N. Boccara, G. Y. Vichniac, and R. Bidaux, editors. Cellular Automata and Modeling of Complex Physical Systems, volume 46 of Springer Proceedings in Physics. Springer-Verlag, 1989. 206 45. E. McCauley, W. G. Wilson, and A. M. de Roos. Dynamics of age-structured and spatially structured predator-prey interactions: Individual based models and population-level formulations. The American Naturalist, 142(3):412–442, 1993. 244 46. M. Minsky. Computation: Finite and Infinite Machines. Prentice-Hall, Englewood Cliffs, N.J., 1967. 212 47. M. Mitchell. Computation in cellular automata: A selected review. In T. Gramss, S. Bornholdt, M. Gross, M. Mitchell, and T. Pellizzari, editors, Non-Standard Computation. Wiley-VCH, 1998. 212 48. M. Mitchell, J. P. Crutchfield, and P. T. Hraber. Dynamics, computation, and the ‘edge of chaos’: A re-examination. In G. Cowan, D. Pines, and D. Melzner, editors, Complexity: Metaphors, Models, and Reality, 1994. 212 49. C. Moore and M. G. Nordhal. Lattice gas prediction is p-complete. Technical report, Santa Fe Instute for Complex studies, 1997. SFI 97-04-043. 220 50. D. M. Nicol and J. H. Saltz. An analysis of scatter decomposition. IEEE transactions on computers, 39(11):1337–1345, 1990. 231
Distributed Simulation with Cellular Automata
247
51. B. J. Overeinder and P. M. A. Sloot. Application of Time Warp to parallel simulations with asynchronous cellular automata. In Proceedings of the 1993 European Simulation Symposium, pages 397–402, Delft, The Netherlands, October 1993. 214, 241 52. B. J. Overeinder and P. M. A. Sloot. Breaking the curse of dynamics by task migration: Pilot experiments in the polder metacomputer. In Recent Advances in Parallel Virtual Machine and Message Passing Interface, volume 1332 of Lecture Notes in Computer Science, pages 194–207, Berlin, 1997. Springer-Verlag. 204 53. B. J. Overeinder, P. M. A. Sloot, and L. O. Hertzberger. Time Warp on a Transputer platform: Pilot study with asynchronous cellular automata. In Parallel Computing and Transputer Applications, pages 1303–1312, Barcelona, Spain, September 1992. 214 54. N. H. Packard. Adaptation toward the edge of chaos. In J.A.S. Kelso, A.J. Mandell, and M.F. Shlesinger, editors, Dynamic Patterns in Complex Systems, 1988. 212 55. F. Reif. Fundamentals of Statistical and Thermal Physics. McGraw-Hill, New York, 1965. 238 56. J. F. de Ronde. Mapping in High Performance Computing. PhD thesis, Department of Computer Science, University of Amsterdam, Amsterdam, The Netherlands, February 1998. 205 57. J. F. de Ronde, A. Schoneveld, and P. M. A. Sloot. Load balancing by redundant decomposition and mapping. In H. Liddell, A. Colbrook, B. Hertzberger, and P. Sloot, editors, High Performance Computing and Networking (HPCN’96), pages 555–561, 1996. 231, 231 58. D. H. Rothman and S. Zaleski. Lattice-Gas Cellular Automata, Simple Models of Complex Hydrodynamics. Cambridge University Press, 1997. 219, 223, 224, 225 59. A. Schoneveld, J. F. de Ronde, and P. M. A. Sloot. Task allocation by parallel evolutionary computing. Journal of Parallel and Distributed Computing, 47(1):91– 97, 1997. 205 60. W. Shannon and W. Weaver. The Mathematical Theory of Communication. University of Illinois, Urbana, 1949. 209 61. H. D. Simon. Partioning of unstructured problems for parallel processing. Computing Systems in Engeneering, 2(2/3):135–148, 1991. 231 62. P. M. A. Sloot. High performance simulation. EUROSIM – Simulation News Europe, (15):15–18, 1995. 203 63. P. M. A. Sloot. Modelling for parallel simulation: Possibilities and pitfalls, invited lecture. In Eurosim’95, Simulation congress, pages 29–44, Amsterdam, the Netherlands, 1995. 203 64. P. M. A. Sloot, A. Schoneveld, J. F. de Ronde, and J. A. Kaandorp. Large scale simulations of complex systems Part I: Conceptual framework. Technical report, Santa Fe Instute for Complex studies, 1997. SFI Working Paper: 97-07-070. 204 65. P. M. A. Sloot and D. Talia. Parallel cellular automata: Special issue on cellular automata. Future Generation Computer Systems, 1999. (In press). 207 66. S. Ulam. Some mathematical problems connected with patterns of growth figures. In A.W. Burks, editor, Essays on Cellular Automata, Illinois, 1970. Univ. Illinois Press. 206 67. J. E. N. Veron and M. Pichon. Scleractinia of Eastern Australia Part 1, volume 1 of Australian Institute of Marine Science Monograph Series. Australian Government Publishing Service, Canberra, 1976. 227, 236 68. J. von Neumann. Theory of Self-Reproducing Automata. University of Illinois, Urbana, 1966. 206
248
P. M. A. Sloot et al.
69. W. G. Wilson, A. M. de Roos, and E. McCauley. Spatial instabilities within the diffusive Lotka-Volterra system: Individual-based simulation results. Theoretical Population Biology, 43:91–127, 1993. 244 70. A. T. Winfree, E. M. Winfree, and H. Seifert. Organizing centers in cellular excitable medium. Physica D, 17:109, 1985. 213 71. T. A. Witten and L. M. Sander. Diffusion-limited aggregation, a kinetic critical phenomenon. Phys. Rev. Lett., 47(19):1400–1403, 1981. 229 72. S. Wolfram. Universality and complexity in cellular automata. Physica D, 10:1–35, 1984. 208, 208, 209 73. S. Wolfram. Cellular Automata and Complexity. Addison-Wesley, 1994. 206, 208 74. B. P. Zeigler. Theory of Modelling and Simulation. John Wiley and Sons, Inc., New York, 1976. 214 75. Bernard P. Zeigler. Discrete event models for cell space simulation. International Journal of Theoretical Physics, 21(6/7):573–588, 1982. 214