Apr 30, 2010 - As one of the most successful Web 2.0 applications, social tagging ...... An IDE software for Web application development and deployment. 2.
WWW 2010 • Full Paper
April 26-30 • Raleigh • NC • USA
Document Recommendation in Social Tagging Services∗ †
Ziyu Guan1 , Can Wang1 , Jiajun Bu1 , Chun Chen1 , Kun Yang1 , Deng Cai2 , Xiaofei He2 1 Zhejiang Key Laboratory of Service Robot College of Computer Science, Zhejiang University Hangzhou, China, 310027
2 State Key Laboratory of CAD&CG College of Computer Science, Zhejiang University Hangzhou, China, 310027
{guanzh, wcan, bjj, chenc, yext}@zju.edu.cn
{dengcai, xiaofeihe}@cad.zju.edu.cn
ABSTRACT Social tagging services allow users to annotate various online resources with freely chosen keywords (tags). They not only facilitate the users in finding and organizing online resources, but also provide meaningful collaborative semantic data which can potentially be exploited by recommender systems. Traditional studies on recommender systems focused on user rating data, while recently social tagging data is becoming more and more prevalent. How to perform resource recommendation based on tagging data is an emerging research topic. In this paper we consider the problem of document (e.g. Web pages, research papers) recommendation using purely tagging data. That is, we only have data containing users, tags, documents and the relationships among them. We propose a novel graph-based representation learning algorithm for this purpose. The users, tags and documents are represented in the same semantic space in which two related objects are close to each other. For a given user, we recommend those documents that are sufficiently close to him/her. Experimental results on two data sets crawled from Del.icio.us and CiteULike show that our algorithm can generate promising recommendations and outperforms traditional recommendation algorithms.
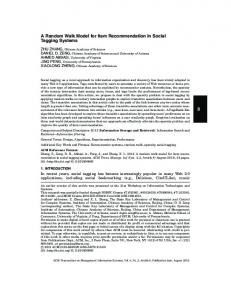
Figure 1: Two bookmarks saved by a user in Del.icio.us.
Flickr [11] have undergone a significant growth in the past several years. In these tagging services, the users can organize, share and retrieve online resources (e.g. Web pages in Del.icio.us, research papers in CiteULike and photos in Flickr) with tags easily. At the same time, the users of these tagging services have created large amounts of tagging data which have attracted much attention from the research community. Considering the scale of online resources, it is a nontrivial job for the users to find resources they are interested in. Most tagging services provide keyword-based search which returns resources annotated by the given tags. However, by using this search module, the users still have difficulties to discover interesting resources. On one hand, the number of returned results is usually very large. It is difficult for the user to browse thousands of returned resources to find the desired ones. On the other hand, the search module only returns resources which literally match the given tags, but ignoring semantically related ones. For example, in the case of Web pages, when a user searches for “automobile”, those pages tagged by “car” may not be retrieved. Moreover, it is a difficult and tedious task for the users to formulate proper queries and continually refine the queries during the search. Therefore, a recommendation module is needed in social tagging services which recommends the most desired resources to the users from thousands, or even millions of resources. Recommender systems have received much attention from both industry and academia since the early papers on collaborative filtering [26, 30]. Traditional recommender systems focused on the users’ explicit rating data, e.g. movie ratings [24], while social tagging data has its own special characteristics and is completely different from rating data. Figure 1 shows two bookmarks saved by a user in Del.icio.us. In each bookmark, the upper left corner shows the title of the Web page and the lower right corner gives the tags assigned to that page. The major differences between tagging data and rating data are 1) unlike rating data, tagging data does not
Categories and Subject Descriptors H.3.3 [Information Storage and Retrieval]: Information Search and Retrieval
General Terms Algorithms, experimentation.
Keywords Social tagging, recommender systems
1.
INTRODUCTION
As one of the most successful Web 2.0 applications, social tagging services such as Del.icio.us [9], CiteULike [7], and ∗This work is supported by National Key Technology R&D Program(2008BAH26B00) & Key S&T Projects of Zhejiang Province (No.2009C13053). †Corresponding author Copyright is held by the International World Wide Web Conference Committee (IW3C2). Distribution of these papers is limited to classroom use, and personal use by others. WWW 2010, April 26–30, 2010, Raleigh, North Carolina, USA. ACM 978-1-60558-799-8/10/04.
391
WWW 2010 • Full Paper
April 26-30 • Raleigh • NC • USA
Figure 2: A simple example illustrating the drawbacks of collaborative filtering methods on tagging data (i.e. without ratings, CF algorithms may not properly capture the interests of a user and the categorization information contained in tagging data is lost; CF algorithms suffer from data sparsity).
Figure 3: A high-level illustration of the structure of tagging data. represents user u assigning tag t to document d. For example, the first bookmark in Figure 1 corresponds to three triples which share the same user and Web page. We can aggregate across each of the three types of objects (i.e. user, tag, document) to get weighted relationships between objects belonging to the other two types. Specifically, if we aggregate across the “user” objects, we obtain the number of times a tag has been assigned to a document. If we aggregate across the “document” objects, we get the number of times a user has used a tag. In our approach we make use of such aggregations to construct weighted bipartite graphs between different types of objects.
contain users’ explicit preference information on resources; 2) tagging data involves three types of objects, i.e. user, tag and resource, while rating data only contains users and resources. These differences bring in new challenges as well as opportunities to the recommendation problem on tagging data. Although we can treat the binary relationships between users and resources (bookmarked or not) as pseudoratings and apply the collaborative filtering (CF) algorithms for unary data [17], there are still two problems:
1.2 Outline of Our Approach
• Without explicit ratings, CF algorithms may not properly capture the interests of the user. Moreover, the categorization information contained in tagging data is lost.
This paper addresses the problem of document recommendation in social tagging services. We formulate the problem into a graph-based representation learning framework and propose a novel algorithm named Multi-type Interrelated Objects Embedding (MIOE). We explicitly exploit relationships between each two types of objects, i.e. the annotation relationships between tags and documents, the usage relationships between tags and users, and the bookmarking relationships between users and documents. We also consider the affinity relationships among documents. Therefore, three bipartite graphs and one affinity graph are constructed. The representation learning algorithm aims at finding an optimal semantic space which preserves the connectivity structure of these graphs. In other words, if two objects are strongly connected, that is, the corresponding edge has a high weight, these two objects should be mapped close to each other in the learned space. By representing users, tags and documents in the same space, we can easily capture the latent relationships among these objects by using Euclidean distance in this semantic space. Thus, given a user, the closest documents which have not been bookmarked by this user are recommended to him/her. In contrast, a more straightforward solution is to represent users and documents in the tag space as TF-IDF tag profile vectors and recommend documents based on their similarities to the target user. However, this method does not consider semantic correlations between tags which is important for recommendation. For instance, if a user prefers to use “vehicles” to annotate documents related to cars, then the documents annotated by tag “cars” only can not be retrieved. Our proposed algorithm can naturally capture the correlations among tags. The primary focus of this paper is on text document. However, our algorithm is general and can be applied to any social tagging data as long as a notion of similarity between resources is defined.
• In tagging services the save frequency of resources follows power law [18], which indicates that the data is very sparse. This further hinders the applicability of the CF algorithms [1]. Figure 2 shows a simple example illustrating the situations. Both u1 and u2 bookmarkded resources r1 , r2 and r3 using tag t1 . In addition, u2 also bookmarked r4 and r5 , with t2 and t1 , respectively. Using traditional CF algorithms, we should recommend r4 and r5 to u1 since u2 is a similar user to u1 . However, we cannot determine the order of r4 and r5 when presenting them to u1 since they received the same rating, that is, 1 from u2 . Considering the tags used by the two users, we should rank r5 higher since u1 is more interested in the topic represented by t1 . Tags are collectively contributed by users and represent their comprehension of resources. They provide meaningful descriptors of resources and also implicitly reflect the users’ interests. Using tags, the sparsity problem may be alleviated. For instance, in Figure 2, though u1 and u3 have no common resources, they are still similar in that they have a common tag t1 . Therefore, tags can potentially play an important role in the recommendation module for a tagging service. In this paper we focus on text document recommendation based on social tagging data. In what follows, we will first introduce the structure of tagging data, and then outline our approach.
1.1 The Structure of Tagging Data The general structure of tagging data is shown in Figure 3. The three types of objects, users, tags and documents are interrelated with one another. Social tagging data can be viewed as a set of triples [16, 21, 13]. Each triple (u, d, t)
392
WWW 2010 • Full Paper
2.
April 26-30 • Raleigh • NC • USA
RELATED WORK
users are crucial for resource recommendation. Therefore, it can not be directly applied to resource recommendation.
Our work is related to two research areas: recommendation using social tagging data and graph-based subspace learning. Here we briefly review these related works.
2.2 Graph-based Subspace Learning Our work is also related to graph-based subspace learning. Typical algorithms include Laplacian Eigenmap [3] and Locally Linear Embedding [19, 28]. The fundamental idea of these algorithms is to construct an affinity graph as an approximation to the underlying data manifold and then learn a low dimensional representation for the data by preserving the affinity graph structure. With the learned space, we can estimate the similarity between two arbitrary instances. Traditional graph-based subspace learning algorithms only considered one type of data objects, while our algorithm deals with multi-type interrelated data objects. Recently, manifold alignment [14] is becoming a hot research topic. The problem is to “align” two data manifolds corresponding to two types of data objects into a common space by pairwise correspondence examples between the two types of objects. The differences between manifold alignment and our problem are: 1) The goal of manifold alignment is to find a one-to-one mapping between two types of objects, while our goal is to generate recommended document lists for the users by using tagging data; 2) Manifold alignment only considers pairwise correspondence bwteen two types of objects whereas we consider many-to-many relationships among three types of objects.
2.1 Recommendation Using Tagging Data Recently, there are increasing research interests on resource recommendation in social tagging services. Bogers and van den Bosch investigated using CiteULike data to recommend scientific articles (e.g. papers) [5]. They compared three different CF algorithms and found that user-based CF algorithm performed the best. There were also a lot of works trying to augment traditional recommendation approaches using tagging data [8, 33, 23, 10, 34]. De Gemmis et al. used tagging data to augment content-based recommender systems by treating user applied tags as additional content of documents [8]. Tso-Sutter et al. [33] reduced three types of objects (users, items and tags) of tagging data to two types by either treating tags as users or as items and then applied traditional item-based or user-based CF algorithms [17], respectively. They fused the scores computed by CF algorithms using a linear interpolation to generate the final recommendation. Nakamoto et al. modified user-based CF algorithm to incorporate tagging information in each step [23]. Diederich et al. created TF-IDF tag profiles for users and used this profile vector to measure user-user similarities in the user-based CF algorithm [10]. Wetzker et al. modified Probabilistic Latent Semantic Analysis (PLSA) to model cooccurrence relationships between users and resources and those between resources and tags [34]. They assumed these two types of co-occurrence relationships shared the same set of hidden topics. Resources were recommended to a user according to the probabilities of those resources given the user. The above five studies heuristically exploited tagging information in traditional recommendation approaches. They did not fully exploit the structural information in tagging data (shown in Figure 3). Shepitsen et al. proposed a personalized recommendation algorithm for social tagging services which relied on hierarchical tag clusters [31]. Their algorithm required users to enter query tags to get recommendations. Sen et al. generated item recommendations by firstly inferring a user’s tag preferences and then calculating item preferences based on tag preferences [29]. Nevertheless, their method required various information besides tagging information, such as clickthrough information and rating information. The clickthrough information may be hard to obtain and the rating information is usually absent in social tagging data. Compared to their approach, our algorithm is more general in that it relies on social tagging data only. Another related problem in social tagging services is tag recommendation [13, 32]. Tag recommendation is different from resource recommendation in that a tag recommender recommends related tags for a resource (possibly considering the tagging user, i.e. personalization) while a resource recommender recommends resources to a user. In [13], Guan et al. proposed a graph-based ranking algorithm for personalized tag recommendation. The algorithm takes both the target user’s historical tags and the target document as queries, accounting for personalization and relevance, respectively, and then ranks the tags accordingly. Top ranked tags are recommended to the target user. However, the algorithm does not explicitly incorporate users into its model, whereas
3. MULTI-TYPE INTERRELATED OBJECTS EMBEDDING In this section we propose our algorithm Multi-type Interrelated Objects Embedding (MIOE) for document recommendation on social tagging data. We begin with a description of the general ideas of MIOE.
3.1 General Ideas The basic intuition behind MIOE is: If a user u has used a tag t many times, then he/she has strong interest in the topic represented by the tag t; If t has been applied to document d many times, then d is strongly related to the topic represented by t. We should recommend such document to the user. We consider the recommendation problem from a representation learning perspective and aim at finding a semantic space in which related objects (users, tags ,documents) are close to one another. Intuitively, those documents which are close to but not bookmarked by a user should be recommended to that user. To model the relationships between users and tags and that between tags and documents, we construct two weighted bipartite graphs where the edge weights are obtained by using the corresponding aggregation methods described in section 1.1. For example, the edge weight between a user u and a tag t denotes the number of times the user u has applied the tag t to different documents. We also construct an unweighted bipartite graph to model the bookmarking relationships between users and documents since this type of relationships cannot be inferred from the former two bipartite graphs. We keep this graph unweighted because of the fact that a user using more tags to annotate a document dose not necessarily mean he/she is more interested in the document. Note that the former two bipartite graphs encode the collaborative tagging information, while the latter one represents the
393
WWW 2010 • Full Paper
April 26-30 • Raleigh • NC • USA g and p are defined similarly for T and D, respectively. Then we have the following cost function Q(f , g, p) = α
|U | |T | X X
ut Rij (fi − gj )2 + β
|U | |D| X X
ud Rij (fi − pj )2 +
i=1 j=1
+ γ
|T | |D| X X
td Rij (gi − pj )2
i=1 j=1
i=1 j=1
|D| 1 X η Wij (pi − pj )2 (. 1) 2 i,j=1
The first term on the right-hand side of equal sign means if ui has used tj frequently, they should be close in the space. The second term indicates if many users have annotated dj using ti , then ti and dj should be close in the space. The third term means that each user should be close to his/her bookmarked documents in the space. Finally, the fourth term imposes a smoothness constraint on the document manifold [3]. The trade-off among these terms is controlled by the parameters α, β and γ and η, where 0 < α, β, γ, η < 1 and α + β + γ + η = 1. We define seven diagonal matrices: Dut , Dtu , Dtd , Ddt , Dud , Ddu and D, where Dut and Dud have size | U | × | U |, Dtu and Dtd have size | T | × | T |, and Ddu , Ddt and D are | D | × | D | matrices. The (i, i)th-element of D equals to the sum of the i-th row of W. The (i, i)thelements of Dut and Dtu equal to the sum of the i-th row and the sum of the i-th column of Rut , respectively. The (i, i)th-elements of Dtd and Ddt are defined similarly for matrix Rtd , and so are Dud and Ddu for Rud . With simple algebraic transformations, the first term in Equation (1) can be rewritten as follows:
Figure 4: An illustration of the recommendation problem that we consider. Users, tags and documents are connected with one another by three bipartite graphs. We also have an affinity graph for documents. collaborative information exploited by CF methods (without explicit ratings). In addition to these bipartite graphs, we also construct an affinity graph for documents. By leveraging contents of documents, we can alleviate the cold-start problem for documents [1]. In what follows we show how to find the optimal semantic space that best preserves different affinity relationships modeled by these graphs.
3.2 Problem Formulation The sketch of the problem is illustrated in Figure 4. We have three types of objects, users, tags and documents, and let U, T and D denote the sets of users, tags and documents, respectively. The relationships among U, T and D are described by three bipartite graphs: HU ,T , HT ,D and HU ,D . We also have an affinity graph GD that describes the similarity relationships between documents. Our recommendation problem is, given a user u ∈ U, to recommend u a list of documents from D in which the user would be interested with the highest probabilities. We formulate it as a representation learning problem as follows. Let Rut be a | U | × | T | weighted adjacency matrix corresponding to HU ,T , Rtd be a | T | × | D | weighted adjacency matrix corresponding to HT ,D and Rud be a | U | × | D | unweighted adjacency matrix corresponding to HU ,D . W represents the affinity matrix corresponding to GD which has size | D | × | D |. Then the problem becomes, given Rut , Rtd , Rud and W, finding a semantic space for users, tags and documents which best preserves the connectivity structures of those graphs. Once the semantic space is learned, the closest documents that the user has not bookmarked can be recommended to that user.
|U | |T | X X
ut Rij (fi − gj )2
|U | |T | X X
ut Rij fi2 − 2fi gj + gj2
i=1 j=1
=
i=1 j=1
=
|U | X
ut 2 Dii fi +
i=1
|T | X
tu 2 Djj gj − 2
j=1
�
|U | |T | X X
ut fi (Rij )gj
i=1 j=1
= f T Dut f + gT Dtu g − 2f T Rut g.
(2)
Similarly, the second and third terms of Equation (1) can be transformed into matrix-vector forms as follows: |T | |D| X X
td Rij (gi − pj )2
i=1 j=1
=
gT Dtd g + pT Ddt p − 2gT Rtd p. |U | |D| X X
(3)
ud Rij (fi − pj )2
i=1 j=1
3.3 Learning the Optimal Semantic Space
= f T Dud f + pT Ddu p − 2f T Rud p.
To learn the optimal semantic space, we adopt a similar idea to that of graph-based subspace learning [3, 15, 22]. That is, if two objects are strongly connected, then they should be mapped close to each other in the learned space.
(4)
The fourth term can be written using graph Laplacian matrix as [3] |D| 1 X η Wij (pi − pj )2 = pT Lp, 2 i,j=1
3.3.1 1-dimensional Embedding Let k be the dimensionality of the target space. We first consider the simplest case that k = 1. We define a | U | ×1 vector f for U in which fi is the coordinate of ui on the line.
(5)
where L = D−W is the graph Laplacian matrix. According to Equation (2), (3), (4) and (5), we can rewrite the cost
394
WWW 2010 • Full Paper
April 26-30 • Raleigh • NC • USA
function Q(f , g, p) in the matrix-vector form: � � Q(f , g, p) = α f T Dut f + gT Dtu g − 2f T Rut g � � +β gT Dtd g + pT Ddt p − 2gT Rtd p � � +γ f T Dud f + pT Ddu p − 2f T Rud p
Thus, the optimization problem becomes min h
3.3.2 Generalize to k-dimensional Embedding In practice, we need to learn a k-dimensional (k > 1) representation in order to better capture the relationships between objects. To this end, we define a | U | ×k matrix F = [f1 f2 . . . fk ] where vector fi contain all the users’ coordinates on the i-th dimension. The matrices G = [g1 g2 . . . gk ] and P = [p1 p2 . . . pk ] are defined similarly for T and D, respectively. We also define a matrix H = [h1 h2 . . . hk ] where hi = [fiT giT pTi ]T . For each dimension i ∈ {1, . . . , k}, we need to minimize Q(fi , gi , pi ) and maximize (fiT fi +giT gi +pTi pi ). Therefore, the overall cost function is Pk i=1 Q(fi , gi , pi ) ˜ Q(F, G, P) = Pk T T T (f i=1 i fi + gi gi + pi pi ) Pk Pk T˜ T˜ hi Lhi i=1 (H LH)ii = Pi=1 = P k k T T i=1 hi hi i=1 (H H)ii T˜ tr(H LH) = , (14) tr(HT H)
−2αf T Rut g − 2βgT Rtd p − 2γf T Rud p. (6)
In order to remove an arbitrary scaling factor in the embedding, we minimize the Rayleigh quotient [14] as follows: Q(f , g, p) , f T f + gT g + pT p
(7)
which is equivalent to minimize Q(f , g, p) with the constraint f T f + gT g + pT p = 1. We define an augmented vector h = [f T gT pT ]T . Note that f T Rut g, gT Rtd p and f T Rud p are scalars and a scalar’s transpose equals to itself. Thus, Equation (7) can be rewritten to: min h
˜ hT Lh , s.t. hT e = 0, T h h
(8)
˜ is where e is the vector with all elements equal to 1 and L defined as αDut + γDud −αRut −γRud � ut T ˜ = L αDtu + βDtd −βRtd −α R . � � ud T td T dt du −γ R −β R βD + γD + ηL (9) ˜ One can easily verify Q(f , g, p) = hT Lh. In (8), we impose a constraint hT e = 0. This is because e is the minimum solution of the objective function Q(f , g, p) (it can be verified that Q(e) = 0). However, this solution projects all objects onto one point and thus should be removed. One can eas˜ is positive semi-definite. By the ily see that the matrix L Rayleigh-Ritz theorem [20], the solution of this optimization problem is given by the eigenvector corresponding to ˜ the second smallest eigenvalue of L. Alternatively, we can maximize the global variance in the target subspace instead of maximizing (f T f + gT g + pT p). Recall that the variance of a random variable x is defined as Z Z var(x) = (x − µ)2 dP (x), µ = xdP (x), (10) where dP (x) is the probability of observing x. In the discrete case, the probability of observing a node on these graphs can be estimated by the node’s degree [6]. Thus, the variance of f , g and p is (assuming zero mean): ˜ var(f , g, p) = hT Dh,
(13)
Likewise, this optimization problem can be solved by finding the generalized eigenvector corresponding to the second ˜ D). ˜ smallest eigenvalue of (L,
+ηpT Lp � � � � = f T αDut + γDud f + gT αDtu + βDtd g � � +pT βDdt + γDdu + L p
˜ , g, p) = Q(f
˜ hT Lh , s.t. hT e = 0, ˜ hT Dh
(11)
˜ is a diagonal matrix which is defined as where D αDut + γDud 0 0 tu td ˜ = . D 0 αD + βD 0 0 0 βDdt + γDdu + ηD (12)
395
where tr(·) denotes the trace of a matrix. Consequently, the optimization problem in (8) becomes min H
˜ tr(HT LH) , s.t. hTi e = 0, ∀i ∈ {1, . . . , k}. tr(HT H)
(15)
Similarly, we can derive the corresponding k-dimensional embedding optimization problem for that in Equation (13): min H
˜ tr(HT LH) , s.t. hTi e = 0, ∀i ∈ {1, . . . , k}. ˜ tr(HT DH)
(16)
The solution of (15) is obtained by arranging the first k eigenvectors corresponding to the smallest nonzero eigenval˜ as columns of H, while the optimization problem in ues of L (16) is solved by the first k generalized eigenvectors corre˜ D) ˜ [20]. sponding to the smallest nonzero eigenvalues of (L,
3.4 Graph Construction As aforementioned, we construct Rut and Rtd using tagging data aggregation methods described in section 1.1. Formally, let B = {(ui , dj , tk ) | ui ∈ U, dj ∈ D, tk ∈ T , ui has used tk to annotate dj } represent the set of tagging data. ut We set Rij =| {dk | dk ∈ D and (ui , dk , tj ) ∈ B} | and td Rij =| {uk | uk ∈ U and (uk , dj , ti ) ∈ B} |. Rud is unud weighted and Rij = 1 if ∃tk ∈ T , (ui , dj , tk ) ∈ B and otherud wise Rij = 0. We normalize Rut and Rtd to eliminate the bias to active users, general tags and popular documents as follows (e.g. the fact that u1 has used the tag t more times than u2 dose not necessarily means u1 should be closer to t than u2 in the learned space): ut Rij , qP |U | ut ut k=1 Rik l=1 Rlj
ut Rij = qP |T |
(17)
WWW 2010 • Full Paper
April 26-30 • Raleigh • NC • USA CiteULike dataset, we downloaded the tagging data snapshot1 of Aug. 15th, 2009. The preprocessing steps is similar to those for the Del.icio.us dataset, except that we retained research papers that had been saved by at least 2 selected users. Abstracts of the selected papers were crawled from CiteULike or the corresponding online portals (CiteULike failed to extract abstracts of some papers). Contents of documents (extracted texts for Web pages, abstracts for papers) were represented as vectors using Vector Space Model (VSM) [2]. Table 1 shows the statistics of the two datasets. The major difference between the two datasets is the number of bookmarks, which is a result of our relaxation on the save frequency constraint on the CiteULike dataset. As aforementioned, the save frequency of documents in tagging services follows power law [18], which means the majority of documents are only saved 1 or 2 times by the users while only a small number of documents are saved by many users. Thus, CiteULike dataset better reflects the real world situations than Del.icio.us dataset (i.e. the save frequency distribution in CiteULike dataset is more like a “long tail” than that of Del.icio.us dataset). Both of the two datasets have much more documents than users. This also conforms the real world conditions (e.g. there are infinite number of Web pages for users to tag).
Table 1: The statistics of Del.icio.us and CiteULike datasets. Del.icio.us CiteULike No. of users 300 300 No. of tags 14,790 10,753 No. of documents 12,819 11,558 No. of bookmarks 122,879 34,061 td Rij . qP |T | td td R R k=1 ik l=1 lj
td Rij = qP |D|
(18)
The matrix W is constructed as follows sim(di , dj ), if di is among the m nearest neighbors of dj , or dj is among the Wij = , (19) m nearest neighbors of di 0, otherwise
where sim(di , dj ) denotes the similarity between di and dj measured by document content (word vector representation). We use cosine similarity in this paper.
3.5 Document Recommendation Using MIOE
4.2 Compared Algorithms
Once the optimal space is obtained (i.e. the optimal H), we can recommend documents to a user according to their Euclidean distances to the user. The algorithmic steps are as follows: Firstly we construct Rut , Rtd , Rud and W from tagging data and document content (Rut and Rtd are normalized according to Equation (17) and (18)); Secondly, we ˜ and D ˜ which are defined use these matrices to construct L in Equation (9) and (12), respectively; Then we compute the first k generalized eigenvectors corresponding to the small˜ D) ˜ to form matrix H; Finally, est nonzero eigenvalues of (L, given a target user, we compute distances between the user and all his/her unsaved documents by using the corresponding row vectors in H and recommend the closest ones to that user. In practice, new objects (users, tags and documents) will continually join in the tagging data. Recomputing the optimal space for each new object is obviously costly. We can approximate the positions of new objects in the learned space by using approximated eigenfunctions based on the kernel trick [4]. Thus, we only need to recompute the optimal space periodically. Please see [4] for the details.
4.
We compare our algorithm to four previous recommendation algorithms. The first two are CF algorithms: User-CF and Funk-SVD. User-CF is a version of user-based CF algorithm for unary data (bookmarked or not) similar to those described in [17]. We choose user-based CF algorithm in that unlike traditional datasets for CF, our datasets have much more “items” than users. Funk-SVD employs Singular Value Decomposition technique to approximate the original user-item matrix using a low rank matrix and shows strong performance in the Netflix competition [12]. The third algorithm, Tag Vector Similarity (TVS), represents users and documents in the tag space as TF-IDF tag profile vectors and recommend the most similar unsaved documents to a user based on corresponding tag vectors. Finally, we also employ a content-based recommender algorithm because MIOE exploits the document contents. We implement a variant of the classical Rocchio content-based recommender [1, 27]. With a similar idea to [25], we maintain multiple profile vectors for a user to better capture the user’s interests. To recommend documents to the user, an interestingness score is assigned to each document unsaved by the user. The score is determined by the similarity of the document to the most similar user profile and the number of training documents for that profile. We call this algorithm Content Vector Similarity (CVS). The parameters of each algorithm are tuned on the two datasets. When constructing W, we empirically set m = 50. In experiments, we set the number of recommended documents to 10.
EXPERIMENTS
4.1 Experimental Datasets We evaluate our algorithm on two tagging datasets collected from Del.icio.us (Web documents) [9] and CiteULike (research papers) [7]. Regarding the Del.icio.us dataset, we subscribed to 20 popular tags from Aug. 28th, 2009 to Sept. 2nd, 2009 to collect users. Then we crawled all bookmarks for the collected users. Bookmarks with no tags were removed. We selected 300 users with the largest amounts of bookmarks. From all the Web pages bookmarked by the selected users, we filtered out those with save frequencies less than 5. The page contents of remaining Web pages were crawled. Among the successfully downloaded pages, we discarded non-HTML pages and non-English pages. For the
4.3 Evaluation Methodology To evaluate our algorithm and the four compared algorithms, from each of the two datasets we randomly pick 30 users as test users and treat the remaining 270 users as training data. For each test user, we sort his/her bookmarks by time and use the first 50% as input for model construction 1
396
http://www.citeulike.org/faq/data.adp
WWW 2010 • Full Paper
April 26-30 • Raleigh • NC • USA 0.4
0.18 MIOE TVS Rocchio−var User−CF Funk−SVD
0.16
0.35 0.3
0.4
NDCG@10
0.1
0.25 0.2
0.08 0.15
0.06
0.02
75
80
85
90
95
0.05
100
0.35 0.3 0.25 0.2
0.1
0.04
MIOE TVS Rocchio−var User−CF Funk−SVD
0.45
0.12
MAP
Precision
0.14
0.5 MIOE TVS Rocchio−var User−CF Funk−SVD
0.15
75
Percentage of Training Data (%)
80
85
90
95
0.1
100
75
Percentage of Training Data (%)
(a)
80
85
90
95
100
Percentage of Training Data (%)
(b)
(c)
Figure 5: Comparison of recommendation algorithms on Del.icio.us dataset in terms of (a) Precision (b) MAP and (c) NDCG. Different percentages of training data are considered. The performance are averaged over all test users. 0.35
0.5 MIOE TVS Rocchio−var User−CF
0.3
0.4
0.25
MIOE TVS Rocchio−var User−CF
0.6 0.55 0.5
0.2 0.15
NDCG@10
0.35
MAP
Precision
0.65 MIOE TVS Rocchio−var User−CF
0.45
0.3 0.25
0.45 0.4 0.35 0.3
0.1
0.2 0.25
0.05
0.15
0
0.1
75
80
85
90
95
100
0.2 75
Percentage of Training Data (%)
80
85
90
95
Percentage of Training Data (%)
(a)
(b)
100
0.15
75
80
85
90
95
100
Percentage of Training Data (%)
(c)
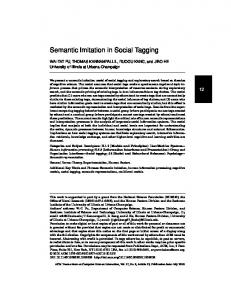
Figure 6: Comparison of recommendation algorithms on CiteULike dataset in terms of (a) Precision (b) MAP and (c) NDCG. Different percentages of training data are considered. The performance are averaged over all test users. (training). The remaining 50% bookmarks are used for evaluation (the ground truth). In our experiments we also vary the training data size from 75% to 100% of all 270 training users’ bookmarks to investigate the performance of each algorithm under different amounts of training data. For evaluation metrics, we use Precision, Mean Average Precision (MAP) and Normalized Discount Cumulative Gain (NDCG) to measure recommendation performance. Precision is defined as the number of correctly recommended documents (i.e. those which also appear in the user’s test bookmarks) divided by the number of all recommended documents. Average Precision (AP) is the average of precision scores after each correctly recommended document: P i Precision@i × corri AP = , (20) No. of correctly recommended documents
test bookmarks and 0 otherwise. Zn is chosen so that the perfect ranking has a NDCG value of 1.
4.4 Performance Comparison We compare MIOE with the other four algorithms on the two datasets with respect to different percentages of training data. We use precision, MAP and NDCG to measure the performance of recommendation algorithms. The results are presented in Figure 5 and 6, for Del.icio.us and CiteULike, respectively. One can easily see that on both datasets MIOE outperforms the other recommendation algorithms in terms of all three evaluation metrics. The performance of CVS dose not change when varying the training data size. This is because CVS exploits only test users’ training bookmarks (i.e. the 50% for model construction) and ignores all other users’ bookmarks. Thus, CVS cannot leverage collaborative information to achieve better performance. Note that CVS performs better on CiteULike dataset than on Del.icio.us dataset. The reason may be that the abstracts of papers are well-written and contain less noise, while Web pages are less structured and noisy. TVS also performs better on CiteULike dataset. This may because there is fewer ambiguous tags in CiteULike dataset. In fact, all algorithms’ performance increases when we change the dataset to CiteULike, except for two CF algorithms. We do not show the curve of Funk-SVD on CiteULike dataset since the algorithm com-
where Precision@i is the precision at ranking position i and corri = 1 if the document at position i is correctly recommended, otherwise corri = 0. MAP is the mean of average precision scores over all test users. NDCG at position n is defined as NDCG@n = Zn
n X
(2ri − 1)/ log2 (i + 1),
(21)
i=1
where ri is the relevance rating of document at rank i. In our case, ri is 1 if the corresponding document is in the user’s
397
WWW 2010 • Full Paper
April 26-30 • Raleigh • NC • USA
Table 2: Comparison of recommendation algorithms in terms of NDCG@3, NDCG@5 and NDCG@7 on Del.icio.us dataset. The results of 80%, 90% and 100% training data are reported. Algorhtms MIOE TVS CVS User-CF Funk-SVD
80% Training Data NDCG@3 NDCG@5 NDCG@7 0.1533 0.2142 0.2443 0.1289 0.1600 0.2082 0.1292 0.1531 0.1932 0.1255 0.1617 0.1976 0.0415 0.0881 0.1229
90% Training Data NDCG@3 NDCG@5 NDCG@7 0.2274 0.3198 0.3738 0.1095 0.1405 0.1703 0.1292 0.1531 0.1932 0.1333 0.1687 0.2312 0.0710 0.0942 0.1216
100% Training Data NDCG@3 NDCG@5 NDCG@7 0.2237 0.3244 0.3760 0.1067 0.1347 0.1459 0.1292 0.1531 0.1932 0.1415 0.1631 0.2218 0.1419 0.1732 0.2143
Table 3: Comparison of recommendation algorithms in terms of NDCG@3, NDCG@5 and NDCG@7 on CiteULike dataset. The results of 80%, 90% and 100% training data are reported. Algorhtms MIOE TVS CVS User-CF
80% Training Data NDCG@3 NDCG@5 NDCG@7 0.3255 0.3509 0.4117 0.2748 0.2939 0.3473 0.2265 0.2472 0.2883 0.0765 0.1165 0.1373
90% Training Data NDCG@3 NDCG@5 NDCG@7 0.3483 0.4042 0.4493 0.2611 0.2883 0.3366 0.2265 0.2472 0.2883 0.1748 0.2085 0.2264
pletely fails on CiteULike. The performance degradation of User-CF and Funk-SVD may be explained as follows: 1) CF algorithms suffer from the sparsity problem [1]. Concerning 100% training data, the density of matrix Rud of Del.icio.us dataset is 3.5%, while that of CiteULike dataset is only 0.5%! 2) As argued in Section 1, without explicit user ratings, CF algorithms may not be able to properly capture a user’s interests. By investigating the recommended lists generated by CF algorithms (i.e. User-CF and Funk-SVD), we find there is a high similarity among the recommended lists for test users. On the contrary, our algorithm can leverage tag-based collaborative information (Rut , Rtd ), traditional collaborative information (Rud ) and contents of documents (W) to achieve the best performance of all algorithms involved. As mentioned before, CiteULike dataset better reflects the real world situations than Del.icio.us dataset. Therefore, it is more meaningful that MIOE outperforms the other four algorithms on CiteULike dataset. We report the performance of five recommendation algorithms on the two datasets in terms of NDCG@3, NDCG@5 and NDCG@7, as shown in Table 2 (Del.icio.us) and Table 3 (CiteULike, excluding Funk-SVD). In all cases our proposed algorithm outperforms the other algorithms. We observe that MAP and NDCG of Funk-SVD grow rapidly when training data increases on Del.icio.us dataset (see Figure 5 and Table 2). This indicates Funk-SVD can correctly predict users’ interests at top positions in the recommended list when Rud is relatively dense.
100% Training Data NDCG@3 NDCG@5 NDCG@7 0.4326 0.4736 0.5093 0.3191 0.3505 0.3988 0.2265 0.2472 0.2883 0.1748 0.2308 0.2444
we set η = 0.05 and let α = β. Then we vary α and β against γ. Figure 7 shows the results. The general trends of MIOE’s curves are consistent: first increasing then decreasing. This means that tag-based collaborative information and traditional collaborative information are complementary to each other and that we can achieve better performance by trading off between those two types of information. In Figure 7 we also show the performance of TVS for the 100% training data case of CiteULike dataset (dotted lines) since it is the best in this case among all compared algorithms. As can be seen, our algorithm outperforms TVS in a wide range of parameter variation. Another important parameter for MIOE is the dimensionality of the target space (k). We fixed α, β, γ and η and test the impact of different values of k on the performance of MIOE. The results are shown in Figure 8. As can be seen, the performance of MIOE is not that good when k is small (< 15). When k increases, both precision and MAP increase rapidly. The best value of k is around 150. Again, the dotted lines represent the performance of TVS in the same case (i.e. 100% training data of CiteULike dataset). We can see that our algorithm outperforms TVS when k is roughly between 50 and 250.
4.6 Case Studies We show some case studies in this subsection to demonstrate the effectiveness of MIOE. The results are based on Del.icio.us dataset with 100% training data. Table 4 shows the top three recommended Web pages for user u273 (273 is the index of the user in our dataset). We also list the user’s frequently used tags in training data as indicators of his/her interests. We can find that “Web design” and “Web development” are the major concerned topics of u273 and the top recommended Web pages conform to his/her tastes. TVS can also generate such kind of recommendations since it matches documents’ tag profile vectors with that of a user. However, as mention in section 1.2, MIOE is different from TVS in that MIOE can capture and exploit correlations among tags which may be important for recommendation. Table 5 presents six nearest tags in the learned semantic space for each of five selected tags. We can see that MIOE can mine the semantic correlations among tags from tagging data. Consequently, users that are close to the
4.5 Parameter Selection for MIOE In this experiment, we employ 100% training data and use Precision and MAP as evaluation metrics. We only report results on CiteULike dataset due to space limitation. MIOE has four parameters (three free parameters) which control the relative importance of different types of affinity constraints. For example, if we set α to a relatively high value, it means we will receive a relatively high punishment if we make strongly connected users and tags far apart. We can regard Rut and Rtd as representing tag-based collaborative information while Rud represents collaborative information exploited by traditional CF methods. Thus we vary α and β against γ to investigate the relative contribution of those two types of information to MIOE’s performance. In particular,
398
WWW 2010 • Full Paper
April 26-30 • Raleigh • NC • USA
0.27
0.46 MIOE TVS
0.26
MIOE TVS 0.44
0.25 0.42
0.23
MAP
Precision
0.24
0.22 0.21
0.4
0.38
0.2 0.36 0.19 0.18 0
0.05
0.1
0.15
0.2
0.25
0.3
0.34 0
0.35
0.05
0.1
0.15
α&β
0.2
0.25
0.3
0.35
α&β
(a)
(b)
Figure 7: Performance of MIOE on CiteULike dataset when varying parameters, measured by (a) Precision and (b) MAP. We set η = 0.05 and let α = β. Then we vary α and β against γ. α and β represent importance of tag-based collaborative information while γ represents importance of traditional collaborative information. The dotted lines represent the performance of the best compared algorithm (TVS) in the same case (100% training data on CiteULike). 0.35
0.5 MIOE TVS
0.3
MIOE TVS
0.45 0.4
0.25
MAP
Precision
0.35 0.2
0.15
0.3 0.25 0.2
0.1 0.15 0.05
0 0
0.1
50
100
150
200
250
300
350
400
450
0.05 0
500
50
100
150
200
250
k
300
350
400
450
500
k
(a)
(b)
Figure 8: Performance of MIOE on CiteULike dataset measured by (a) Precision and (b) MAP when varying the semantic space dimensionality. The dotted lines represent the performance of the best compared algorithm (TVS) in the same case (100% training data on CiteULike). selected tags are also close to those tags on the right side. Taking “music” as an example, “songza” is the name of a music search engine2 and “Deezer” is the first free music-ondemand Website3 . They are semantically related to “music”. As another example, “humor” can be viewed as a synonym of “funny”. In test users there is a user having “funny” and “interesting” (but not “humor”) in his/her tag profile. We find the first recommended Web page for that user by MIOE has “humor” as its second most frequently applied tag (“funny” is less frequent and “interesting” is absent). To the contrary, TVS cannot put such document at high ranking positions since it treat each tag independently. This case study explains why MIOE can outperform those tag profile vector based approaches like TVS. 2 3
Table 5: Six nearest tags in the learned space for each of the five selected tags from Del.icio.us dataset. Selected Tag Six Nearest Tags shopping product, buy, consumer, merchandise, products, shop funny humor, humour, culture, weird, interesting, cool food kitchen, eating, foodblog, craving, gourmet, Cooking music mp3, songza, socialpl, Deezer, musicsearch, pandora travel trip, bookings, trvl, charter, transportation, travelsearch
http://songza.fm/ http://www.deezer.com/
399
WWW 2010 • Full Paper
April 26-30 • Raleigh • NC • USA
Table 4: Top three recommended Web pages for user u273 in Del.icio.us dataset. We show the frequently used tags (in training data) for u273 in the top cell, where numbers in parentheses are corresponding frequencies. Frequently used tags: blog(30), design(25), rails(22), programming(20), reference(15), javascript(15), ajax(15), development(14), software(13), apple(13), ruby(11) Rank URL Description 1 http://www.aptana.com/ An IDE software for Web application development and deployment. 2 http://www.squidfingers.com/ The personal portfolio of a graphic designer who design background patterns and wallpapers for web pages. 3 http://www.fudgie.org/ A multiple server log file visuallizer written in Ruby.
5.
CONCLUSIONS
Uncertainty in Artificial Intelligence, pages 120–127, 2005. [15] X. He, D. Cai, and J. Han. Learning a maximum margin subspace for image retrieval. IEEE Transactions on Knowledge and Data Engineering, 20(2):189–201, 2008. [16] P. Heymann, D. Ramage, and H. Garcia-Molina. Social tag prediction. In Proceedings of the 31st annual international ACM SIGIR conference, 2008. [17] G. Karypis. Evaluation of item-based top-n recommendation algorithms. In Proc. 10th international conference on Information and knowledge management, pages 247–254, 2001. [18] X. Li, L. Guo, and Y. E. Zhao. Tag-based social interest discovery. In Proceedings of the 17th international conference on World Wide Web, 2008. [19] X. Li, S. Lin, S. Yan, and D. Xu. Discriminant locally linear embedding with high-order tensor data. IEEE Transactions on Systems, Man, and Cybernetics, Part B, 38(2):342–352, 2008. [20] H. L¨ utkepohl. Handbook of matrices. Wiley, 1996. [21] B. Markines, C. Cattuto, F. Menczer, D. Benz, A. Hotho, and G. Stumme. Evaluating similarity measures for emergent semantics of social tagging. In Proceedings of the 18th international conference on World wide web, 2009. [22] W. Min, K. Lu, and X. He. Locality pursuit embedding. Pattern Recognition, 37(4):781–788, 2004. [23] R. Nakamoto, S. Nakajima, J. Miyazaki, S. Uemura, H. Kato, and Y. Inagaki. Reasonable tag-based collaborative filtering for social tagging systems. In Proceeding of the 2nd ACM workshop on Information credibility on the web, 2008. [24] Netflix. http://www.netflixprize.com. [25] R. K. Pon, A. F. Cardenas, D. Buttler, and T. Critchlow. Tracking multiple topics for finding interesting articles. In Proc. 13th ACM SIGKDD international conference on Knowledge discovery and data mining, pages 560–569, 2007. [26] P. Resnick, N. Iacovou, M. Suchak, P. Bergstrom, and J. Riedl. Grouplens: an open architecture for collaborative filtering of netnews. In Proc. ACM conference on Computer supported cooperative work, 1994. [27] J. J. Rocchio. Relevance feedback in information retrieval. In The SMART retrieval system: experiments in automatic document processing. Prentice Hall, 1971. [28] S. Roweis and L. Saul. Nonlinear dimensionality reduction by locally linear embedding. Science, 290(5500):2323–2326, 2000. [29] S. Sen, J. Vig, and J. Riedl. Tagommenders: connecting users to items through tags. In Proceedings of the 18th international conference on World wide web, pages 671–680, 2009. [30] U. Shardanand and P. Maes. Social information filtering: algorithms for automating ’word of mouth’. In Proceedings of the SIGCHI conference on Human factors in computing systems, pages 210–217, 1995. [31] A. Shepitsen, J. Gemmell, B. Mobasher, and R. Burke. Personalized recommendation in social tagging systems using hierarchical clustering. In Proceedings of the 2008 ACM conference on Recommender systems, pages 259–266, 2008. [32] B. Sigurbj¨ ornsson and R. van Zwol. Flickr tag recommendation based on collective knowledge. In Proceedings of the 17th international conference on World Wide Web, 2008. [33] K. Tso-Sutter, L. Marinho, and L. Schmidt-Thieme. Tag-aware recommender systems by fusion of collaborative filtering algorithms. In Proceedings of the 2008 ACM symposium on Applied computing, 2008. [34] R. Wetzker, W. Umbrath, and A. Said. A hybrid approach to item recommendation in folksonomies. In Proceedings of the WSDM’09 Workshop on Exploiting Semantic Annotations in Information Retrieval, 2009.
We focus on the problem of document recommendation in social tagging services. We model it as a representation learning problem and propose a novel semantic space learning algorithm called Multi-type Interrelated Objects Embedding (MIOE). MIOE finds an optimal semantic space for users, tags and documents by keeping related objects close in the target space. Once this semantic space is learned, the closest documents which have not been bookmarked by the user are recommended to him/her. Although we consider text data in this paper, our algorithm is general and can be applied to any social tagging systems as long as a notion of similarity between resources is defined. We compare MIOE with four previous recommender algorithms on two data sets. Experimental results show that MIOE can generate promising recommendations and outperforms traditional recommender algorithms. For future work, we would like to examine the tag ambiguity issue which is harmful to our algorithm. It is also important to improve MIOE’s scalability, allowing it to be applied to very large datasets.
6.
REFERENCES
[1] G. Adomavicius and A. Tuzhilin. Toward the next generation of recommender systems: A survey of the state-of-the-art and possible extensions. IEEE Transactions on Knowledge and Data Engineering, 17(6):734–749, 2005. [2] R. Baeza-Yates and B. Ribeiro-Neto. Modern information retrieval. 1999. [3] M. Belkin and P. Niyogi. Laplacian eigenmaps and spectral techniques for embedding and clustering. In Advances in Neural Information Processing Systems 14, 2001. [4] Y. Bengio, J. F. Paiement, P. Vincent, O. Delalleau, N. Le Roux, and M. Ouimet. Out-of-sample extensions for lle, isomap, mds, eigenmaps, and spectral clustering. In Advances in Neural Information Processing Systems 16, 2003. [5] T. Bogers and A. van den Bosch. Recommending scientific articles using citeulike. In Proceedings of the 2008 ACM conference on Recommender systems, pages 287–290, 2008. [6] F. R. K. Chung. Spectral graph theory. American Mathematical Society, 1997. [7] CiteULike. http://www.citeulike.org. [8] M. de Gemmis, P. Lops, G. Semeraro, and P. Basile. Integrating tags in a semantic content-based recommender. In Proceedings of the 2008 ACM conference on Recommender systems, 2008. [9] Del.icio.us. http://delicious.com. [10] J. Diederich and T. Iofciu. Finding communities of practice from user profiles based on folksonomies. In Proceedings of the 1st International Workshop on Building Technology Enhanced Learning solutions for Communities of Practice, 2006. [11] Flickr. http://www.flickr.com. [12] S. Funk. Try this at home. http://sifter.org/ simon/journal/20061211.html, 2006. [13] Z. Guan, J. Bu, Q. Mei, C. Chen, and C. Wang. Personalized tag recommendation using graph-based ranking on multi-type interrelated objects. In Proceedings of the 32nd international ACM SIGIR conference, pages 540–547, 2009. [14] J. Ham, D. Lee, and L. Saul. Semisupervised alignment of manifolds. In Proceedings of the Annual Conference on
400