Jun 1, 2015 - (Note: % of shares held by each owner identity type is equal to total shares held .... with totals assets greater than equal to $1billion; MEDIUM1 ...
Asian Journal of Finance & Accounting ISSN 1946-052X 2015, Vol. 7, No. 1
Does Ownership Identity of Blockholders Matter: An Empirical Analysis of Publicly Listed Companies in New Zealand Krishna Reddy, Sazali Abidin, Wei He & Paresha Sinha Department of Finance Waikato Management School, University of Waikato
Received: July23, 2014 doi:10.5296/ajfa.v7i1.6489
Accepted: Nov.11, 2014
Published: June 1, 2015
URL: http://dx.doi.org/10.5296/ajfa.v7i1.6489
Abstract Purpose – This study explores the nature of the relationships between ownership concentration, ownership identity, and financial performance in publicly listed companies in New Zealand. This study also investigates whether the ownership-performance nexus changes during the financial crisis period. Design/method/approach –panel data for the publicly listed companies for the period 2003 to 2009 obtained from NZX Deep Archive and the dynamic panel generalized method of moments (GMM) regression analysis was used to test the influence of ownership concentration, ownership identity on financial performance measured by Tobin’s Qandreturn on assets (ROA). Findings –Our findings support the view that ownership concentration affects financial performance. Results show that a higher ownership concentration leads to a lower market-based performance (measured by Tobin’s Q) and higher accounting-based performance (measured by ROA). We also found evidence of owner identity having an impact on financial performance of the publicly listed companies in New Zealand. More “detached” level owners (institutional investors) have positive effect on market-based performance but negative effect on accounting-based performance. Whereas, more “involved” level owners (corporate investors) have negative effect on market-based performance. Our evidence shows that the effect ownership identity have had on the financial performance declined during the financial crisis period due to the fact that different types of owners reduced their ownership concentration levels, thus resulting in a reduction in their social influence and expertise powers. Originality/value –Our findings contribute to our understanding regarding the nature of the 13
www.macrothink.org/ajfa
Asian Journal of Finance & Accounting ISSN 1946-052X 2015, Vol. 7, No. 1
relationships between ownership concentration, ownership identity, and financial performance. Our findings support the view that the identity of the shareholder(s) do matter in terms of company financial performance. We also report that corporate holdings are the most common type of investor holding in the New Zealand context. Keywords: Ownership concentration, Ownership identity, Financial performance, Herfindahl index, Involvement, Detached GEL Classification: G01, G32
14
www.macrothink.org/ajfa
Asian Journal of Finance & Accounting ISSN 1946-052X 2015, Vol. 7, No. 1
Introduction The relationships between ownership concentration, ownership identity, and financial performance in publicly listed companies are important concerns for decision makers who are aiming to maximize firm performance. In particular as argued by Jensen and Meckling (1976), Ross (1973) and Eisenhardt (1989) the existence of information asymmetry and the divergence of interest between owners (principals) and managers (agents) is known to result in problems that adversely impacts performance and it has been suggested that the main reasons for agency problems are the different ownership structure and different roles people have in organisations. In this regard, prior researchers have investigated: (i) the nature of agency problem existing between the principal and the agent; and (ii) whether such problems can be mitigated by giving agents some proportion of ownership in the organisation they manage. Two different theoretical positions have been proposed namely the convergence-of-interest hypothesis and the entrenchment hypothesis. Arguably, the research findings remain inconclusive regarding the level of ownership that principals should relinquish to the agents in order to motivate them to act on their behalf. . One group of researchers reported a positive linear relationship between some low levels of insider ownership and financial performance (Elayan et al., 2003; Mehran, 1995; Welch, 2003; Kim et al., 1988; Oswald and Jahera Jr., 1991; Hossain et al., 2001), thus providing support to the convergence-of-interest hypothesis. Another group of researchers have reported the relationship between insider ownership and company financial performance is non-monotonic (Chen et al., , 1993; Griffith, 1999; McConnell and Servaes, 1990; Morck et al., 1988; Short and Keasey, 1999), thus, supporting convergence-of-interest hypothesis at some low levels of insider ownership and an entrenchment hypothesis at higher levels. These findings provide support to the view that the relationship between insider ownership and financial performance is non-linear. However, a third group of researchers (Demsetz, 1983; Demsetz and Lehn, 1985; Demsetz and Villalonga, 2001)claim that insider ownership is endogenously determined and therefore, cannot be a determinant of company financial performance. For this reason, any observed correlation of ownership and financial performance is likely to be spurious. In fact, the relationship between insider ownership and financial performance might arise due to some company characteristics that are unobservable to the econometrician. The conflicting findings reported regarding the insider ownership-financial performance nexus suggest that the debate relating to the precise functional form of the insider ownership is far from over. It also suggests that nature of the ownership structure may be country specific and therefore, findings may vary depending on the country’s institutional and regulatory structures. For example, Demetz and Lehn (1985) propose that greater the instability of a firm’s environment the more difficult it is for outsiders to monitor managers, and the greater are the benefits of inside ownership. In addition, researchers have reported conflicting findings regarding the role of blockholders in mitigating agency problems. Some researchers have reported that blockholders have potential to influence monitoring mechanisms (Dodd and Warner, 1983) while others 15
www.macrothink.org/ajfa
Asian Journal of Finance & Accounting ISSN 1946-052X 2015, Vol. 7, No. 1
(Claessens et al., 2000; Faccio and Lang, 2002; Dyck and Zingales, 2004) argue that principal-principal agency problem exists between the block shareholders and the minority shareholders as well. Shleifer and Vishny (1997)and Gugler (1999)have reported evidence of blockholders receiving private benefits at an expense of the minority shareholders. According to Claessens et al. (2000), blockholders receive private benefits through pyramidal business structures and cross-holdings across different companies. Research findings reported for the insider and block ownership suggest that the degree of control (the per cent of shares held by an investor) is an important determinant of the ownership-performance relationship(Cubbin and Leech, 1983). Arguably, researchers investigating ownership-performance relationship have assumed that shareholders’ are homogenous. This assumption has been challenged by many, including Kang and Sorensen (1999), who argue that shareholders are not always homogenous when they have different identities. In fact, some shareholders through their identity obtain powers that enable them to control companies in a manner that lead to extracting private benefits. The level of ownership and shareholder identity give shareholder’s three bases for shareholder power, that is: formal authority, social influence, and expertise(Kang and Sorensen, 1999). Shareholders’ obtain formal authority by being a shareowner. However, shareholders’ through their identity can also influence decision making processes by engaging in social activities (social influence) or having expertise knowledge (expertise). This indicate that the ownership-performance relationship may be different when shareholders have different identities, hold different proportion of shares in companies, and have expertise that company needs(Short, 1994). For example, Boone, Colombage and Gunasekarage (2011) reported that companies that have blockholders that are financial institutions have performed better compared to their peers. This finding suggests that besides degree of control (ownership concentration), location of control (identity of the shareholder) is also an important determinant of the ownership-performance nexus. Since prior research focused mainly on the ownership-performance relationship, the role shareholder identity (type of shareholder) play is less understood. This research is an attempt to fill the gap in the literature. Therefore, this research investigates the nature of the relationship between the proportion of ownership, shareholder identity, and financial performance of publicly listed companies in New Zealand and whether the ownership-performance relationship changes during the financial crisis period. We address three noble questions in our study: (i) do the proportion of shares held by the shareholders’ matter in terms of the financial performance of publicly listed companies? (ii) Does the identity of the shareholder matter in terms of financial performance? (iii) Does the relationship between ownership-performance changes during the financial crisis period? 2. Literature review 2.1 Insider and outsider shareholders equity and influence on company performance Agency-theoretic literature assumes that shareholders are homogenous and their influence on company financial performance is directly proportional to the percentage of equity they hold 16
www.macrothink.org/ajfa
Asian Journal of Finance & Accounting ISSN 1946-052X 2015, Vol. 7, No. 1
(Shleifer and Vishny, 1986).For example, by virtue of being a shareowner, all shareholders have some formal authority or legal right (Weber, 2008) such as the power to vote on ratification regarding appointment of the board of directors and the right to approve major business decisions (Clark, 1986). If the proportion of shares held by a shareholder is large, the shareholder can obtain some active role in the company as well which helps in monitoring the agent who possesses information advantage over the principal because he or she is more directly involved in the day to day running of the business (Subramaniam, 2006). In this regard, a number of researchers (Herman, 1981; Larner, 1971; Sorensen, 1996; McEachern, 1975) have compared the performance of the owner-controlled companies and manager-controlled companies and reported that owner-controlled companies perform better. According to Jensen and Meckling(1976), manager-controlled companies have agency problems which can be mitigated by giving agents shares in the company. Study undertaken by Morck, Shleifer and Vishny(1988) show that the insider holdings between 0 and 5 percent increases performance (interest-alignment hypothesis), between 5 and 24 percent decreases performance (entrenchment hypothesis), and insider ownership above 25 percent increases performance (interest-alignment hypothesis). A study undertaken in the US by Gugler, Mueller and Yurtoglu (2010) show that companies’ Tobin’s Q initially rose with an increase in the insider ownership but fell when the insider ownership exceeded 60 percent. However, Ben-Amar and Andre (2006) argue that mitigation of agency costs by giving insiders’ shares is possible only in countries where ownership dispersion exists. In countries where blockholding is a norm, studies show that principal-principal agency problems exist in addition to the principal-agent agency problem (Rydqvist, 1987; Levy, 1982; Horner, 1988; Zingales, 1994). 2.2 Shareholder ownership dimensions and its influence on company performance The nature of influence shareholders can have in companies also depends on their ownership dimension. In this regard, Mintzberg (1983) provides two dimensions of ownership, that is, concentration and involvement. Concentration refers to whether the company is closely-held or wildly-held and involvement measures whether the type of ownership has the ability to influence the decision-making power of the company. Mintzberg (1983) categorises corporate ownership into four different types: (i) dispersed-detached; (ii) dispersed-involved; (iii) concentrated-detached; and (iv) concentrated-involved. According to Mintzberg (1983), the more involved and more concentrated owners will have greater influence on decision-making processes. For example, large blockholders and institutional investors can appoint a representative (nominee) on the board (greater influence) and/or have a regular meeting with the board and the CEO (become involved), which provides opportunity to monitor managerial decisions. Different ownership concentration gives different levels of power, that is: formal authority, social influence, and expertise. Arguably, the level of power that shareholders have in companies determines their nature of involvement. Therefore, it is argued that monitoring by different types of shareholders would lead to different outcomes. For example, Nickel, Nicolitsas and Dryden (1997) investigated the relationship between different types of outside 17
www.macrothink.org/ajfa
Asian Journal of Finance & Accounting ISSN 1946-052X 2015, Vol. 7, No. 1
ownership and company productivity after controlling for the product market competition, financial market pressure, and shareholder control. They report that the dominant external shareholders have no effect on company performance, except when the dominant external shareholder is a financial institution. Chaganti and Damanpour (1991) investigated the effect of institutional investors on 40 pairs of manufacturing companies in 40 industries and reported that presence of higher proportion of institutional investor leads to relatively higher ROEs. Harris and Robinson (2003), report that presence of foreign owners in companies in the UK manufacturing industry leads to an improvement in the productivity. Gursoy and Aydogan (2002), reported that compared to family-owned companies, government-owned companies have lower accounting-based returns but higher market-based returns in Turkish listed companies. Sun, Tong and Tong (2002), report that the relationship between government ownership and companies’ financial performance follow an inverted U-shape pattern in China. Rosen and Quarrey (1987), studied employee participation in decision-making processes when employees have ownerships in companies and report that it enhances company performance. The findings reported above provide support to the view that ownership concentration level play an important role in regard to how companies perform, managed and controlled. However, it is not clear whether shareholders will behave in a similar way during the financial crisis period. 2.3Shareholder Identity and influence on company performance Prior studies investigating ownership-performance relationship have mainly focused on the conventional separation of ownership and control concept, that is, whether insider ownership and/or blockholding lead to better financial performance. They have assumed that all shareholders’ have homogeneous goal. This assumption has been challenged by Kang and Sorensen (1999)who argue that shareholders are not always homogenous as they have not only different ownership concentrations but also identities. For example, inside owners and block owners can be either institutional investors, corporate investors, government investors, individual investors, and employee stock ownership plans (Boone et al., 2011). Identities of block owners such as family, government or corporate may have objectives that differ substantially from shareholder maximization (Thomsen & Pedersen, 2003). Similarly, corporate shareholders focus on both the short-term and long-term performance and therefore, play an active role at the strategic and operational level decisions of the company. On the other hand, institutional investors seek long-term returns and do not pay much attention to companies’ short-term decision making processes. Therefore, corporate shareholders have higher involvement compared to the institutional shareholders. Different types of shareholders also have different behavioral characteristics which allow them to have different level of involvement and therefore, have different level of influence on companies. Through their involvement and influence, different shareholders achieve different outcomes from companies in which they invest. According to Kang and Sorensen (1999), the nature of social interactions between shareholders and management is an important way shareholders’ influence the decision making processes. In particular, the identity of shareholder has potential to influence decision making processes in companies. From the corporate governance point of view, the type of 18
www.macrothink.org/ajfa
Asian Journal of Finance & Accounting ISSN 1946-052X 2015, Vol. 7, No. 1
interpersonal relationships can significantly affect the resource allocation decisions in firms (Pfeffer, 1992). For example, the employee shareholders are able to influence decision-making processes through social interactions and their long-term relationship creates powerful reputational effect (Anderson and Reeb, 2004) which allow them to form a closer bond between the management and the board. It is argued that a higher level of involvement by employees have potential to reduce agency costs (Jensen and Meckling, 1976) on one hand, but on the other, closer relationship between employees allows managers with opportunities to extract private benefits of control (Fama and Jensen, 1983a). In addition, a closer relationship with the board/management provides some employees with opportunities to extract private benefit, such as obtaining appointment at management positions and/or other perquisites as well. On the other hand, foreign shareholders are geographically located outside the country, which make it difficult for them to get closer to the directors and influence decision making processes, thus giving rise to higher monitoring costs. Although this is a detached ownership structure, their experience and expertise are highly regarded and they have a tendency to influence decision making by providing their expertise. On the other hand, block holders and institutional investors through social interactions with CEOs are able to appoint more outside directors or independent directors on the board, and CEOs which as a result, are more likely to negotiate golden parachute deals into their contracts(Wade et al., 1990). Zajac and Westphal (1995; 1996)argue that the demographic background of the directors may also provide a source of political power which shareholders can exploit by building relationships which in turn allows them to influence the decision making processes. Similarly, large shareholders’ who have superior knowledge about the industry in which the company belongs to, which allows them to provide expertise to the management regarding critical environmental forces facing the company, have different influence on decision -making. This power is specific to the shareholder(s) and knowledgeable shareholders are the intangible assets of the companies. Since all these types of shareholders want to maximise company value, shareholder expertise contributes positively towards this goal(Kang and Sorensen, 1999). However, the Government/State ownership is an involvement ownership type that has a different influence on decision making because governments have power not only from the corporate law and property rights point of view, but from state policy setting, implementation and reputation point of view as well. The conflict of interest between the government and other shareholders often arises because the State is more interested in political/social outcomes compared to the goals of the other shareholders - who are more interested in the financial returns. Indeed, according to Boycko, Shleifer and Vishny (1996), the agency problem in government-owned companies arises from political issues rather than managerial issues. Based on the above viewpoint, weargue that both ownership concentration and identity provides different levels of formal authority, social influence and expertise power. Thus different shareholders have varying opportunity to motivate and monitor managerial behavior and influence decision making processes will do so based on their goals.
19
www.macrothink.org/ajfa
Asian Journal of Finance & Accounting ISSN 1946-052X 2015, Vol. 7, No. 1
3. New Zealand Environment Identity of the owner (i.e. employee, corporate) and the ownership structure (block holding) of the publicly listed companies in New Zealand make this investigation interesting. New Zealand has a small and open economy, a mature capital market and small number of companies listed compared to the larger economies of Australia, the USA and the UK. The size of the companies in New Zealand is much smaller which provides an environment which is significantly different from the larger economies where most of the prior studies have been undertaken. The existence of a small capital market makes market for corporate control irrelevant and therefore, investors rely on alternative governance mechanisms such as blockholding to mitigate agency costs(Boone et al., 2011). For this reason, blockholding has remained an important feature of New Zealand listed companies ownership structure. The evidence shows that blockholding in New Zealand has relatively remained unchanged overtime. For example, Hossain, Provost and Rao (2001) reported blockholding of 76 per cent (20 largest shareholders) for the period 1991/97 and Reddy, Locke and Scrimgeour (2010) reported blockholding of 65 per cent for the large companies in 1999/2007. Table 1reports the ownership concentration of the publicly listed companies in New Zealand. Between 2003 and 2009, the largest shareholder held on an average 34.49% of the shares. The highest proportion of shares held by the largest shareholder was 35.31% in 2005. The second largest shareholder held on an average10% of the shares and the highest proportion held by second largest shareholder was 10.83% in 2008. The average percentage of the shareholding held by the third and fourth largest shareholder is 5.47% and 3.5%, respectively. The fifth largest shareholder controlled on an average 2.57% of the shares. The sum of the average top five shareholding (column 7, Table 1) are higher than 50% in all the years between 2003 and 2009, thus suggesting that five largest shareholders have the majority control of the companies. In New Zealand, shareholding greater than 5% is constituted to be blockholding (New Zealand Securities Commission, 2006) and it is interesting to note that the top five shareholders in New Zealand are mostly blockholders.
20
www.macrothink.org/ajfa
Asian Journal of Finance & Accounting ISSN 1946-052X 2015, Vol. 7, No. 1
Table 1. % of shares controlled by the top 5 shareholders Year 2003 2004 2005 2006 2007 2008 2009 Average
TOP1
TOP2
TOP3
TOP4
TOP5
34.32%
9.97%
6.47%
4.85%
3.01%
(0.229)
(0.068)
(0.061)
(0.067)
(0.062)
34.90%
9.52%
5.25%
3.01%
2.32%
(0.228)
(0.067)
(0.045)
(0.022)
(0.019)
35.31%
9.41%
5.38%
3.17%
2.30%
(0.244)
(0.072)
(0.048)
(0.022)
(0.018)
35.07%
10.21%
5.19%
3.32%
2.32%
(0.243)
(0.074)
(0.046)
(0.023)
(0.017)
34.86%
10.33%
5.05%
3.21%
2.48%
(0.241)
(0.071)
(0.031)
(0.0210
(0.018)
32.95%
10.83%
5.17%
3.30%
2.67%
(0.247)
(0.072)
(0.032)
(0.020)
(0.019)
34.02%
10.23%
5.79%
3.63%
2.91%
(0.246)
(0.070)
(0.038)
(0.023)
(0.022)
34.49%
10.07%
5.47%
3.50%
2.57%
Total 58.62% 54.99% 55.56% 56.10% 55.93% 54.91% 56.58% 56.10%
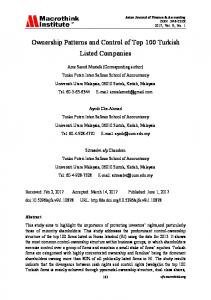
(Note: % of shares held by each owner identity type is equal to total shares held by each owner identity type divided by total shares outstanding. Standard deviations is reported in brackets) Table 2and Chart 1 provide an international comparison of different shareholdings and ownership identities in Australia, New Zealand, the UK, and the US. Data for Australia, the UK and the US was obtained from ASX200, FTSE100 and S&P500, respectively. New Zealand data includes 80 companies listed in NZX in 2010. The mean proportion of corporate holding in New Zealand is 16.38%, and the average employee holding is 18.44%. The proportion of shares held by both corporate and employees are much higher in New Zealand compared to Australia, the UK and the US. The second highest corporate holding is in Australia (9.42%) and the second highest employee holding is in the UK (3.82%). The mean proportion of foreign holding in New Zealand is 6.67%, which is similar to Australia of 6.76% but lower than the UK (11.97%) but much higher than the US (0.83%). Government holding in these four countries is very low. In New Zealand, government holding is the highest at 2.46%, and in the US is the lowest at 0.1%. However, New Zealand and the UK have the lowest proportion of institutional holding which is 4.06% and 3.53%, respectively. Institutional holding in New Zealand and the UK are less than half of that in Australia (8.41%) and the US (9.04%). Data for the pension fund holding in New Zealand was not available; however, in other three countries it is very low. Results reported in Table 2 indicate that the “involvement” ownership type (corporate and employee) is much more popular in New Zealand than in the other three countries.
21
www.macrothink.org/ajfa
Asian Journal of Finance & Accounting ISSN 1946-052X 2015, Vol. 7, No. 1
Table 2. A comparison of ownership of common stock
CH EH FH GH IH Pension fund Total strategic held No of Companies
AU
UK
US
NZ
9.46%
5.09%
0.86%
16.38%
(15.35)
(14.68)
(5.66)
(23.72)
3.67%
3.82%
1.37%
18.44%
(10.83)
(12.490
(4.97)
(24.86)
6.76%
11.97%
0.83%
6.67%
(12.78)
(17.52)
(4.38)
(16.70)
0.42%
1.55%
0.10%
2.46%
(3.67)
(8.26)
(1.15)
(12.76)
8.41%
3.53%
9.08%
4.06%
(10.83)
(5.34)
(8.22)
(7.05)
0.07%
0.24%
0.13%
0.00%
(0.92)
(1.94)
(2.28)
(0.00)
22.24%
15.02%
11.73%
41.43%
(19.15)
19.85)
(10.81)
(26.62)
199
102
500
81
(Note: Ownership variables in Table 2 are : CH-percentage by corporate holding; EH-percentage by employee holding; FH-percentage by foreign holding; GH-percentage by government holding; IH-percentage by investment company holding; pension fund-percentage by pension fund holding; total strategic held = total percentage of all these identified owners. Standard deviations is reported in brackets)
22
www.macrothink.org/ajfa
Asian Journal of Finance & Accounting ISSN 1946-052X 2015, Vol. 7, No. 1 AU
UK
US
NZ
18.44 16.38
11.97
9.46
9.08 8.41 6.76
5.09
6.67
3.82 3.67
3.53 1.37
0.86
CH
1.55 0.83
EH
0.42
FH
2.46
0.24 0.13 0.07 0.00
0.10 GH
4.06
IH
Pension fund
Chart 1. A comparison of ownership of common stock % in 2010 Table 3reports the percent of shares held by each ownership type in different sectors in NZX in 2010. The institutional investors have the most balanced portfolio as they have invested in all six sectors1. The highest holding is in the energy sector (6.75%) and the lowest is in the investment companies (2.18%). However, government hold shares only in the services sector in New Zealand(5.85%). Foreign investors tends to invest more in the investment sector (17.73%) and least in the property sector (2.25%), which is not surprising as the information pertaining to the economy and investment sector are more readily available compared to the others sectors. Employees own largest proportion of shares in the services sector (24.53%), followed by goods sector (22.47%), and investment sector (19.45%). A plausible reason for employees investing highly in these three sectors is that the motivation is highly connected to the companies’ profits. Corporate holding is highest in the energy sector (43%). Moreover, corporate holding is higher than 10% in all six sectors which indicate that corporate ownership type is the most popular and important type of ownership in New Zealand.
1
The six sectors are energy, goods, investment, primary, property and services.
23
www.macrothink.org/ajfa
Asian Journal of Finance & Accounting ISSN 1946-052X 2015, Vol. 7, No. 1
Table 3. Ownership structure by sector in 2010
Energy Goods Investment Primary Property Services
IH
GH
FH
EH
CH
NO.
6.75%
0.00%
6.75%
5.00%
43.00%
(0.135)
(0.000)
(0.135)
(0.063)
(0.390)
4.33%
0.00%
3.93%
22.47%
13.00%
(0.063)
(0.000)
(0.085)
(0.282)
(0.153)
2.18%
0.00%
17.73%
19.45%
14.09%
(0.072)
(0.000)
(0.346)
(0.277)
(0.298)
3.33%
0.00%
4.17%
0.50%
18.08%
(0.060)
(0.000)
(0.063)
(0.017)
(0.2210
6.50%
0.00%
2.25%
0.00%
12.50%
(0.0820
(0.000)
(0.0450
(0.000)
(0.084)
4.32%
5.85%
5.88%
24.53%
15.82%
(0.070)
(0.193)
(0.142)
(0.239)
(0.242)
4 15 11 12 4 34
(Note: Ownership information was obtained from the NZX Deep Archive for the year 2010. Numbers of companies included in the sample are given in column 7. Standard deviations is reported in brackets) Table 4reports the ownership percent by owner identity and size of companies based on companies total assets. Total assets of the companies are divided in four segments: LARGE, MEDIUM1, MEDIUM2, and SMALL. LARGE refers to companies that have total assets greater than and equal to $1 billion; MEDIUM1 refers to companies that have total assets greater than equal to $200 million and less than $1billion, MEDIUM2 refers to companies that have total assets greater than equal to $50million and less than $200million; and SMALL refers to companies that have total assets less than $50 million. Results reported in Table 4 show that different owner types have different interests in different size companies. The basic consensus is that smaller size companies have greater risks and ownership patterns of institutional investors show that their investment declines as the company size gets smaller. Institutional investors hold 9.64% shares in large companies, but it dramatically declines to mere 1.21% in small size companies. This is not surprising as institutional investors are known for seeking long-term returns and have low risk-bearing capability. The most striking result is that government holding in large companies in New Zealand is nil compared to other countries. This is mainly because government-owned companies are not publicly listed in New Zealand. Another plausible reason is that New Zealand government invests only in the services sector (ports) in New Zealand which is only medium sized. Foreign holdings are highly concentrated both in large companies (10.09%) and small size companies (10.86%). It is interesting to note that there are two distinctly different types of foreign investors existing in New Zealand, that is, one seeking long-run returns and low risk, and other seeking risky investments. It is interesting to note that employee holding declines as the company size gets larger, which ranges from 30.59% in small companies to 0.64% in large companies. This is not surprising as investors need a lot more funds to hold block shares in larger companies. 24
www.macrothink.org/ajfa
Asian Journal of Finance & Accounting ISSN 1946-052X 2015, Vol. 7, No. 1
Table 4. Ownership structure by firm size in 2010
LARGE MEDIUM1 MEDIUM 2 SMALL
IH
GH
FH
EH
CH
NO.
9.64%
0.00%
10.09%
0.64%
22.91).3
(0.096)
(0.000)
(0.108)
(0.021)
01)
5.05%
2.57%
1.14%
10.86%
16.05%
(0.051)
(0.118)
(0.0360
(0.208)
(0.229)
4.32%
4.16%
4.74%
15.21%
13.32%
(0.043)
(0.1810
(0.082)
(0.252)
(0.190)
1.21%
2.28%
10.86%
30.59%
16.72%
(0.012)
(0.123)
(0.256)
(0.239)
(0.254)
11 21 19 29
Note: The data for the company’s total assets was obtained from the NZX Deep Achieve, for 2010. Companies total assets was divided into four segments, that is: LARGE- companies with totals assets greater than equal to $1billion; MEDIUM1 - companies having totals assets greater than equal to $200million and less than 1billion; MEDIUM2 - companies with total assets greater than equal to $50 million and less than $200 million; and SMALL companies with total assets less than $50 million . Standard deviations are reported in brackets. Chart2reports the time series comparison of ownership percent and identity of the 40 NZX listed companies for the period 2003 to 2009.According to Chart2, institutional holding, employee holding, and corporate holding declined between the period 2003 and 2004, but foreign holding increased a little during the same period following similar trend to that of the real GDP growth rate (RGDP) of New Zealand. After 2004, foreign holding, employee holding (small firms) and corporate holding followed similar trend to that of the RGDP, they all declined in 2005 and rebounded back a little in 2006. Per cent of shares held by all investors declined in 2007, even though the RGDP increased slightly. A plausible reason could be that investors expected the worst possible outcome from the financial crisis and therefore, maintained lower level of interest in controlling publicly listed companies in New Zealand. Even though New Zealand economy experienced major setback since 2008, the results reported in Chart2 show that investors did increase their level of investment simply to regain control which they had lost earlier. Above findings suggest that investors not only focused on the recent economic environment but their confidence level of future situation also played an important role in determining investment options. Furthermore, ownership by institutional investors (large firms) remained fairly constant over the period suggesting they were seeking long-run returns, and short-term effects have had less effect on their investment patterns in comparison to employee and corporate type investors.
25
www.macrothink.org/ajfa
Asian Journal of Finance & Accounting ISSN 1946-052X 2015, Vol. 7, No. 1 25.00%
0.05 0.04
20.00% 0.03 0.02
%Holding
15.00%
0.01 10.00%
0 -0.01
5.00% -0.02 -0.03
0.00% 2002
2003
2004
2005
2006
2007
2008
CH
RGDP
2009
2010
year IH
FH
EH
Chart2. Ownership structure in time series Note: RGDP is the GDP nature growth rate of New Zealand, which in the secondary Y-axis. Ownership data include 40 NZX listed companies Data and Method Data for this research was collated from DataStream and NZX Deep Archive. To maintain exactitude, a balanced panel data was developed to observe both the time and cross sectional effects. Unfortunately, the average life-cycle of the listed companies in New Zealand in the past 11 years (1999 to 2009) has been approximately five years, which means there are a number of companies with missing data. After removing companies that did not survive the sampling period, a balanced panel of 40 companies was obtained, thus containing 280 company-year observations. In addition, 80 company’s data for 2010 was also used to obtain descriptive statistics which provide most recent statistical information regarding ownership structures of publicly listed companies during the financial crisis period in New Zealand. 4.1 Dependent variables Similar to Gugler, Mueller and Yurtoglu (2008), Kang and Stulz (1996), Morck, et al.(1988), and Reddy et al.(2010), this study uses Tobin’s Q as a dependent variable. In addition, this 26
www.macrothink.org/ajfa
Asian Journal of Finance & Accounting ISSN 1946-052X 2015, Vol. 7, No. 1
study also uses return on assets (ROA) as a dependent variable similar to Demsetz and Villalonga (2001) and Finch and Shivadasani (2006). 4.2 Independent variables The independent and control variables used in this study is similar to that used by Demsetz and Lehn (1985) and Xu and Wang (1992).We use two variables as proxy for ownership concentration (CON), that is, TOP5 and H1. Our statistical analysis relies heavily on the cumulative percentage of shares held by the five largest shareholders (TOP5) and the approximation of the Herfindahl index (HI). TOP5 =
Numbler of shares held by ive largest shareholders ∗ 100% ℎ
HI = (% of shares held by largest shareholder) + (% of shares held by second largest shareholder) + ⋯ + (% of shares held by ifth largest shareholder)
Similar to Demsetz and Lehn (1985), we have taken a logistic transformation of TOP5 and H1 to convert an bounded variable into an unbounded one. Therefore, LT5 is determined as Ln(TOP5) and LH1 as Ln(H1) Prior researches have measured ownership levels either by aggregating the per cent of shares held by the largest shareholder or top-20 shareholders. No study to date (to our knowledge) has considered the per cent of shares held by the top-5 shareholders as well as the identity of the top-5 shareholders. Blockholders in publicly listed companies in New Zealand tends to be insiders and as they have different identities (such as, institutions, corporates, etc.), suggests that they may play an important role in New Zealand context. Therefore, we follow and also have extended the method used by Xu and Wang’s(1999). We use five variables as proxies for the ownership identity (OWN), that is: EH is the percent of shares held by the employees, FH is the per cent of shares held by foreign investors (who is not a New Zealand citizen and not a New Zealand resident), CH is the per cent of shares held by corporate investors (non-financial companies), and IH is the per cent of shares held by investment companies or institutional investors (institutions, banks or other financial companies). Government and pension funds were ignored either because their shareholding is minute or insufficient information was provided. The formula that determines proportion of each type of ownership is as follows: Total number of outstanding shares hold by each identity Total number of shares outstanding
To determine the effect of financial crisis on performance, two time dummy variables were created. BEFORE is equal to “1” if the year is before 2007, otherwise “0” and AFTER is equal to “1” if the year is after 2007, otherwise “0”. To control for the size effect we use the natural log of total assets (SIZE) as the proxy for size. Leverage (LEV) of the company is measured by the ratio of total liabilities to total assets, and the firm level risk (FMRISK) is measured as the standard deviation of the firm’s daily stock price. OPRISK is the standard 27
www.macrothink.org/ajfa
Asian Journal of Finance & Accounting ISSN 1946-052X 2015, Vol. 7, No. 1
deviation of past five years of the firm’s ROA and MSHARE is the proportion of the firm’s revenue to the total revenue of the sectors. A summary of dependent and control variables used in this study and their method of measurement is provided in Table 5. Table 5. A Summary of Dependent and Control variables used Dependent variables ((Stock price * No. of shares outstanding) + Long term debt + Short term
Tobin’s Q
debt)/Total Assets Net Income/ Total Assets
ROA Control variables
No. of shares held top five shareholders/Total shares outstanding
Ownership Concentration (CON): TOP5 Ownership
(% of shares held by largest shareholder)2 + (% of shares held by second
Concentration (CON):
largest shareholder)2 + … + (% of shares held by fifth largest
H1
shareholder)2
Ownership
Identity
(No. of shares held by Employees)/Total Shares Outstanding
Identity
(No. of shares held by Foreign Investors)/Total Shares Outstanding
Identity
(No. of shares held by Corporate Investors)/Total Shares Outstanding
Identity
(No. of shares held by Institutional Investors)/Total Shares Outstanding
(OWN): EH Ownership (OWN): FH Ownership (OWN): CH Ownership (OWN): IH AFTER
Dummy equal to “1” if year is after 2007, otherwise “0”
BEFORE
Dummy equal to “1” if year is before 2007, otherwise “0”
LEV
Long term liabilities/Total assets
SIZE
Natural log of Total assets
FMRISK
Standard deviation of the firm’s daily stock returns for the year
OPRISK
Standard deviation the firm’s past five year return on assets
MSHARE
Proportion of the total revenue of the firm to total revenue of the sector to which firm belongs to.
4.3 Model This study examines the nature of the relationship between firm performance (PER) and ownership variables and tests whether the relationship is significant. Two dependent variables (Q, ROA) and two main types of independent variables (CON, OWN) are used to estimate the model using ordinary least squares (OLS) regression. The regressions models used are as follows:
28
www.macrothink.org/ajfa
Asian Journal of Finance & Accounting ISSN 1946-052X 2015, Vol. 7, No. 1
PER it = α 1 + β 10 TIME it + β 11 LEV + β 12 SIZE it + β 13 FMRISK it + β 14 OPRISK it +β 15 MSHARE it + β 16 CON it + ε
................. 1
PER it = α 2 + β 20 TIME it + β 21LEV + β 22SIZEit + β 23 FMRISK it +β 24 OPRISK it +β 25 MSHAREit + β 26 OWN it + ε
................. 2
where PER either equals Tobin’s Q or ROA; CON equals TOP5 and H1; OWN equals EH, FH, CH, IH; i denote a cross-sectional observation; t denotetime and ε is theerror term. We use Tobin’s Q as the dependent variable, ownership identity as independent variable and two time period variables, that is, BEFORE and AFTER. The OLS regression model used is as follows: Q it = α 3 + β 31 LEVit + β 32 SIZE it + β 33 FMRISK it + β 34 OWN it + TIME + β 34 OPRISK it + β 35 MSHARE it + ε
................ 3
where
TIME either equals BEFORE or AFTER. 5. Empirical Result 5.1 Descriptive statistics Table 6 provides a summary of the descriptive statistics for the dependent and control variables used in this study. The average (median) Tobin’s Q is 2.06 (1.25) indicating companies did create values for the shareholders’ and the company has good expectations for future performance. The average (median) ROA is -0.02 (0.05) and the minimum is -4.32. The negative values for ROA indicate that companies have not utilized fixed assets of the companies in an efficient manner to generate enough revenue. Since median of ROA is lower (0.05%), it indicates that majority of the publicly listed companies have experienced a very low financial performance during the period of the global financial crisis. The mean (median)of HI is 0.2 (0.13) and the mean (median) proportion of shares held by five largest shareholders (TOP5) is 0.56 (0.56), which is considered to be very high indicting more than half of the shares are controlled by five largest shareholders. The maximumTOP5 is 98% and the minimum is 12%, indicating that companies in New Zealand are closely-held rather than widely-held. The mean of IH is 0.03, FH and CH both have mean of 0.06, whereas mean of EH is the highest at 0.09. These results indicate that employee investors hold the largest proportion of shares in New Zealand market, and the institutions hold the smallest. The mean of LEV is 0.44 which is not considered to be high, but the maximum is greater than 1 thus indicating total liabilities in the companies are greater than the total assets. The mean of SIZE is 5.31 with the median of 5.41. The mean of FMRISK is 0.33 with the median of 0.25.The mean of OPRISK is 0.31 with the median of 0.02, thus suggesting that market risk and operational risk of firms are not significantly different. The mean of MSHARE is 0.01, thus suggesting that firms share of the market is small.
29
www.macrothink.org/ajfa
Asian Journal of Finance & Accounting ISSN 1946-052X 2015, Vol. 7, No. 1
The results reported in Table 6 show that 17.5% of companies belong to primary industry, 37.5% services, 12.5% investment, 7.5% energy, 17.5% goods, 5% property, and 2.5% are companies which are also listed in overseas stock exchanges. Table 6. Descriptive Statistics Mean
Median
Kurtosis
Skewness
Range
Min
Max
No.
Q
2.06
1.25
18.02
3.64
21.76
-0.25
21.51
280
MB
2.52
1.78
26.10
4.36
27.62
-2.82
24.81
280
ROA
-0.02
0.05
75.12
-7.45
4.69
-4.32
0.37
280
ROE
0.01
0.09
52.62
-0.67
13.19
-6.44
6.75
280
HI
0.20
0.13
-0.18
1.00
0.68
0.00
0.68
280
TOP5
0.56
0.56
-1.09
-0.02
0.86
0.12
0.98
280
IH
0.03
0.00
16.82
3.74
0.55
0.00
0.55
280
FH
0.06
0.00
6.53
2.50
0.70
0.00
0.70
280
EH
0.09
0.00
5.02
2.40
0.80
0.00
0.80
280
CH
0.06
0.00
7.01
2.77
0.78
0.00
0.78
280
LEV
0.44
0.43
0.11
0.40
1.32
0.00
1.32
280
SIZE
5.31
5.41
-0.01
-0.62
4.25
2.66
6.92
280
FMRISK
0.33
0.25
47.96
5.10
4.33
0.01
4.33
280
OPRISK
0.13
0.02
16.34
3.37
1.99
-0.07
1.92
280
MSHARE
0.01
0.00
4.34
0.00
0.03
0.00
0.03
280
5.2 Correlation test Table 7 report the pairwise correlation matrix for the independent variables. The correlation between LT5 and LH1 is the highest at 0.86, which is not surprising as the top five shareholders also have most concentrated shareholding as well. Apart from this result, the rest of correlation coefficient ranges between 0.35 (between LEV and SIZE and between FH and IH) and 0.002 (LT5 and FMRISK). We also conducted the pairwise correlation between the dependent variables (Q and ROA) and blockholders identity variables (HI, EH, FH, CH) and found the correlations coefficient to be between 0.14 and 0.001. 2 These results re-confirm the view that there are no multicollinearity issues in the data.
2
Results are not reported but can be obtained from the authors if required.
30
www.macrothink.org/ajfa
Asian Journal of Finance & Accounting ISSN 1946-052X 2015, Vol. 7, No. 1
Table 7. Pairwise Correlation of the Independent Variables SIZE is the natural logarithm of the total assets. LEV is the ratio of long term debt to total assets. FMRISK is the standard deviation of the firm’s daily stock returns. OPRISK is the standard deviation of the firm’s past five year ROA. MSHARE is the proportion of the firm’s revenue to the total revenue of the firms’ in the sector. IH1 is the natural logarithm of the Herfindahl index. LT5 is the natural logarithm of the proportion of shares held by top5 five shareholders. IH is the proportion of shares held by institutional investors. FH is the proportion of shares held by foreign investors who are not institutions and/or corporates. EH is the proportion of shares held by employees and CH is the proportion of shares held by corporate investors. SIZE SIZE
LEV
FMRISK
OPRISK
MSHARE
LH1
LT5
IH
FH
EH
CH
LEV
FMRISK
OPRISK
MSHARE
LH1
LT5
IH
FH
EH
CH
0.347*** (0.000)
-
0.315***
0.093
(0.000)
(0.119)
-0.439***
-0.179**
-0.020***
(0.000)
(0.003)
(0.000)
0.328***
0.138†
0.313***
-0.110†
(0.000)
(0.021)
(0.000)
(0.067)
0.091
-0.262***
-0.058
-0.111†
-0.016
(0.127)
(0.000)
(0.337)
(0.065)
(0.796)
0.089
-0.257***
0.002
-0.077
-0.024
0.861***
(0.136)
(0.000)
(0.979)
(0.197)
(0.688)
(0.000)
0.226
0.128**
0.171**
0.034
0.314***
-0.160**
-0.128**
(0.000)
(0.032)
(0.004)
(0.566)
(0.000)
(0.007)
(0.033
-0.007
0.099†
-0.010
0.020
0.114†
0.056
0.038
0.351***
(0.912)
(0.099)
(0.871)
(0.734)
(0.056)
(0.351)
(0.530)
(0.000)
-0.143**
0.110†
-0.090
0.067
-0.033
-0.001
0.066
-0.103†
-0.105†
(0.016)
(0.067)
(0.134)
(0.262)
(0.585)
(0.989)
(0.269)
(0.086)
(0.079)
-0.048
-0.099
-0.018
0.072
-0.079
0.289***
0.247***
-0.109†
0.240***
-0.076
(0.422)
(0.134)
(0.758)
(0.231)
(0.190)
(0.000)
(0.000)
(0.069)
(0.000)
(0.205)
-
-
-
-
-
-
-
-
***
denote significance at 1% level, ** denote significance at 5% level, † denote significance at 10% level. Table 8 report the results of the Breusch-Pagan/Cook-Weisberg test for heteroskedasticity. These results confirm our findings reported above that there are no heteroskedasticity issues in the data.
31
www.macrothink.org/ajfa
-
Asian Journal of Finance & Accounting ISSN 1946-052X 2015, Vol. 7, No. 1
Table 8. Breusch-Pagan/Cook-Weisberg test for heteroskedasticity Ho: Constant variance Tobin’s Q
MB
ROA
ROE
Chi2
247.91
262.81
622.65
187.33
(P-Values)
(0.000)
(0.000)
(0.000)
(0.000)
5.3 OLS Regression of performance to ownership concentration (CON) Table 9reports the OLS and fixed-effects 3 regression results for Equation 1.Dependent variables are Tobin’s Q and ROA and the independent variables are listed in column 1 of Table 9with corresponding t-statistics reported in brackets. According to Wintoki, Linck and Netter (2012), unobservable heterogeneity is a source of endogeneity that affects both performance and explanatory variables. A potential solution is the fixed-effects or within estimation. Columns 2 to 5 provide the regression results when Tobin’s Qis used as the dependent variable and CON is determined by either LHI or TOP5, respectively. Both TIME and SIZE have a negative coefficient and is statistically significant at 1% level, indicating that the size of the publicly listed companies is not at an optimal level and also company performance is adversely affected by the financial crisis. The coefficient of FMRISK is positive and statistically significant at 1% level, thus indicate that listed companies that experienced high volatility in stock prices contributed positively towards performance measured by Tobin’s Q. Since the coefficient of LT5 is negative and statistically significant at 10% level, this indicates that the monitoring provided by top five shareholders to some extent sheltered the companies from adverse financial effects. Columns 6to 9 provide the regression results when ROA is used as the dependent variable and CON is determined by either LHI or TOP5, respectively. The coefficient of both CON variables is positive and is statistically significant at 5% and 10% levels, respectively. This suggests that a higher ownership concentration levels lead to a higher accounting-based performance measured by ROA. Since coefficient of SIZE is positive and statistically significant at 1% level, it indicates that the large companies in New Zealand have better accounting performance compared to small. In summary, results reported in Table 9show that companies that have a higher level of ownership concentration will tend to have lower Tobin’s Q and higher ROA but companies that are large will tend to have lower Tobin’s Q but higher accounting based performance. Higher concentrated owner (blockholders) has more formal authority and they tend to hold enough shares to obtain active roles in the companies. Based on the ownership concentration of the blockholders, their opinion tends to have a significant effect on the managers’ activities. With blockholders in such an influential space, it is likely that the rights of the minority shareholders could be comprised. 3
The Hausman test results (not reported) but shows that fixed effects results are more efficient.
32
www.macrothink.org/ajfa
Asian Journal of Finance & Accounting ISSN 1946-052X 2015, Vol. 7, No. 1
Table 9. Q is the proportion of ((stock price * No. of share outstanding) + L/T debt + S/T debt) to Total Assets. ROA is the proportion of Net Income to Total Assets. TIME ranges from 2003 to 2009. SIZE is the natural logarithm of the total assets. LEV is the ratio of long term debt to total assets. FMRISK is the standard deviation of the firm’s daily stock returns. OPRISK is the standard deviation of the firm’s past five year ROA.IH1 is the natural logarithm of the Herfindahl index. LT5 is the natural logarithm of the proportion of shares held by top5 five shareholders. MSHARE is the proportion of the firm’s revenue to the total revenue of the firms’ in the sector. Static model Q OLS
Constant TIME
Fixed Effects
OLS
ROA Fixed Effects
OLS
Fixed Effects
OLS
Fixed Effects
4.58***
6.46***
4.82***
6.48***
-0.68***
-1.06**
-0.77***
-1.06**
(4.99)
(9.40)
(5.72)
(9.40)
(-5.43)
(-1.98)
(-6.60)
(-2.00)
-0.97***
-0.95***
0.02
-0.03
(-3.27)
(-3.16)
(-0.59)
(-0.67)
0.04
0.51**
-0.15
0.51**
0.01
-0.09
0.01
-0.09
(0.051)
(2.74)
(-0.21)
(2.73)
(0.11)
(-0.64)
(0.030
(-0.60)
-0.53***
-1.08***
-0.50**
-1.07***
0.13**
0.23**
0.14***
0.23**
(-2.99)
(-8.06)
(-2.84)
(-8.06)
(5.62)
(2.24)
(5.62)
(2.19)
FM
1.34***
-0.04
1.35****
-0.04
0.09
0.02
0.09
0.02
RISK
(3.19)
(-0.47)
(3.23)
(-0.47)
(1.53)
(0.41)
(1.93)
(0.33)
-0.27**
-0.51**
-0.27**
-0.51**
-0.73***
-0.76***
-0.73***
-0.75***
(-2.12)
(-2.53)
(-2.12)
(-2.53)
(-10.79)
(-4.87)
(-10.89)
(-4.77)
11.17
12.79
11.17
12.79
-4.02
-19.85
-3.83
-15.89
(1.37)
(0.97)
(1.37)
(0.97)
(-0.93)
(-1.78)
(-0.88)
(-0.87)
-0.07
-0.03
0.35**
0.29**
(-1.16)
(-0.34)
(2.28)
(2.01)
LEV SIZE
OPRISK
MSHARE LH1
LT5 F stats
-0.14†
-0.16†
0.29†
0.25†
(-1.91)
(-1.94)
(1.94)
(1.88)
6.83***
11.07***
6.82***
11.08***
33.27***
7.17***
33.45***
7.38***
(0.000)
(0.000)
(0.000)
(0.000)
(0.000)
(0.000)
(0.000)
(0.000)
0.12
0.22
0.13
0.22
0.42
0.16
0.42
0.16
(Adj. R )
(0.10)
(0.05)
(0.11)
(0.05)
(0.41)
(0.37)
(0.41)
(0.37)
N
280
(P value)
R2 2
t statistics in parenthesis, † denote significance at the 10% level, **denote significance at 5% level, *** denote significance at 1% level 33
www.macrothink.org/ajfa
Asian Journal of Finance & Accounting ISSN 1946-052X 2015, Vol. 7, No. 1
5.4 OLS regression results for performance and ownership identity Table10 reports the OLS regression results for the performance and ownership identity for Equation 2. The dependent variables used are Tobin’s Q and ROA and the independent variables include four owner identity variables (OWN), that is, institutional holding (IH), foreign holding (FH), employee holding (EH), and corporate holding (CH). Table 10 columns2 to 3 report the results of Tobin’s Q as dependent as the dependent variable. The coefficient of IH is positive and statistically significant at 5% level, indicates that holding by institutional investors leads to an improved financial performance measured by Tobin’s Q. However, coefficients of EH and CH are negative, thus indicate that holding by employees and corporate investors leads to negative returns. Results for the SIZE, TIME and FMRISK are similar to that reported in Table 9. Table 10 columns 4 and 5 report the results of ROA as dependent variable. The coefficient of IH is negative and statistically significant at 5% level; indicate that institutional holding has a negative effect on ROA. The coefficient of CH is positive and statistically significant at 5% level; suggest that corporate investors have a positive effect on accounting-based performance. In summary, results show that higher institutional holding increases performance measured by Tobin’s Q and decreases accounting-based performance measured by ROA. The plausible reason could be that less “involvement” owners have less power and have less interest in controlling decision-making processes, therefore, pay less attention on day-to-day operations of the companies but focus more on the long-term growth. For example, institutional investors focus on the future returns or long run returns which is reflected by Tobin’s Q. On the other hand, corporate holding has a negative effect on Tobin’s Q but a positive effect on accounting-based measure, reflecting corporate investors’ short term focus. Table 10. Q is the proportion of ((stock price * No. of share outstanding) + L/T debt + S/T debt) to Total Assets. ROA is the proportion of Net Income to Total Assets. TIME ranges from 2003 to 2009. SIZE is the natural logarithm of the total assets. LEV is the ratio of long term debt to total assets. FMRISK is the standard deviation of the firm’s daily stock returns. OPRISK is the standard deviation of the firm’s past five year ROA. MSHARE is the proportion of the firm’s revenue to the total revenue of the firms’ in the sector. IH is the proportion of shares held by institutional investors, FH is the proportion of the shares held by foreign investors, EH is the proportion of the shares held by employees and CH is the proportion of the shares held by corporates. Static model Q OLS
ROA Fixed Effects
34
OLS
Fixed Effects
www.macrothink.org/ajfa
Asian Journal of Finance & Accounting ISSN 1946-052X 2015, Vol. 7, No. 1 2.00***
2.09***
-0.30**
-0.30**
(8.73)
(5.86)
(-2.34)
(-2.29)
0.24
0.44**
-0.08
-0.08
(1.64)
(2.68)
(-1.02)
(-0.99)
-0.21***
-0.24***
0.06**
0.06**
(-5.06)
(-3.54)
(2.64)
(2.57)
0.33***
0.04
0.08
0.07
(3.64)
(0.50)
(1.49)
(1.40)
-0.20
-0.05
-0.74***
-0.74***
(-1.60)
(-0.27)
(-10.49)
(-10.30)
7.56
9.11
-3.32
-3.62
(0.93)
(0.87)
(-0.740
(-0.77)
1.16**
0.71†
-0.59**
-0.16†
(2.27)
(1.85
(-1.98)
(-1.90)
0.01
0.12
0.09
0.11
(-0.03)
(0.38)
(0.55)
(0.63)
-0.40**
-0.14
0.03
0.04
(-2.29)
(-0.72)
(0.32)
(0.37)
-1.64†
-0.17
0.27**
0.26**
(-1.71)
(-0.86)
(2.29)
(2.20)
F Stats
5.01***
6.76***
14.03***
19.00
(P-Value)
(0.000)
(0.000)
(0.000)
(0.000)
R2
0.22
0.31
0.44
0.16
Adj. R2
(0.18)
(0.05)
(0.42)
(0.44)
N
280
Constant
LEV
SIZE
FMRISK
OPRISK
MSHARE
IH
FH
EH
CH
t statistics in parenthesis, † denote significance at the 10% level, **denote significance at 5% level, *** denote significance at 1% level
35
www.macrothink.org/ajfa
Asian Journal of Finance & Accounting ISSN 1946-052X 2015, Vol. 7, No. 1
5.5 OLS Regression Results for Performance and ownership identity during financial crisis Tables 11, columns 2 to 9report the OLS regression results for Equation 3 using Tobin’sQ as dependent variable and ownership identity (OWN) in different time period as the independent variable, that is, before or after financial crisis. In columns 2 to 5 in Table 11, coefficients of two ownership identity variables IH and FH are positive and statistically significant at 5% levels, respectively. This result indicates that in post financial crisis period both institutional and foreign holding resulted in positive performance. However, the coefficient of CH is negative and is statistically significant at 5% level indicate that corporate holding has a negative effect on the financial performance measured by Tobin’s Q. In columns 6 to 9 in Table 11, coefficient of IH is positive and statistically significant at a 5% level, indicate that institutional holders invested in larger companies that could sustain short-term shocks such as those arising from the global financial crisis. Results suggest that their less “involved” holdings had a positive performance measured by Tobin’s Q. On the other hand, the results suggest that more “involved” investors (employee corporate) who tend to pay much attention to short-term performance but did not due to the crisis and therefore, experienced more negative performance. The results reported in Table 11 show that during the financial crisis the effects of ownership identity on performance declined and all different types of shareholders reduced their shareholding proportion and therefore, lost some power of control.
36
www.macrothink.org/ajfa
Asian Journal of Finance & Accounting ISSN 1946-052X 2015, Vol. 7, No. 1
Table 11. Q is the proportion of ((stock price * No. of share outstanding) + L/T debt + S/T debt) to Total Assets. ROA is the proportion of Net Income to Total Assets. TIME ranges from 2003 to 2009. SIZE is the natural logarithm of the total assets. LEV is the ratio of long term debt to total assets. FMRISK is the standard deviation of the firm’s daily stock returns. OPRISK is the standard deviation of the firm’s past five year ROA. MHARE is the proportion of the firm’s revenue to the total revenue of the firms’ in the sector. IH is the proportion of shares held by institutional investors, FH is the proportion of the shares held by foreign investors, EH is the proportion of the shares held by employees and CH is the proportion of the shares held by corporates. 2003 - 2006 Constant
LEV
SIZE
FMRISK
OPRISK MSHARE
IH
2007 - 2009
Q
Q
Q
Q
Q
Q
Q
Q
4.14***
3.88***
4.08***
4.07***
5.21***
4.86***
5.10***
5.07***
(4.73)
(4.39)
(0.000)
(4.63)
(6.16)
(5.72)
(5.89)
(5.99)
0.18
0.20
0.38
0.16
0.18
0.20
0.38
0.16
(0.26
(0.29)
(0.54)
(0.23)
(0.26)
(0.29)
(0.54)
(0.23)
-0.62***
-0.56***
-0.59***
-0.56***
-0.63***
-0.56***
-0.59***
-0.56***
(-3.60)
(-3.22)
(-3.38)
(-3.28)
(-3.60)
(-3.22)
(-3.38)
(-3.28)
1.24**
1.36***
1.33***
1.35***
1.24**
1.36***
1.34***
1.36***
(2.97)
(3.26)
(3.20)
(3.26)
(2.97)
(3.26)
(3.20)
(3.26)
-0.23†
-0.19
-0.18
-0.18
-0.32
-0.14
-0.34
-0.15
(-1.87)
(-1.51)
(-1.45)
(-1.43)
(-1.64)
(-1.23)
(-1.56)
(-1.05)
4.34
5.20
2.49
1.55
3.23
4.34
3.23
3.34
(0.85)
(1.39)
(1.58)
(1.44)
(0.76)
(1.40)
(0.98)
(1.01)
5.17***
5.15***
(2.41)
(2.41)
FH
0.92**
0.68
(2.09)
(0.53)
EH
-0.81
-1.63
(-1.03)
(-1.61)
CH
-2.59**
0.20
(-1.76)
(1.06)
F stats
7.36***
6.14***
6.31***
6.72***
7.36***
6.14***
6.31***
6.72***
(P-Value)
(0.000)
(0.000)
(0.000)
(0.000)
(0.000)
(0.000)
(0.000)
(0.000)
0.12
0.10
0.10
0.11
0.12
0.12
0.11
0.11
(0.10)
(0.08)
(0.09)
(0.09)
(0.10)
(0.08)
(0.09)
(0.09)
R2 Adj. R2 N
121
159
37
www.macrothink.org/ajfa
Asian Journal of Finance & Accounting ISSN 1946-052X 2015, Vol. 7, No. 1
t statistics in parenthesis, † denote significance at the 10% level, **denote significance at 5% level, *** denote significance at 1% level 5.7 Robustness Check According to Wintoki, Linck and Netter (2012), the empirical finance attempting to explain the causes and the effects of financial decisions often has serious issues with endogeneity. According to Roberts and Whited (2011), endogeneity leads to biased and inconsistent parameter estimates that make reliable inference virtually impossible. Wintoki, Linck and Netter (2012), used GMM estimator to control for the dynamic nature of the performance-governance relationship suggested by theorists, while accounting for other sources of endogeneity in corporate finance research. Therefore, to check whether our OLS and fixed effects regression estimates are robust, we have also undertaken the analysis using dynamic panel estimation. Results of our dynamic panel estimation are reported in Table 12. Since the Hansen-J test p-values are all high, thus suggest that all the instruments are valid and cannot be rejected at any conventional levels of significance. Table 12. Q is the proportion of ((stock price * No. of share outstanding) + L/T debt + S/T debt) to Total Assets. ROA is the proportion of Net Income to Total Assets. TIME ranges from 2003 to 2009. SIZE is the natural logarithm of the total assets. LEV is the ratio of long term debt to total assets. FMRISK is the standard deviation of the firm’s daily stock returns. OPRISK is the standard deviation of the firm’s past five year ROA. MHARE is the proportion of the firm’s revenue to the total revenue of the firms’ in the sector. IH is the proportion of shares held by institutional investors, FH is the proportion of the shares held by foreign investors, EH is the proportion of the shares held by employees and CH is the proportion of the shares held by corporates. System GMM
L.q
Q
Q
1.17†
0.79**
(1.97)
(2.07)
L.roa LEV SIZE FMRISK OPRISK MSHARE
ROA
ROA
-0.68†
-0.52†
(`-1.80)
(-1.98)
0.84
0.57
-0.19
-0.08
(1.64)
(1.36)
(-0.72)
(-0.47)
-0.12
-0.13
0.08**
0.07**
(-1.17)
(-1.41)
(2.13)
(2.20)
-0.13
0.02
0.04
0.05
(-0.37)
(0.06)
(1.03)
(1.34)
0.13
0.07
-1.48
-1.06
(0.51)
(0.37)
(-1.25)
(-0.79)
4.39
4.34
-4.56
-4.32
(1.35)
(0.94)
(-1.37)
(-1.02)
38
www.macrothink.org/ajfa
Asian Journal of Finance & Accounting ISSN 1946-052X 2015, Vol. 7, No. 1 HI
0.48
0.10
(0.95)
(0.50)
LT5
0.28
-0.03
(0.60)
(-0.07)
F Stats
7.01***
6.88***
6.07***
6.07***
(P-Value)
(0.000)
(0.000)
(0.000)
(0.000)
Firm-fixed Effects
Yes
Yes
Yes
Yes
Year Effects
Yes
Yes
Yes
Yes
No. of obs.
280
280
280
280
No of Instruments
15
20
20
20
No. of Clusters
40
40
40
40
0.15
0.07
0.71
0.04
0.42
0.41
0.28
0.33
0.89
0.46
0.51
0.83
Arellano-Bond test for AR(1) in first differences (p-value) Arellano-Bond test for AR(2) in first differences (p-value) Hansen-J test of over-identification (p-value)
t statistics in parenthesis, † denote significance at the 10% level, **denote significance at 5% level, ***denote significance at 1% level 6. Conclusion This study investigates the nature of the relationship between ownership, identity and financial performance of publicly listed companies in New Zealand and whether the relationship between ownership-performance changes during the financial crisis (2007 to 2009). In regard to the 3 question addressed, we report our findings as follows: 1. Our findings support the view that ownership concentration affects performance. However, our results for New Zealand are quite different to that reported for Turkey (Gursoy and Aydogan, 2002)and China(Xu and Wang, 1999). Results show that a higher ownership concentration in listed companies in New Zealand leads to a lower market-based performance (Tobin’s Q) and higher accounting-based performance (ROA). A plausible reason could be that higher ownership concentration has more formal authority and therefore, blockholding gives enough power to obtain some active roles in the company. The power blockholders’ have in these companies tends to be very high and therefore, their opinions tends to matter in regard to the managerial decision-making. Our results show that blockholders have tended to pay more attention to accounting-based performance rather than market-based performance. This is not surprising as the capital market activities were affected globally, investors barely made any decent gains from share price appreciation. Therefore, investors during the financial crisis have relied on profits from the operational activities to boost their earnings by the way of getting higher dividends payouts.
39
www.macrothink.org/ajfa
Asian Journal of Finance & Accounting ISSN 1946-052X 2015, Vol. 7, No. 1
2. We report that the owner identity do have an effect on the financial performance of publicly listed companies in New Zealand. More “detached” level owners (institutional investors) have a positive effect on market-based performance but negative effect on accounting-based performance. Whereas, more “involved” level owners (employee &corporate investors) have a negative effect on market-based performance. Our findings support the view that institutional ownership increases Tobin’s Q and decreases ROA, whereas corporate holding decreases Tobin’s Q. This result indicate that the “detached” owners have positive effect on market performance but negative effect on accounting performance whereas, “involved” level owners have negative effects on market performance. This finding indicates that the “detached” level owners have less power in seeking the short-run profit and therefore, focus less interest on operational matters but more on long-term growth of the company. 3. Our results show that the relationship between owner identity and financial performance changes during the financial crisis. In New Zealand context, less “involved” shareholding leads to higher performance. Our evidence shows that the effect of owner identity declined during the financial crisis period due to the fact that different types of owners reduced their ownership concentration levels, thus reducing their social influence and expertise powers. Our results reported in Table 1 show that the largest shareholder hold34.49% of the shares and five largest shareholders hold in excess of 50% (on an average basis) of the shares. These results indicate that the top five shareholders have absolute control of the publicly listed companies in New Zealand. Our results also show that the average proportion of corporate and employee holding in New Zealand is much higher compared to that of Australia, the UK and the US; thus confirming the view that the “involvement” ownership type (corporate holding) is more popular in New Zealand context. Our results also show that there are two different kinds of foreign investor existing in New Zealand market, that is, one seeking long-run returns and low risk and other seeking more risky investments opportunities. Finally, we caution readers regarding generalizing the findings of this study as the sample sizeused is small and the study focuses specifically on New Zealand environment. However, the issuesraised could be adopted for future studies. References Ben-Amar W., & Andre P. (2006) Separation of ownership from control and acquiring firm performance: The case of family ownership in Canada. Journal of Business, Finance and Accounting, 33, 517-543.http://dx.doi.org/10.1111/j.1468-5957.2006.00613.x Boone N, Colombage S., & Gunasekarage A. (2011) Block shareholder identity and firm performance in New Zealand. Pacific Accounting Review,23, 185-210.http://dx.doi.org/10.1108/01140581111163999 Chen H, Hexter L., & Hu MY. (1993) Management Ownership and Corporate Value. Managerial and Decision Economics, 14, 335-346.http://dx.doi.org/10.1002/mde.4090140406 40
www.macrothink.org/ajfa
Asian Journal of Finance & Accounting ISSN 1946-052X 2015, Vol. 7, No. 1
Claessens S, Djankov S, Fan J, et al. (2000) The Separation of Ownership and Control in East Asian Corporations. Journal of Financial Economics, 93, 81-112.http://dx.doi.org/10.1016/S0304-405X(00)00067-2 Cubbin J., & Leech D. (1983) The effect of shareholding dispersion on the degree of control in East Asian corporations. The Economic Journal, 93, 351-369.http://dx.doi.org/10.2307/2232797 Demsetz H. (1983) The Structure of Ownership and the Theory of the Firm. Journal of Law & Economics, 26, 375-390.http://dx.doi.org/10.1086/467041 Demsetz H., & Lehn K. (1985) The Structure of Corporate Ownership: Causes and Consequences. Journal of Political Economy, 93, 1155-1177.http://dx.doi.org/10.1086/261354 Demsetz H., & Villalonga B. (2001) Ownership Structure and Corporate Performance. Journal of Corporate Finance, 7, 209-233.http://dx.doi.org/10.1016/S0929-1199(01)00020-7 Dodd P., & Warner J. (1983) On corporate governance: a study of proxy contests. Journal of Financial Economics, 11, 401-439.http://dx.doi.org/10.1016/0304-405X(83)90018-1 Dyck A., & Zingales L. (2004) Private Benefits of Control: An International Comparison. Journal of Finance, 59, 537-600.http://dx.doi.org/10.1111/j.1540-6261.2004.00642.x Elayan FA, Lau JSC., & Meyer TO. (2003) Executive Incentive Compensation Schemes and Their Impact on Corporate Performance: Evidence from New Zealand Since Compensation Disclosure Requirements Became Effective. Studies in Economics and Finance, 21, 54-92.http://dx.doi.org/10.1108/eb028769 Faccio M., & Lang L. (2002) The ultimate ownership of Western European corporations. Journal of Financial Economics, 66, 365-395.http://dx.doi.org/10.1016/S0304-405X(02)00146-0 Finch EM and Shivadasani A. (2006) Are Busy Boards Effective Monitors? The Journal of Finance, 61(2), 689-724.http://dx.doi.org/10.1111/j.1540-6261.2006.00852.x Griffith GM. (1999). CEO Ownership and Firm Value. Managerial Decision and Economics 20: 1-8. http://dx.doi.org/10.1002/(SICI)1099-1468(199902)20:13.0.CO;2-T Gugler K. (1999).Corporate Governance and Economic Performance: A Survey. memo. Austria: University of Vienna. Gugler K, Mueller DC., & Yurtoglu BB. (2008) Insider Ownership, Ownership Concentration and Investment Performance: An International Comparison. Journal of Corporate Finance, 15, 688-705. http://dx.doi.org/10.1016/j.jcorpfin.2008.09.007 Gursoy K., & Aydogan K. (2002) Equity ownership structure, risk taking, and performance: An empirical investigation in Turkish listed companies. Emerging Market Finance and Trade, 41
www.macrothink.org/ajfa
Asian Journal of Finance & Accounting ISSN 1946-052X 2015, Vol. 7, No. 1
38, 6-25. Herman ES. (1981).Corporate Control, Corporate Power, Cambridge: Cambridge University Press.
Horner MR. (1988) The Value of the Corporate Voting Right: Evidence from Switzerland. Journal of Banking and Finance, 12, 69-83.http://dx.doi.org/10.1016/0378-4266(88)90051-9 Hossain M, Prevost AK., & Rao RP. (2001) Corporate governance in New Zealand: The effect of the 1993 Companies Act on the relation between board composition and firm performance. Pacific-Basin Finance Journal, 9, 119-145.http://dx.doi.org/10.1016/S0927-538X(01)00003-8 Jensen MC., & Meckling W. (1976) Theory of the Firm: Managerial Behavior, Agency Cost and Ownership Structure. Journal of Financial Economics, 3, 305-360.http://dx.doi.org/10.1016/0304-405X(76)90026-X Kang JK., & Sorensen AB. (1999) Ownership Organizational and Firm Performance. Annual Review of Sociology, 25, 121-144.http://dx.doi.org/10.1146/annurev.soc.25.1.121 Kang JK., & Stulz RM. (1996). How Different is Japanese Corporate Finance? An Investigation of the Information Content of New Security Issues. Review of Financial Studies, 9, 109-139.http://dx.doi.org/10.1093/rfs/9.1.109 Kim WS, Lee LW., & Francis JC. (1988). Investment Performance of Common Stocks in Relations to Insider Ownership. Financial Review, 23, 53-64.http://dx.doi.org/10.1111/j.1540-6288.1988.tb00774.x Larner RJ. (1971).Management Control and the Large Corporation, New York: Dunellen. Levy H. (1982). Economic Evaluation of Voting Power of Common Stock. Journal of Finance, 38, 79-93.http://dx.doi.org/10.1111/j.1540-6261.1983.tb03627.x McConnell JJ., & Servaes H. (1990). Additional Evidence on Equity Ownership and Corporate Value. Journal of Financial Economics, 27, 595-612.http://dx.doi.org/10.1016/0304-405X(90)90069-C McEachern WA. (1975).Managerial Control and Performance, Lexington: Lexington Books. Mehran H. (1995). Executive Compensation, Ownership, and Form Performance. Journal of Financial Economics, 38, 163-184.http://dx.doi.org/10.1016/0304-405X(94)00809-F Mintzberg H. (1983). Power in and Around Organizations, Englewood Cliffs, NJ: Prentice Hall. Morck R, Shleifer A., & Vishny RW. (1988). Management Ownership and Market Valuation: An Empirical Analysis. Journal of Financial Economics, 20, 293-315.http://dx.doi.org/10.1016/0304-405X(88)90048-7
42
www.macrothink.org/ajfa
Asian Journal of Finance & Accounting ISSN 1946-052X 2015, Vol. 7, No. 1
New Zealand Securities Commission. (2006). Securities Commission Review Reveals Shortcomings in 2005 Financial Reports. (accessed 10 August 2006). Oswald SL., & Jahera Jr. JS. (1991) .The Influence of Ownership on Performance: An Empirical Study. Strategic Management Journal, 12, 321-326.http://dx.doi.org/10.1002/smj.4250120407 Pfeffer J. (1992). Managing With Power, Policies and Influence in Organizations, Boaston: Harvard Business Press. Reddy K, Locke SM and Scrimgeour FG. (2010). The efficacy of principle-based corporate governance practices and firm financial performance: An empirical investigation. International Journal of Managerial Finance, 6, 190-219.http://dx.doi.org/10.1108/17439131011056224 Roberts MR, Harris M., & Whited TM. (2011). Endogeneity in empirical corporate finance. In: Constantinides M and Stulz R (eds) Handbook of the Economics of Finance. Los Angeles: Elsevier, 493-572. Rydqvist K. (1987). Empirical Investigation of the Voting Premium. Northwestern University, Working Paper No. 35. Shleifer A., & Vishny R. (1986). Large Shareholders and Corporate Control. Journal of Political Economy, 94, 737-783.http://dx.doi.org/10.1086/261385 Shleifer A., & Vishny RW. (1997). A Survey of Corporate Governance. Journal of Finance, 52, 737-783.http://dx.doi.org/10.1111/j.1540-6261.1997.tb04820.x Short H. (1994). Ownership, control, financial structure and the performance of firms. Journal of Finance, 52, 737-783. Short H., & Keasey K. (1999). Managerial Ownership and the Performance of Firms: Evidence from the UK. Journal of Corporate Finance, 5, 79-101.http://dx.doi.org/10.1016/S0929-1199(98)00016-9 Sorensen AB. (1996). The structural basis of social inequality. American Journal of Sociology, 101, 1333-1365.http://dx.doi.org/10.1086/230825 The Canadian Institute of Chartered Accountants of Canada. (2010.) Environmental, Social and Governance (ESG) Issues in Institutional Investor Decision Making. Toronto: The Canadian Institute of Chartered Accountants. Wade J, O'Reilly C., & Chandratat I. (1990). Golden parachutes: CEOs and the exercise of social influence. Administrative Science Quarterly, 35, 587-603.http://dx.doi.org/10.2307/2393510 Weber M. (2008). Economy and Society: An Outline of Interpretive Sociology. In: Biggart NW (ed) Readings in Economic Sociology. Oxford, UK: Blackwell Publishers Ltd, 24-37. Welch E. (2003). The Relationship Between Ownership Structure and performance in Listed 43
www.macrothink.org/ajfa
Asian Journal of Finance & Accounting ISSN 1946-052X 2015, Vol. 7, No. 1
Australian Companies. Australian Journal 287-305.http://dx.doi.org/10.1177/031289620302800304
of
Management,
28,
Wintoki MB, Linck JS., & Netter JM. (2012). Endogeneity and the Dynamics of Internal Corporate Governance. Journal of Financial Economics, 105, 581-606.http://dx.doi.org/10.1016/j.jfineco.2012.03.005 Xu X., & Wang Y. (1999) Ownership structure and corporate governance in Chinese stock companies. China Economic Review, 10, 75-98.http://dx.doi.org/10.1016/S1043-951X(99)00006-1 Zajac EJ., & Westphal JD. (1995) Who shall govern? CEO/board power, demographic similarity, and new director selection. Administrative Science Quarterly, 40, 60-83.http://dx.doi.org/10.2307/2393700 Zajac EJ., & Westphal JD. (1996) Director reputation. CEO-board power, and the dynamics of board interlock. Administrative Science Quarterly, 41, 507-529.http://dx.doi.org/10.2307/2393940 Zingales L. (1994). The Value of the Voting Right: A Study of the Milan stock Exchange. Review of Financial Studies, 1, 125-148.http://dx.doi.org/10.1093/rfs/7.1.12
44
www.macrothink.org/ajfa