Domino: A Descriptive Framework for Hybrid Collaboration and Coupling Styles in Partially Distributed Teams THOMAS NEUMAYR, University of Applied Sciences Upper Austria, Austria HANS-CHRISTIAN JETTER, University of Applied Sciences Upper Austria, Austria MIRJAM AUGSTEIN, University of Applied Sciences Upper Austria, Austria JUDITH FRIEDL, University of Applied Sciences Upper Austria, Austria THOMAS LUGER, University of Applied Sciences Upper Austria, Austria We present Domino, a descriptive framework for hybrid collaboration and hybrid coupling styles in partially distributed teams. Domino enables researchers to describe, analyze, and understand real-world hybrid collaboration practices, i.e., collaborative practices that involve simultaneous co-located and remote collaboration with phases of both synchronous and asynchronous work that spans multiple groupware applications and devices. It also helps to categorize collaborative activities based on yet undocumented hybrid coupling styles between the members of multiple partially distributed or co-located subgroups. Our Domino framework was derived from initial observations of real-world practice and refined by the detailed analysis of participants’ behavior and working styles during a simulation of a complex hybrid collaboration task with six partially distributed teams of four users in our lab. The resulting framework allows researchers to view collaboration through a new analytical lens, apply new analytical tools, and also derive implications for the design of collaborative systems. CCS Concepts: • Human-centered computing → Computer supported cooperative work; Additional Key Words and Phrases: Hybrid Collaboration; Descriptive Framework; Partially Distributed Teams ACM Reference Format: Thomas Neumayr, Hans-Christian Jetter, Mirjam Augstein, Judith Friedl, and Thomas Luger. 2018. Domino: A Descriptive Framework for Hybrid Collaboration and Coupling Styles in Partially Distributed Teams. Proc. ACM Hum.-Comput. Interact. 2, CSCW, Article 128 (November 2018), 24 pages. https://doi.org/10.1145/3274397
1
INTRODUCTION
Descriptive models and frameworks are of critical importance in HCI and CSCW research. Famous examples are Johansen’s time-space matrix [22], Gutwin & Greenberg’s mixed-focus collaboration [13] and workspace awareness [14], Scott et al.’s territoriality [35], or Tang et al.’s and Isenberg et al.’s coupling styles during co-located collaboration [18, 36, 38]. These frameworks help us to describe and analyze complex real-world collaboration and to view it through new and different Authors’ addresses: Thomas Neumayr, University of Applied Sciences Upper Austria, Softwarepark 11, 4232, Hagenberg, Austria,
[email protected]; Hans-Christian Jetter, University of Applied Sciences Upper Austria, Softwarepark 11, 4232, Hagenberg, Austria,
[email protected]; Mirjam Augstein, University of Applied Sciences Upper Austria, Softwarepark 11, 4232, Hagenberg, Austria,
[email protected]; Judith Friedl, University of Applied Sciences Upper Austria, Softwarepark 11, Hagenberg, 4232, Austria,
[email protected]; Thomas Luger, University of Applied Sciences Upper Austria, Softwarepark 11, 4232, Hagenberg, Austria,
[email protected]. Permission to make digital or hard copies of all or part of this work for personal or classroom use is granted without fee provided that copies are not made or distributed for profit or commercial advantage and that copies bear this notice and the full citation on the first page. Copyrights for components of this work owned by others than ACM must be honored. Abstracting with credit is permitted. To copy otherwise, or republish, to post on servers or to redistribute to lists, requires prior specific permission and/or a fee. Request permissions from
[email protected]. © 2018 Association for Computing Machinery. 2573-0142/2018/11-ART128 $15.00 https://doi.org/10.1145/3274397 Proceedings of the ACM on Human-Computer Interaction, Vol. 2, No. CSCW, Article 128. Publication date: November 2018.
128
128:2
T. Neumayr et al.
Fig. 1. The setting of our study with three rooms. Room 1 (a): Two co-located participants working with MS Surface Hub (84 inch) and up to four iPad Air 2 tablets. Room 2 & 3 (b & c): One remote participant per room working with desktop PC and audiovisual connection to the other rooms. All devices were used to interact with a custom-made prototype application to access shared workspaces.
analytical lenses. For example, they are often used to understand and design novel ways of colocated collaboration around interactive tabletops [18, 20, 36], with cross-device systems using multiple mobile devices [7, 25–27, 29, 40], or in multi-device interactive spaces [10, 21, 41]. With rapidly changing technologies for CSCW, it is however necessary to regularly verify if our descriptive frameworks still have sufficient descriptive power and – if not – to resharpen or change our analytical tools accordingly. For instance, in our research with industry partners, we observed new forms of collaborative practices that eluded a sufficiently precise description and analysis with the above-mentioned, well-established frameworks. We felt that they did not have sufficient descriptive power to capture the true nature of the collaboration we observed and that they would have hidden its emergent structure and true complexity. One reason was that these new forms involved simultaneous co-located and remote collaboration during phases of synchronous and asynchronous work, so that they eventually spanned all four quadrants (co-located vs. remote, synchronous vs. asynchronous) of the time-space matrix [22]. Just by using the standard features of currently popular CSCW apps (e.g. Slack1 ) or hardware (e.g. Microsoft Surface Hub), the collaboration quickly involved all of the four quadrants of the matrix. Thus the matrix was not precise enough to analyze such real-world CSCW practices. Users also did not rely exclusively on a single groupware tool. Instead, many different tools were used in parallel which also resulted in having not one but multiple workspaces in which users collaborated and for which they needed greater workspace awareness [13]. Furthermore, this new kind of collaboration also involved multiple different devices, so that functionality and content were distributed, for example, across multiple laptops, PCs, smart phones, tablets, or projectors. Finally, as is typical in mixed-focus collaboration, users changed between phases of tightly and loosely coupled collaboration [14] among subgroup members, but with new coupling styles that are not yet documented in the relevant CSCW and HCI literature such as [7, 18, 36, 38]. For example, except the very recent work by Brudy et al. [7], the described coupling styles in literature do not involve more than two users [18, 36, 38] or are co-located only [18, 36]. Thus they cannot describe how teams split into subgroups of two or more members who were sometimes co-located, sometimes remote, and sometimes partially distributed [8]. In this paper, we henceforth refer to this kind of collaboration that eluded a sufficiently precise description and analysis with well-established CSCW frameworks as hybrid collaboration. Based on these real-world observations, we formulated an initial framework and then recreated a realistic scenario of hybrid collaboration in our lab to derive a better descriptive framework from our observations. Six groups of four users were invited to our lab to work together on a complex sensemaking task. Each group was distributed over three rooms and worked with a custom-made 1 http://slack.com/
Proceedings of the ACM on Human-Computer Interaction, Vol. 2, No. CSCW, Article 128. Publication date: November 2018.
Domino: A Descriptive Framework for Hybrid Collaboration and Coupling Styles
128:3
prototype application that spanned a large interactive whiteboard, four tablets, and two desktop PCs including video-/audio-transmissions and text-based chat messages (Figure 1). After a detailed, open-ended analysis of the video- & audio-recordings, chat protocols, and log files, we could identify a wide range of different collaboration and coupling styles that emerged during hybrid collaboration and we developed the new Domino framework for their description. More specifically, we present the following contributions in this paper: 1.) A definition of hybrid collaboration to name and discuss a range of new and yet undocumented collaboration practices that involve co-located and remote, synchronous and asynchronous, and cross-device and cross-application collaboration. 2.) The Domino framework that includes a new visual notation, new analytical tools (e.g. new quantitative measures), and extensions of existing frameworks (e.g. Brudy et al. [7], Isenberg et al. [18], Tang et al. [36], Tuddenham et al. [38]) to describe and analyze such hybrid collaboration. 3.) Concrete examples from our user study of how to apply Domino to analyze different forms of awareness [14], territoriality [35] and working styles during hybrid collaboration. 2
RELATED WORK
Our discussion of related work focuses on descriptive CSCW frameworks and previous research on partially distributed teams. We also discuss existing work on collaborative coupling styles in co-located and remote scenarios. Based on this overview, we illustrate how our new notion of hybrid collaboration, our Domino framework, and the design and analysis of our user study were guided by related work. 2.1
Time-Space Matrix
The time-space matrix by Johansen from 1988 has been described as the most common and most often used classification of groupware systems [3]. For the time dimension, it differentiates between same time and different time to distinguish between synchronous or asynchronous cooperation. For the space dimension, it differentiates between same place and different place to describe whether cooperation takes place in a co-located or remote setting [22]. The matrix has been extended and revised several times, e.g., by Grudin [12] who additionally distinguishes between “different but predictable” and “different but unpredictable” for time and space. Nonetheless, Lee & Paine recently argued that Johansen’s model “does not and was not designed to be able to grapple with the variety and complexity of the systems that we are attempting to design today nor the great variety in contemporary societies” [24]. This resonates with our observations that users tend to use a mix of tools and collaboration styles in parallel for their different aims and needs which leads to more complex hybrid collaboration that cannot be sufficiently described with the time-space matrix (or other two-dimensional dichotomies) alone. With regard to space, the matrix’s applicability has also been criticized by Schmidt & Rodden [34] who consider the distinction between co-located and remote cooperation a “category mistake”. They argue that “Distance in space is only an issue in so far as the techniques of communication available for interaction across that space offers [sic] restricted bandwidth and delayed feedback compared with the full capacity of face-to-face interaction” [34]. However, more recent CSCW and HCI research reveals that small changes to the setting of co-located collaboration, e.g., display orientation [31], user configuration around tabletops [18, 36], size of personal territories on a tabletop [35], can already have strong effects. If the nature of co-located collaboration is changed by these comparably small differences, it is highly unlikely that major changes like relocating team members from remote to co-located (or vice versa) would not have a similar or even stronger effect, e.g., leading to spatial distortions and decreased remote presence [5, 28]. Similarly, Kraut et al. [23] also point out that it is substantially harder to accomplish remote than co-located collaboration, Proceedings of the ACM on Human-Computer Interaction, Vol. 2, No. CSCW, Article 128. Publication date: November 2018.
128:4
T. Neumayr et al.
because communication as a prerequisite for collaboration becomes usually less frequent, not due to technical restrictions but due to user preferences and necessary effort. Our notion of hybrid collaboration therefore still uses the two dimensions space and time of the original time-space matrix. However, it does not consider them as dichotomies but as continua. With regard to space, we differentiate between co-located and remote, but do not consider them as mutually exclusive during collaboration. We explicitly include scenarios with multiple subgroups of a larger team working in parallel who are partially co-located and partially remote. With regard to time, our notion of hybrid collaboration also considers synchronicity as a continuum. At one end of the spectrum, we locate purely synchronous collaboration with a few seconds and up to three minutes between user interactions (e.g. video conversation or shared editing). At the opposite end, there is purely asynchronous collaboration with several minutes to hours between user interactions (e.g. dialog via email or in comments section). Our user study was not aimed at observing collaboration at more than three locations or for more than 1.5 hours. Nonetheless, the goal for the Domino framework is to be applicable to collaborative work that happens at up to ten locations and could last for several days. 2.2
Partially Distributed Teams
Partially Distributed Teams (PDTs) are teams in which at least one team member is located elsewhere and is typically connected to the rest of the team via computer-mediated communication channels [8]. Bos et al. [4–6], Voida et al. [39], and Cheshin et al. [9] conducted several lab studies that used a web-based prototype of a simple collaborative trade and production game with an email-like chat functionality to identify factors that influence the nature of collaboration in PDTs. They found that the medium of communication (e.g., face-to-face conversation vs. text-based chat) has an influence on the perceived social presence of a team member and the communication effectiveness of the team, but not necessarily on the overall team performance. They identified four key factors: (1) Location of individual group members [4, 5]: Are members “remotes” or “collocateds”? Relocating team members (by swapping remotes and collocateds) resulted in a plummeting performance for the new remotes, even when they had been closely involved as collocateds in the team before. However, their performance balanced to some extent over time after developing new skills and strategies. Location also changed awareness of collaborators: Collocateds developed collocation blindness meaning that remotes had a generally lower social presence from the perspective of the collocateds. (2) Shared identity [6]: Do team members have a shared identity (also sometimes called group identity, collective identity, or in-group membership)? Bos et al. found that this is crucial for effective teamwork and can help alleviate possible drawbacks connected to location, but even then distance still matters. (3) Interplay of shared identity & location [39]: PDTs are vulnerable to forming in-groups along different fault lines with location being the most commonly mentioned fault line, but also shared identity influences the performance of teams. Voida et al. found that both are strong indicators for higher collaboration rates, but no significant interaction between the two factors could be found. However, while shared identity mitigated some of the effects of the location fault line, both fault lines still had an effect on the performance of the team members. (4) Electronic communication norms (ECN) [9]: ECNs differ, for example, in the types of information that is shared, the rate of interaction, or the formality of messages. Cheshin et al. investigated the emergence of ECNs and showed that traveling members kept some of their ECNs after swapping remotes and collocateds. Proceedings of the ACM on Human-Computer Interaction, Vol. 2, No. CSCW, Article 128. Publication date: November 2018.
Domino: A Descriptive Framework for Hybrid Collaboration and Coupling Styles
128:5
This existing body of research about PDTs is highly relevant to our work. First, it confirms the importance of looking at teams with two or more members who are partially distributed instead of only considering purely co-located or remote collaboration. Second, it reveals that the specifics of the collaboration setting, including location of members and employed communication channels, have a great influence on collaboration styles and effectiveness and should be subject to research. To better understand such influencing factors and how they play out in practice, researchers require a framework for a more detailed description and analysis of partially distributed collaboration. As a consequence, we intend our Domino framework to enable such a detailed description and analysis, not only with regard to the entire team, but also with regard to multiple partially distributed subgroups working in parallel and their individual coupling styles. 2.3
Collaborative Coupling Styles
Gutwin & Greenberg [13] report that collaborative work usually involves both shared and individual activities. During this “mixed-focus” collaboration, people move back and forth between focusing on individual tasks and shared work. Gutwin & Greenberg also report that people in such settings need to maintain awareness of the activities of the rest of the group in order to coordinate, give feedback, or join. The level of awareness can vary drastically, not only due to technical and infrastructural factors [13, 14] but also due to the actual connectedness of the tasks and personal preferences. We also observed this repeatedly during our user study. Past research placed mixed-focus collaboration in a continuum between the extremes of “loosely coupled” vs. “tightly coupled” collaboration [2, 13, 14, 35] (or also “loose” vs. “close” collaboration [18]). Tang et al. consider coupling as related to the “dependency of participants on one another” [36]. Thus, tight coupling comes into effect when collaborators can only progress by interacting with each other. In contrast, loose coupling during collaboration is typical when participants can work independently for a long time [33, 36]. Tang et al. additionally describe tightly coupled group activities as “coordinated and fluid, likely because the goals and intentions of each individual are known to the other” and loosely coupled activities as guided by “implicit, unspoken coordination” [36]. In general, collaborative systems that support smooth transitions within this continuum and a variety of collaborative couplings are considered especially helpful [20, 36]. Co-located Coupling Styles. The distinction between tightly coupled and loosely coupled activities has proven to be useful for understanding co-located collaboration, e.g., collaborative work around tabletops [17, 18, 20, 36, 37]. To better describe how tightly and loosely coupled work happens in detail, different researchers have proposed to categorize interactions into different coupling styles [36]. For example, Tang et al. [36] conducted an observational study on collaboration around a tabletop display to better understand mixed-focus collaboration and how it affects the use of space on and around the tabletop. They proposed a list of six coupling styles (SPSA, VE, SPDA, V, DE, DP) describing the coupling between a pair of users. For example, SPSA–“Same problem, same area” stands for both working on the same problem in the same area of the table or VE–“View engaged” stands for one person working and another person viewing this work in an engaged manner. Subsequent work built upon this framework for understanding collaboration in other application domains and settings. For example, Isenberg et al. [18] investigated collaboration around an interactive tabletop during co-located sensemaking by two users and revised and extended Tang et al.’s list of coupling styles including, for example, DISC–“active discussion” or SIDV –“sharing of the same information but using different views”. Thereby Isenberg et al. classified five of their eight observed coupling styles (DISC, VE, SV, SIDV, SSP) as “close collaboration” (i.e. tightly coupled). The remaining three (SGP, DP, D) are examples of “loose collaboration” (i.e. loosely coupled). Proceedings of the ACM on Human-Computer Interaction, Vol. 2, No. CSCW, Article 128. Publication date: November 2018.
128:6
T. Neumayr et al.
In a recent publication, Brudy et al. [7] have extended the use of coupling styles to co-located teams of four. They investigate the role of an overview device in a multi-device collaboration setting and propose a revised list of coupling styles that, like ours, are grounded in the original lists of Tang et al. and Isenberg et al. [18, 36]. They identify five styles (AD, SSV, DSV, DDV, DV ) to describe where the attention of the team members was (e.g. DSV –“Disjoint and Shared View. 2-3 members focus their attention to a single device whilst others continue discussions.”). Although Brudy et al.’s work is similar to Domino in the use of coupling styles to qualitatively categorize and analyze collaborative behavior of teams with more than two members, our work here originated independently from theirs and focuses on partially-distributed and not on co-located teams. For our Domino framework and user study, we therefore used Isenberg et al.’s list of coupling styles to alter and extend it [17, 18]. These alterations and extensions became necessary because Isenberg et al. focused on co-located pairs and not on larger and partially-distributed teams. Remote and Hybrid Coupling Styles. A further important inspiration for our work was Tuddenham & Robinson’s work on remote coupling styles. In their scenario, two connected tabletops were synchronized in real-time to support remote collaboration. To support awareness, the arms of the remote tabletop user were represented as “arm shadows” on the local tabletop [38] and vice versa. Their coding categories contained four coupling styles that were based on Tang et al. [36], i.e., SWSP–“Simultaneous work on the same problem”, VE–“View engaged”, DISC–“Discuss”, IW – “Independent work”. Tuddenham and Robinson [38] observed that participants seemed to be able to transition fluidly among these different coupling styles. Such “coupling transitions” seemed “rapid and opportunistic, instigated not only by explicit gestures or conversation, but instead by watching each other’s arm movements in the workspace” and “each other’s manipulation of task artefacts”. This resonates with Jetter et al. who report that users around their tabletop application developed signs of a “flow experience” within a group that did not require explicit verbal coordination [20]. We consider such a “flow experience” including fluid coupling transitions and high awareness levels as very desirable for remote or partially-distributed collaboration. Our goal for the new Domino framework was therefore to enable researchers to capture and analyze such coupling transitions over time, not only for co-located but also for partially-distributed or remote teams. 3
FOUNDATIONS OF THE DOMINO FRAMEWORK
Our Domino framework is the result of a three step research process: In step 1, we used first insights from informal observations of real-world collaborative practices and interviews with practitioners to arrive at an initial definition of hybrid collaboration (section 3.1). In step 2, this definition was compared and combined with above-mentioned previous and related work to propose an initial framework and notations (sections 3.2 and 3.3). Step 3 was an observational user study of hybrid collaboration in our lab (section 4).
Fig. 2. A visual illustration of an example scenario of hybrid collaboration, including synchronous team meetings, involving remote team members, and asynchronous individual work.
Proceedings of the ACM on Human-Computer Interaction, Vol. 2, No. CSCW, Article 128. Publication date: November 2018.
Domino: A Descriptive Framework for Hybrid Collaboration and Coupling Styles 3.1
128:7
An Initial Definition of “Hybrid Collaboration”
Figure 2 shows an example scenario of hybrid collaboration: A co-located team of four is reviewing production data using a large interactive screen in a company’s headquarter. During the review, they spot anomalies at a manufacturing site and alert collaborators there by highlighting the data points in question. This triggers a notification on a mobile device of a production manager at the remote manufacturing site, who then reviews data together with a machine operator on the shopfloor. After the completion of the data review, the results are transferred asynchronously into the headquarter to be further discussed. While this storyboard shows a hypothetical scenario, it illustrates the defining characteristics of the hybrid collaboration including synchronous, asynchronous, co-located, and remote collaboration spanning different applications and devices. This concept of hybrid collaboration is based on our own informal observations of collaborative practices that we made at different companies who strongly rely on distributed teams: (1.) We held meetings with production managers at a manufacturer of automotive parts with manufacturing sites in eight different countries on four different continents. There we learned about current practices for distributed production planning and review, e.g., emailing messages and files, video conferences with laptops, smartphones, or desktop PCs, and multi-directional presentation of slides and spreadsheets using screen sharing. (2.) We talked to team leaders at the headquarter of a supplier of material handling equipment and conveyor installations for logistics centers with subsidiaries in 13 countries. They emphasized the importance of devices such as laptops and smart phones for synchronous and asynchronous remote collaboration between teams of engineers and software developers during on-site installations in distant countries. (3.) We observed sprint review meetings during SCRUM software development with distributed developer teams located in the US, Austria, and Poland. Here, many different tools for synchronous and asynchronous collaboration (issue & project tracking, Wiki documentation, version control, instant messaging, video conferencing) were used simultaneously in sessions with co-located and remote collaborators. While we did not conduct a formal data collection and analysis at that stage, our observations already revealed real-world collaborative practices that cannot be sufficiently described using existing frameworks. We defined these practices as hybrid collaboration, which differs from collaboration in literature in the following aspects: Our definition of hybrid collaboration: (1.) Hybrid collaboration switches back and forth between all four quadrants of the time-space matrix. There are constant transitions between co-located and remote as well as synchronous and asynchronous collaboration; (2.) The team size S is greater than just two collaborators and multiple coupling styles can coexist simultaneously within a single team, effectively dividing the whole team in multiple temporary subgroups with each one having a size of 1 ≤ Ssub ≤ S and an individual coupling style; (3.) Users typically do not rely on a single groupware application or hardware device but simultaneously use different tools and devices during collaboration. 3.2
The Domino Notation for Collaboration Analysis
To enable an in-depth analysis of hybrid collaboration, we propose the visual Domino notation (Figure 3a). It enables us to efficiently describe the collaboration style and the division of a team into subgroups for each moment of the collaboration. We illustrate this in Figure 3a using the example of a team of four collaborators with two co-located users in one room and two remote rooms, each with a further user. This example reflects our study setting from Figures 1 and 3b. All collaborators are represented as black dots that are similar to the spots on a tile of the wellknown Dominoes game, thus the name “Domino” notation. The position of a user’s dot is defined by the room they are located in. The dots of the users P1 and P2 from room 1 are in the top left and Proceedings of the ACM on Human-Computer Interaction, Vol. 2, No. CSCW, Article 128. Publication date: November 2018.
128:8
T. Neumayr et al.
top right of Figure 3a. The two users P3 from room 2 and P4 from room 3 are shown in the bottom left and bottom right. Solid black lines between users indicate that they are spatially-separated in different rooms or locations and need technical means to communicate with each other. Whenever two or more users engage in collaboration and form a subgroup of the PDT, all dots for this subgroup get mutually connected with either red or blue lines. Red lines indicate that the subgroup is engaged in one of the possible coupling styles for tightly coupled collaboration. Blue lines indicate that the subgroup is engaged in one of the possible coupling styles for loosely coupled collaboration. Each subgroup can only have one coupling style at a time and users cannot belong to multiple subgroups in parallel. The example in Figure 3a shows that currently two subgroups (P1 & P3, P2 & P4) exist with one being tightly coupled and the other loosely coupled. The notation can also be used to show the development of collaboration over time. Figure 4 shows each configuration during a PDT’s collaboration session. If a user is currently disengaged and not participating in the overall task at all, e.g., while having technical problems or talking to people outside their team, they disappear from the Domino tile (e.g. tile #2 & #4 in Figure 4). Unconnected dots depict team members who are participating in the overall task but are currently working solitarily on a different problem or subtask than anyone else (e.g. tile #3 & #5 in Figure 4). 3.3
Applicability and Scalability of the Domino Notation in Future Scenarios
Figures 3a and 4 show the Domino notation as it was used during our analysis of the user study, i.e., with a team size of four users (T = 4) who are distributed across three different locations (L = 3). To demonstrate the applicability and scalability of the Domino notation for more complex scenarios, Figure 5 shows how the notation can be extended to use it for larger team sizes or more locations. When the number of locations and collaborators rise, we propose to use miniature versions of radial network visualizations (see Figure 5b) which are frequently used by the information visualization community for social network analysis or analysis of similar graph data [42]. While this notation loses the simplicity and resemblance of a Domino tile, different locations, subgroups, and coupling styles can still be visualized in a consistent manner by representing each user as a dot and each room or location as a differently sized wedge. However, the visual complexity of the notation increases with growing team sizes and more locations. Therefore standard algorithms (e.g. [16]) for curved edges (see Figure 5c) or also hierarchical edge bundling (see Figure 5d) can be used to minimize overplotting and intersections between edges. The radial network visualizations in Figure 5b to 5d were rendered by an interactive visualization tool that we are currently working on as part of our future work. It will enable researchers to interactively explore and analyze collaboration data using the Domino notation. Interactivity will improve usability and accessibility of the notation,
(a) The Domino notation for hybrid collaboration analysis.
(b) Study setup in 4 rooms with 4 participants and 2-4 experimenters.
Fig. 3. Schematic representation of a Domino (a) and our study setup (b). Proceedings of the ACM on Human-Computer Interaction, Vol. 2, No. CSCW, Article 128. Publication date: November 2018.
Domino: A Descriptive Framework for Hybrid Collaboration and Coupling Styles
128:9
Fig. 4. Development of collaboration within a PDT over time. This sequence of Dominoes shows each configuration (i.e. involved users, location, tight or loose coupling). The number and start time of a configuration and its duration is printed below each Domino. This figure shows the data from team 2 of our user study (see section 4). 27.08.18, 13*45
12
4
11
5
3 10
1 2
6 7
20 19 18 17
8 9
6
8
9
(c) T=16; L=5
11 12
7
4
(b) T=8; L=3
5
10
5
4
16 15 14 13
2
3
1 2
1
15
23 22 21
3
13
6
(a) T=4; L=3
26 25 24
16
8
14
7
24.08.18, 16*37
27.08.18, 13*45
(d) T=26; L=8
Fig. 5. Possible extensions of the Domino notation for future scenarios. T: team size. L: number of locations. file:///Users/thomas/Downloads/T8L3%20-%20curve%200.svg
Seitefile:///Users/thomas/Downloads/T16L5%20-%20curve%200.25.svg 1 von 1
Seitefile:///Users/thomas/Downloads/cscwdominotests.svg 1 von 1
Seite 1 von 1
especially for larger teams at more locations. This will be achieved by providing zooming, filtering, and mouse-over tooltips for nodes and edges. Users with impaired color vision or visual acuity will also be able to choose high contrast colors or dotted vs. solid edges. In the future, the tool could also be extended to visualize the relocation of team members using animated transitions between different configurations and tracing team members by their IDs. 4
USER STUDY FOR FRAMEWORK DERIVATION
After formulating our initial definitions, hypotheses, and notations during step 1 and 2, we proceeded to step 3 of our research process. In this step, we conducted a user study of hybrid collaboration Proceedings of the ACM on Human-Computer Interaction, Vol. 2, No. CSCW, Article 128. Publication date: November 2018.
128:10
T. Neumayr et al.
with six teams of four users during which we observed, recorded, and analyzed emergent user behaviors and collaboration styles. Our goal for the study was to observe the true complexity and variety of hybrid collaboration by simulating a realistic sensemaking task in our lab. We then derived our framework for hybrid collaboration from these observations. It is important to notice that our study was not intended to be a controlled experiment to arrive at generalizable findings about hybrid collaboration or its “true nature”. Instead, our study was aimed at stimulating and observing a great bandwidth of hybrid collaboration styles and to identify and record as many different team configurations, hybrid working styles, and hybrid coupling styles as possible. Our goal was to create this variety to verify the expressiveness and descriptive power of our initial framework and to extend it whenever necessary – even for unusual configurations, coupling styles, or similar outliers. Therefore, we provided participants with a study setting that was complex and flexible enough to stimulate a great diversity of individual collaborative practices. Instead of a study “in the wild”, we decided for a lab study and an artificial task as is very common in PDT research, e.g., in [4–6, 9, 39]. This was mainly done due to practical considerations: Recording hybrid collaboration “in the wild” including all user interactions poses a great technological challenge. It is hard to realize in real-world workplaces where meetings have to be efficient and time or money are at stake. Furthermore, the artificial task enabled us to circumvent typical problems of research in a business context with privacy, intellectual property, or classified materials. Nonetheless, future work will also include “in the wild” observations at our industry partners. 4.1
Hybrid Collaboration Task
For our study, we used the“Stegosaurus” task and data set of the VAST 2006 Contest [11]. It has become a de facto standard for sensemaking studies in HCI, information visualization, or CSCW. It provides participants with a sufficiently realistic as well as demanding task and data set and has been used in many previous publications, e.g. [1, 15, 17–19, 41]. The VAST Contest puts users into the role of investigators who try to shed light on a series of strange incidents and an assumed conspiracy in a fictitious US town. Data is provided as a collection of 238 fictitious information items including news articles, maps, images, and spreadsheets. The main challenge for the teams is to read, categorize, and make sense of the bulk of available data and to identify persons or events linked to a yet unknown mysterious plot looming in the background. The dataset of 238 items is suited for user studies that last up to a few hours, but achieving conclusive results in this time needs coordinated team work. To initiate a sufficiently complex hybrid collaboration with a great variety of coupling styles, strategies for creating awareness, and different patterns of device usage, we separated each team of four and distributed them across three rooms. Two of four participants were co-located in room 1. The others were seated in room 2 and 3 (see Figure 1 and Figure 3b). By this, we hoped to witness hybrid collaboration in a PDT including co-located as well as remote collaboration leading to synchronous and asynchronous work. 4.2
Prototype
For our user study we extended and rewrote great parts of an open source research prototype2 for web-based collaborative search and sensemaking by Rädle et al. [30]. The main functionality of the prototype is browsing and searching in the 238 VAST Contest information items. The search function returns news articles, maps, images, or spreadsheets that contain the query terms in their fulltext or metadata. By clicking or tapping an item, participants can access a detail view to read the document, highlight sections of the text, and leave comments or chat messages in this document 2 https://github.com/huddlelamp/doc-reader
(Sep 2017)
Proceedings of the ACM on Human-Computer Interaction, Vol. 2, No. CSCW, Article 128. Publication date: November 2018.
Domino: A Descriptive Framework for Hybrid Collaboration and Coupling Styles
128:11
for other team members. Furthermore, the prototype enables users to send relevant documents to other team members, and also to copy text snippets from a document to a virtual whiteboard shared by the entire group. To improve awareness and collaboration, users can see which documents have been read or liked by others and who has copied which snippets to the whiteboard. Inspired by [1], users also can spatially arrange the snippets on the whiteboard to enable clustering, sorting, or other forms of establishing meaningful spatial orders or incremental formalisms. 4.3
Study Setting & Apparatus
The web-based prototype was accessible from four iPad Air 2 tablets located in room 1, a Microsoft Surface Hub (84 inch) also located in room 1, and one desktop PC per room in rooms 2 and 3 (see Figure 1). By this, we hoped to better reflect the great variety of possible devices during real-world hybrid collaboration. In room 1, participants were seated at opposite sides of a table that contained the iPads. Next to the table was the Surface Hub. All of these devices were running the prototype. Additionally, there was a desktop PC opposite to the Surface Hub for audiovisual and chat communication between the rooms based on Skype. In room 2 and 3, participants were sitting with a headset in front of a desktop PC that ran the prototype and a Skype client in parallel (see Figure 3b). Skype was used to enable participants to communicate with remote team members using voice, video streams, and a keyboard-based chat. At any time, participants could connect to or disconnect from either one or two of the other rooms. All participants were also provided with pen and paper for notetaking. Four cameras were used to record participants’ actions and communication in the different rooms. In rooms 2 & 3 one camera recorded an over-the-shoulder shot of the participant seated at the desktop PC. In room 1, the two users at the table and the Surface Hub were captured using a top-down shot and an additional wide angle camera (see Figure 6).
Fig. 6. Example of a synchronized view of the collaboration from the four cameras.
To avoid distracting or influencing the participants, only the lead experimenter stayed with the participants in room 1. There was no experimenter in room 2 or 3. However, another experimenter was on standby in the hallway to provide participants with technical support when needed. In addition, there was also an observer room, from which two further experimenters could observe Proceedings of the ACM on Human-Computer Interaction, Vol. 2, No. CSCW, Article 128. Publication date: November 2018.
128:12
T. Neumayr et al.
room 1 using a unidirectional audiovisual Skype connection from the integrated camera of the Surface Hub. These additional observers never interacted with the participants and were also not present during all sessions. 4.4
Participants
We recruited 24 participants (10 female) for our user study, who were compensated for their time by entering a prize draw of gift coupons for an online retailer. The mean age of our participants was 28.9 years (SD=7.3, min=19, max=50). 19 participants had a university degree, the others were undergraduate students. The group included researchers, professors, and students from a variety of fields including medicine and software engineering. No participant had received a formal training in sensemaking before and all of them were unfamiliar with the Stegosaurus task and dataset. We did not aim at a controlled study with teams of equivalent skills or familiarity. Instead we manually assigned participants to teams and rooms for ideally creating the largest possible variety of observable collaboration behaviors among the teams. Therefore, the level of familiarity within the teams was very different for each team. For example, one of the teams had already worked together on a regular basis for several months whereas other teams had not met before at all. These different types of relationships between the participants had the desired effect of a great spectrum of different hybrid collaboration styles. We also tried to avoid team constellations that were likely to inhibit freely adopting different working styles, e.g., strong social hierarchies (we avoided mixing professors with their students) and family relationships (we alternated between co-locating and separating couples across rooms). 4.5
Procedure
After meeting in room 1, all participants received a brief introduction into the study and gave informed consent. Each participant was handed printed instructions with a task description and a brief scenario description. Following a short demonstration of the prototype’s functionality (up to ten minutes), all participants were pointed towards a particular news article as a common starting point for their research. Then two of the participants were taken to the other rooms and the teams began their task. Participants had 75 minutes to solve the task. This duration was based on earlier Stegosaurus studies (e.g. [18, 19]) that typically lasted 90 minutes and were also focused on observing how the collaboration unfolds rather than getting a detailed solution for the task. For this reason, we also did not enforce a hard time limit. Nonetheless, experimenters did not provide help for the solution of the task itself and participants could ask only for technical support, e.g., with setting up the Skype conference as desired. At the end of the session, each participant was asked to remain seated to complete a questionnaire about the found conspiracy before talking to other team members. Then all participants met again in room 1 where the lead experimenter used a set of pre-defined, team-independent questions to begin a semi-structured group discussion that was videotaped and transcribed for later qualitative analysis. These questions were also mixed with team-specific questions that were based on the lead experimenter’s own observations during the session and on team-specific suggestions from the other experimenters. These suggestions were transmitted to the lead experimenter during the discussion using instant messaging. The group discussion was aimed at clarifying and consolidating our first impressions and interpretations during the observation by asking participants about their perceptions and intentions. For example, we asked why some of the participants worked together more closely than others or why they worked with a certain device in a specific way. To conclude the session, the lead experimenter debriefed the team by sharing the solution of the task. Proceedings of the ACM on Human-Computer Interaction, Vol. 2, No. CSCW, Article 128. Publication date: November 2018.
Domino: A Descriptive Framework for Hybrid Collaboration and Coupling Styles 4.6
128:13
Data Analysis
We used multiple parallel data sources to identify as many relevant patterns or behaviors as possible, e.g., different coupling styles, usage of workspaces, strategies for creating awareness. Our main source of information was the audio and video data gathered by the four cameras during the sessions and the recording of the concluding interviews with another camera in room 1. Additionally, our prototype application provided us with detailed log files of all relevant interactions. At the end of each session, participants also completed a questionnaire with questions about the task’s solution. 4.6.1 Video Data. In order to establish meaningful relationships between observable interactions, gestures, facial expressions, and verbal communication, the video material from the four cameras was merged and synchronized for each session, so that all recordings played in sync to facilitate analysis (Figure 6). The entirety of the synchronized video files (11.5 hours) was manually analyzed and coded to create a digital transcript that contains for each point in time how many participants were engaged in the collaboration in which subgroup, how many subgroups were active in parallel, and which coupling styles were in place. Furthermore, all other relevant observations about the collaboration were noted, e.g., which topic was currently discussed by the participants, or if participants were talking to the experimenters. In accordance with standard practices of coding in qualitative research [32], we decided for solo coding, i.e., a single researcher performed the entire coding to ensure consistency throughout the different sessions. However, as suggested by Saldaña [32], a core team of three researchers regularly met to discuss possible ambiguities and to review the resulting coding scheme and coding results. At the beginning of the coding process, we used the coupling styles and coding scheme from Isenberg et al. [18] as a starting point, although their definitions were created for only two colocated persons and not for PDTs. We were aware that we would therefore need to iteratively refine the coding scheme until all situations could be categorized according to the scheme and we hence felt it was saturated. We thus followed a coding process that was similar to that of Isenberg et al., who used Tang et al.’s set of codes to be refined through a two-pass coding done by one researcher. To rule out biases by the coding researcher, our changes and additions to Isenberg et al.’s coding scheme were regularly discussed at great detail among at least three researchers of our team. We only included coupling styles that lasted at least five seconds to focus on meaningful interactions between collaborators and not on transitional states between coupling styles. The result is shown below. 1.0 Subgroups: To analyze which participants belonged to which subgroup, we coded both the 1.1 emergence and 1.2 termination of subgroups in connection with a 4-digit binary number that specifies which participants were part of this subgroup. For example, 1011 means that participants 1, 3, and 4 were part of the subgroup. 2.0 Coupling Styles: Codes 2.1 to 2.9 specified the currently active coupling style for a subgroup. Our final set of coupling styles after multiple iterations is described in section 5.4. 3.0 Spatial Distribution: These codes indicated if a subgroup was only 3.1 co-located, only 3.2 remote or a 3.3 mixture of both, i.e., partially distributed. 4.0 Miscellaneous: Miscellaneous information regarding the 4.1 task itself or 4.2 other interesting information (e.g. the reason why a person became disengaged) was coded together with an open text field for further explanations. 4.6.2 Application Logs. Application logs were mainly used for clarifying unclear events that could not be analyzed from the video recording alone. Each log entry contained a timestamp, an ID of the device the log entry originated from, the type of the action performed, the ID of the involved Proceedings of the ACM on Human-Computer Interaction, Vol. 2, No. CSCW, Article 128. Publication date: November 2018.
128:14
T. Neumayr et al.
document, and some additional fields to account for event-specific details, e.g. x and y coordinates of dragged items, IDs of source and destination devices when sharing items, or the number of search results. 4.6.3 Plot Questionnaire. Directly after the task, but before returning to room 1 for the concluding group discussion, participants were asked to complete a plot questionnaire. It contained nine multiple-choice questions about the solution of the task, i.e., about persons or events linked to the identified plot. For each correctly answered question, a point was awarded, so that results ranged from 0 to 9 points. 4.6.4 Group Discussion & Observer Notes. Each session was concluded by the above mentioned semi-structured interview and group discussion that lasted up to 20 minutes. For data analysis, all statements during these interviews were transcribed and scanned for relevant quotes that confirmed or contradicted our findings. 5
STUDY RESULTS & DOMINO’S ANALYTICAL TOOLS
In the following, we first report descriptive statistics and our general impressions about the nature and success of the observed collaboration to confirm the credibility of our simulated setting. Second, we present and demonstrate three analytical tools based on Domino that researchers can make use of when analyzing a hybrid collaboration scenario. Thereby, these sections describe three example applications of our different tools for quantifying team volatility and fragmentation, obtaining an overview with the Domino notation to explore collaboration patterns, and dive into their details with our extended set of hybrid coupling styles. 5.1
General Nature of Observed Collaboration
To give an insight into how the teams worked and how successful and credible their hybrid collaboration during our simulation was, we first report some descriptive statistics about task times and group results. This is intended to confirm that the observed collaboration was in principle successful and that the observed collaborative practices were meaningful enough to be used to verify and extend our framework. Task Time: For each session, we aimed at a duration of 75 minutes but let users decide when to stop after giving them an early warning about the remaining time after 60 minutes. The mean
(a) Number and means of correctly answered questions from plot questionnaire.
(b) TNS for each team and mean TNS for all teams (left axis). Number of team configurations per session (right axis).
Fig. 7. Team results from the plot questionnaire (a) and TNS scores (b). Proceedings of the ACM on Human-Computer Interaction, Vol. 2, No. CSCW, Article 128. Publication date: November 2018.
Domino: A Descriptive Framework for Hybrid Collaboration and Coupling Styles
128:15
task time for all teams was 74.45 minutes (SD=2.4, min=70.8, max=78.1) and no team left early or terminated their task. Task Results: Figure 7a shows the results of each team member and each team in terms of correctly answered questions about the task’s solution. There were notable differences in the knowledge about the looming plot between the teams but also within the teams. For example, team 1 showed almost no differences in individual knowledge between members. The high team mean of 5.75 (SD=0.43, min=5, max=6) hints at an efficient and close collaboration. Team 2 was also comparably successful with a mean of 4.75 (SD=2.38, min=2, max=8) but their success was based on person 2 in room 1 and person 3 in room 2 while the others did not contribute as much to the solution as their team members. Team 4 was the least successful team with a low mean and a wide variation of knowledge (mean=2.5, SD=1.12, min=1, max=4) and also with the lowest score any team member achieved during the entire study. These scores of team 4 could hint at a too loose and uncoordinated collaboration. Below we discuss how this can be analyzed further using our framework’s analytical tools. Collaboration Location: Since we use our study results to extend our proposed Domino framework, we first need to verify if there really was hybrid collaboration in place. Did the collaboration transition between “same place”, “partially distributed”, and “different place” [8, 22]? Did teams really form subgroups that worked, for example, tightly coupled but are partially distributed? Our analysis with the Dominoes notation revealed that 14.8% of the collaboration time was spent working only with collocateds, 27.1% exclusively with remotes, and 58.1% inside of partially distributed subgroups. We therefore conclude that our simulation of hybrid collaboration was successful in terms of the space dimension. Collaboration Time: A further question to ask is if the collaboration was also hybrid in terms of the “same time” vs. “different time” dimension. Were there transitions between synchronous and asynchronous collaboration? We observed a clear preference for synchronous verbal conversation over any asynchronous form of collaboration. For example, compared to the amount of verbal communication, the provided functionality for asynchronous written communication was rarely used at all (in total 30 messages in Skype, 11 chat messages in document chats, 29 edits of document comments). However, the lower-effort interactions were used more frequently for asynchronous collaboration, e.g., (un)liking documents (102 events), relocating snippets on the shared whiteboard (94 events). A potential explanation for this is the time restriction for the task. Since groups were asked to complete their task within 75 minutes and not over several hours or days, a strong tendency towards synchronous verbal communication and comparably quick asynchronous manipulations seems only logical. Nonetheless, the overall number of 266 asynchronous interactions (i.e. on average 44 per team), lets us still conclude that our simulation of hybrid collaboration was also successful in terms of the time dimension and that there were phases of synchronous and asynchronous collaboration. Future work could aim at observing collaborations over longer periods of time (e.g. several hours or days) to better observe the role of asynchronous collaboration in the absence of time pressure. 5.2
Analytical Tool 1: Quantifying Team Volatility and Fragmentation
A team’s collaboration style is strongly characterized by how often they adopt different configurations (i.e. how often they change the members and number of the team’s subgroups), how long a configuration typically lasts (i.e. the mean duration of a configuration), and how many subgroups are typically active in parallel. Therefore our framework introduces quantitative measures for such team volatility and team fragmentation to support analysis. Team volatility: After analyzing a PDT session using the Domino notation (see Figure 4), a first step is to count the number of different configurations (i.e. Dominoes). In our study, each team Proceedings of the ACM on Human-Computer Interaction, Vol. 2, No. CSCW, Article 128. Publication date: November 2018.
128:16
T. Neumayr et al.
session lasted around 75 minutes but there were great variations ranging from 50 configurations for team 2 to 123 configurations for team 6 (see Figure 7b, right axis). Accordingly, the mean duration of a configuration for team 2 was 86.9 seconds compared to 37.3 seconds for team 6. The great quantitative differences hint at the variety of working styles that we could observe in our study and also that more team volatility did not necessarily yield better results. For example, team 6 scored below average despite changing their configurations more than twice as often as team 2. Team fragmentation: For further analysis, we also developed a measure for team fragmentation called the Time-weighted Mean Number of Concurrent Subgroups (TNS). The formula for TNS is given below (see Equation 1) where n is the number of logged changes in the team’s total number of subgroups, si is the current number of subgroups, ti+1 − ti is the duration for which this number of subgroups existed, and tn − t 0 is the total duration of the session. T NS =
n−1 Õ si · (ti+1 − ti ) (tn − t 0 ) i=0
(1)
A high value for TNS indicates that, on average, a team was divided into more concurrent subgroups over time than a team with a lower TNS. For example, since we had four participants in our study, the theoretical extreme values for TNS were between 1.0 (all team members worked in one subgroup of size 4 for the entire session) and 4.0 (all team members worked individually as four subgroups of size 1 for the entire session). A high TNS value can be the result of a more coordinated distribution of tasks among team members but could also mean that there was an involuntary fragmentation of the team into many subgroups without coordination. A low TNS value hints at a closer collaboration and stronger cohesion within larger subgroups but could also hint at the absence of efficient coordination and distribution of tasks. Figure 7b shows exemplary calculations of the TNS for the teams in our study. It becomes obvious that teams differed in the number of simultaneous subgroups, e.g., team 4 whose collaboration was typically fragmented into three or more subgroups compared to team 3 who typically worked with slightly less than two subgroups. We believe that using both measures for team volatility and team fragmentation can support an initial quantitative assessment of collaboration styles. However, they should not be interpreted as either “good” or “bad”. To better understand the motives and results of team configuration changes and the roles of different team members, a tool for a more detailed analysis is necessary. 5.3
Analytical Tool 2: Getting a Visual Overview with the Domino Notation
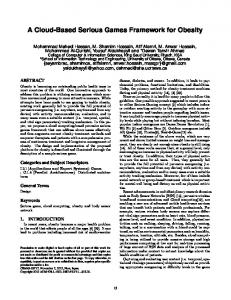
As shown in Figure 4, it is possible to plot all consecutive Dominoes of a particular collaboration session along with the timespan each configuration was active. This overview of the entirety of Dominoes from a single session visualizes a number of collaboration characteristics and can be useful when trying to explain phenomena that show, for example, in team results or TNS scores. There are several visual features in such a plot that are particularly relevant: DISC 37.1%
VE
SV SIDC SIDD Tightly coupled 1.2% 0.4% 3.7% 3.2% 48.9%
(a) Example 1: The top 5 of group configurations during our study and their percentage of total session time.
SSP 3.3%
SGP DP D Loosely coupled 10.8% 39.2% 1.1% 51.1%
(b) Example 2: Distribution of the percentage of personminutes spent in different coupling styles during all sessions.
Fig. 8. Two examples for using the Domino framework for an overview of all collaboration sessions. Proceedings of the ACM on Human-Computer Interaction, Vol. 2, No. CSCW, Article 128. Publication date: November 2018.
Domino: A Descriptive Framework for Hybrid Collaboration and Coupling Styles
128:17
• Location of the collaborators: Does a subgroup consist only of co-locateds, only remotes, or is it a PDT? Remote collaboration or PDTs become visible whenever a colored line crosses a black line. • Closeness of the collaboration: Are there more blue (i.e. loose) or red (i.e. close) connections? • Centrality of collaborators: Are there visual indicators for a specific role of individual members that call for a closer investigation? For example, in Figure 4, P2 is part of a subgroup in 42 of 50 configurations. This hints at P2’s potential role as a manager or facilitator of the collaboration. This role is also confirmed by P2’s high score in Figure 7a. • Team fragmentation and volatility: Are team members typically connected or unconnected? Are there visible subgroups that are connected more frequently than others? How many different configurations were used during a session? • Addition or loss of collaborators: Do dots appear or disappear? Missing dots can potentially indicate that there were technical problems or that a team member left. These visual features can be used for an exemplary analysis and discussion of single sessions. For example, in the case of team 2, P2 and P3 had high scores in the plot questionnaire (8 and 6 correct answers), while P1 and P4 were much less successful (3 and 2 correct answers). A potential explanation is the close collaboration between P2 and P3 that shows in Figure 4. P2 and P3 were collaborating in 27 of 50 team configurations of which 26 were close collaboration (i.e. red). Figure 4 also reveals a potential reason for P4’s lowest score in the team. P4 was only connected to other collaborators in 6 of 50 team configurations and therefore essentially absent from the team. Moreover, the last collaboration between P4 and anyone else happened in configuration #25 of 50 and approximately 36 minutes before the session ended. After that, there was no further exchange with the rest of the team about the results. In addition to the possibility to analyze the Dominoes of one session alone, comparisons of all the Dominoes from all teams can also reveal potentially interesting patterns. For example, Figure 8a gives a visual overview of the five most popular group configurations from our study, that in sum amounted to 57.04% of the total session time. In that example, individual work of all team members without coupling was most frequent (21.26%). The second most frequent configuration was tightly coupled discussion of all team members, including co-located and non-co-located collaborators (19.18%). 5.4
Analytical Tool 3: Hybrid Coupling Styles
Based on our detailed video analysis, we propose a revised set of nine coupling styles (see Figure 9) that, apart from the concept of hybrid collaboration itself and the visual Domino notation from above, is a key part of the Domino framework. The key difference between our set and previous sets of coupling styles (e.g. [18, 36, 38]) is that it can precisely describe hybrid collaboration scenarios in which an arbitrary number of co-located and remote collaborators work together (including PDTs). To achieve this, we found it necessary to replace Isenberg et al.’s SIDV with two new styles (SIDC, SIDD) that also take into account that hybrid collaboration on an information item can happen on different devices and at different locations and that this collaboration can also have different levels of closeness and coordination (see Figure 10). In the following, we explain how we arrived at this new set of hybrid coupling styles. We based our initial set of coupling styles on Isenberg et al.’s set for co-located collaboration of pairs [18]. We then iteratively refined the set and definitions until we could categorize all situations encountered during the study according to that scheme. The resulting coupling styles are described in Figure 9 (text in italics shows alterations compared to the initial set from [18]). From these Proceedings of the ACM on Human-Computer Interaction, Vol. 2, No. CSCW, Article 128. Publication date: November 2018.
128:18
T. Neumayr et al.
coupling styles, DISC, VE, SV, SIDC, SIDD, and SSP count as “tightly coupled” and are therefore red in the Domino notation (see Figure 3a). SGP, DP, and D count as “loosely coupled”. SGP is therefore shown in blue. DP is not visualized with a connection in the Domino notation and leaves the collaborators’ dots unconnected. For D, the users’ dots are not shown at all in the notation. All coupling styles except VE and SV can be applied to co-located as well as remote collaboration including PDTs. However, VE and SV are inherently only possible when collaborators are co-located (see Figure 9). We iteratively developed this extended set of coupling styles during the coding process of the video data. For most of the existing coupling styles [18, 36, 38] comparably small alterations to their initial formulation were sufficient to transfer them into the domain of hybrid collaboration. However, we also needed to introduce two new coupling styles SIDC and SIDD based on Isenberg et al.’s SIDV (“Sharing of the same information but using different views”) [18] (see Figure 10). This addition was necessary because the original SIDV and its neighbor SV both did not sufficiently capture the coupling we observed: First, sharing of the same view (SV) – in a stricter sense – means that two (or in our case two or more) persons must view the same physical view, thing, or artifact which is technically not possible for remotes. Second, Isenberg et al.’s SIDV i) does not include active coordination between the participants about what aspects, parts, or areas of an artifact are currently under examination, and therefore ii) could potentially occur randomly (e.g., if two
DISC
Active discussion between two or more persons about the data or task. Limited system interaction (e.g., pointing to items or scrolling in documents).
C&R
VE
View engaged. One person is actively working, other person(s) watch and engage in conversation and comment on the observed activities, but are not interacting with the system.
C
SV
Sharing of the same view of an information item. Users look at the same physical display that shows the information.
C
(*newly derived from SIDV) Sharing of the same information but using different physical displays for coordinated exploration. Users view the same information item SIDC* but use different displays for coordinated exploration, e.g., they view the same spreadsheet on different displays to collaboratively identify trends or patterns and are therefore engaged in some conversation. (*newly derived from SIDV) Sharing of the same information but using different SIDD* physical displays. Users view the same information item but use different devices and are not engaged in active conversation. Work is shared to solve the same specific problem. Users read different information SSP items from a shared set. For example, users issued a search for “injured driver” and then divided the results so each person reads only a part of the documents. Work on the same general problem but from different starting points. E.g., all users SGP search for information on a collision but start from different searches (e.g. “accident” & “obituaries”) and consider different sets of documents. DP
Work on different problems, and hence different aspects of the task. For example, one person is interested in the injured driver, another searches for events around the missile silo, and a third views the obituaries of a specific date.
D
Disengaged. A person watches passively or is fully disengaged from the task and, in a strict sense, is not coupled to the subgroup anymore.
C&R
C&R
C&R
C&R
C&R
C&R
Fig. 9. Our proposed set of hybrid coupling styles. Italics highlight changes and extensions to previous sets. C & R indicates if styles can applied to (C)ollocateds and/or (R)emotes. Proceedings of the ACM on Human-Computer Interaction, Vol. 2, No. CSCW, Article 128. Publication date: November 2018.
Domino: A Descriptive Framework for Hybrid Collaboration and Coupling Styles
128:19
participants just happen to view or read the same document on two different devices at the same time without prior coordination). Therefore, we distinguish between coupling styles with lower and higher levels of information sharing for coordination. We believe that this differentiation resonates with Isenberg et al.’s comment that the coupling styles between users influence “how much information was shared among them” [17]. SIDC is a “high information sharing” variant of SIDV and accordingly more similar to SV in this regard. SIDD, however, is a “low information sharing” variant of SIDV with low or without coordination including accidental sharing of views. An example of SIDC is a PDT looking at a shared clipboard using different physical displays while coordinating which parts are currently of interest (Figure 10a). Hence it is necessary to create a shared understanding and awareness between the different locations, either by digitally-mediated verbal communication or system-immanent features (e.g., real-time highlighting or moving of virtual objects). An example of SIDD is a PDT that just happens to look at the same map without prior coordination and therefore examining different areas and questions (Figure 10b). This new framework of coupling styles can be used to compare how teams differ in working styles and to hypothesize how these differences lead to different team results. For example, an assumption could be that the difference between our most successful team 1 and the least successful team 4 in our study stems from a too loosely coupled working style with insufficient coordination of the subgroups. However, both teams spent less than the overall mean of 48.9% of their person-minutes (see Figure 8b) in tight coupling styles (team 1 46.3%, team 4 35.2%). Therefore the difference in their mean scores should not be simply attributed to a too loosely coupled working style. However, the most successful teams 1 and 2 were also the teams with the lowest TNS of 2.2 and 2.3 whereas
(a) SIDC: Sharing of the same information but using different physical displays for coordinated exploration. This is a coordinated collaborative activity.
(b) SIDD: Sharing of the same information but using different physical displays. This is uncoordinated and can also happen by accident. Fig. 10. Coupling styles SIDC (top) and SIDD (bottom). Proceedings of the ACM on Human-Computer Interaction, Vol. 2, No. CSCW, Article 128. Publication date: November 2018.
128:20
T. Neumayr et al.
team 4 had the highest TNS of 3.1 which hints at the potential problem of overpartitioning the team in too many and too small subgroups. This example illustrates how our framework could potentially aid larger studies and analyses of hybrid collaboration in the future. Our analysis of coupling styles can also be used to optimize the design of collaborative systems. For example, if studying a specific collaborative scenario reveals that a coupling style is frequently used, it is likely that a better technological support for this coupling would pay off in terms of collaboration efficiency. For example, SIDC was the second most frequent coupling style for tight collaboration after DISC in our study (Figure 9). As we discuss below in the context of awareness, SIDC can be technologically supported by introducing new functionality that enables users to better coordinate their visual attention, e.g., shared mouse cursors or other tools for visually highlighting regions of interest (see section 6.2). It could therefore be helpful to integrate such functionality in future systems to support users in the observed or similar collaborative scenarios. We also believe that future studies with the Domino framework can help to further extend and refine the list of coupling styles from Figure 9. We are certain that other applications and collaboration scenarios will reveal a wealth of yet undocumented coupling styles and therefore encourage researchers to use our framework as a basis for future work. With a growing number of coupling styles, it will also be of great importance to support transitions between them. As we have discussed in related work (see section 2) supporting these transitions is generally considered very important. The great number of transitions that we observed during our study (between 50 and 123 per team) further confirms this importance. 6
DESIGN CONSIDERATIONS FOR HYBRID COLLABORATION SYSTEMS
This section describes insights about working styles, territoriality, and awareness from our observation of simulated hybrid collaboration that also tie in with previous and related work (see sections 1 and 2). They can help to inform the design of future hybrid collaboration systems. These insights are grounded in our group interviews’ transcripts and observations and draw on the different coupling styles we identified. They should not be considered as generalizable findings about the “true nature” of hybrid collaboration but as pointers towards future design opportunities. 6.1
Territoriality in Hybrid Collaboration
Interestingly, some concepts specific to co-located tabletop collaboration (e.g. territoriality [35]) also reappeared in new forms in hybrid collaboration. For example, we observed that specific coupling styles were connected to specific kinds of territories or vice versa. For example, the tablets and desktop PCs typically served as personal territories for active search, exploration, and experimentation by individuals and were therefore used during phases of DP, SGP, or SSP coupling. Only after relevant pieces of information were found, were they transferred to group territories for discussion or review using shared physical or virtual views during phases of VE, SV, SIDC, SIDD. Thereby the shared whiteboard was typically used as storage territory to collect selected pieces of information and was then temporarily used as group territory when teams reviewed their overall progress or tried to get an overview of their collected information during phases of DISC. Further research on this mapping between coupling styles and device form factors could help to inform the design of future collaboration tools. Such research could examine preliminary design implications from our study, for example "When many information objects need to be collected by different team members (DP, SGP) over time and then have to be clustered and discussed (VE, DISC), the system should provide personal territories such as laptops or PCs and a shared device like a Microsoft Surface Hub with a large high-resolution screen as storage territory during DP or SGP and as group territory during VE or DISC". Proceedings of the ACM on Human-Computer Interaction, Vol. 2, No. CSCW, Article 128. Publication date: November 2018.
Domino: A Descriptive Framework for Hybrid Collaboration and Coupling Styles
128:21
Furthermore, during hybrid collaboration, concepts similar to territoriality were also transferred into the auditory space. By this we mean that users created personal audio territories during hybrid collaboration to temporarily disconnect from the shared group audio territories. During collaboration, all groups engaged in these shared group audio territories that did not only include the local audio environment but also that of connected remote rooms mediated via microphones and loudspeakers. However, there were notable exceptions. For example, P4 of team 2 preferred to disconnect from this group audio because she found the team’s communication and background noises distracting and exhausting. P1 of team 6 commented that he found listening to the constant audio connection that his team established between rooms stressful. In the opposite direction, some participants tried to hide their local communication from the ears of remote team members by turning away from microphones. That was for example the case for P1 and P2 of team 5, a married couple co-located in room 1 who preferred to discuss provisional findings about the task in private before sharing them with all. We therefore believe that further research on flexible and seamless transitions between personal and group audio territories is essential for the design of future hybrid collaboration tools. 6.2
Awareness in Hybrid Collaboration
To our own surprise, and different from our first trial run during a pre-test, participants almost exclusively relied on the communication via Skype for creating team and workspace awareness. Five of the six teams left the Skype connection open between all rooms at all times, although we had demonstrated to them how they could selectively establish or close connections to other rooms. In practice, it was primarily the audio channel that dominated communication. For example, P4 of team 6 seated in room 3 muted her microphone but left her headphones on to stay informed about the team’s progress in other rooms. P3 of team 2 in room 2 stated that if it wasn’t for the communication over the audio channel, he would not know what was going on. P2 of team 5 valued verbal communication as “effective” and commented “interjections like ‘hey, I found something’ reunited the three different rooms to one room, basically”. However, this dependence on audio also had disadvantages for some participants. As mentioned above, two participants complained about being distracted and stressed by the constant audio feed which ultimately led P4 of team 2 to disconnect from the rest of her team, “because I needed to read and so I couldn’t focus on it”. This disconnection which is also clearly visible in Figure 4 had great implications for the team’s awareness and also social dynamics: The rest of the team grew increasingly irritated because when new insights were gained, they could not be discussed with her. In consequence, there were also conflicts about the use of the shared whiteboard, where the two disconnected parties competed for their preferred arrangements and eventually snippets placed by P4 were even deleted by P3. Participants also invented creative ways to establish workspace awareness. For example, during the coupling style SIDC, P3 of team 1 in room 2 used the mouse to wiggle a snippet on the shared whiteboard to draw the remote collaborators’ attention to it. This was done in addition to a verbal statement (“look at this one”). This was an unanticipated use of the functionality, since originally the movement of snippets was intended only for arranging or clustering results. Like shared mouse cursors, which we did not use in our prototype, such functionality is especially relevant during tight coupling styles such as DISC, VE, SV, and SIDC, particularly when remote collaborators are involved. However, when there are many different workspaces like in our prototype (e.g. the whiteboard, document chat messages and comments, Skype) there might be further means necessary to achieve awareness of the different workspaces. Based on our study, we conclude that computational support for awareness becomes particularly important in PDTs engaging in hybrid collaboration, even more than in the purely co-located or remote scenarios documented in previous CSCW literature, e.g., [13, 14, 18, 36]. Proceedings of the ACM on Human-Computer Interaction, Vol. 2, No. CSCW, Article 128. Publication date: November 2018.
128:22 7
T. Neumayr et al.
CONCLUSION
In this paper, we presented the new descriptive framework Domino that enables CSCW and HCI researchers to describe and analyze hybrid collaboration. Based on initial informal observations at industry partners, we describe hybrid collaboration as a collaborative practice that PDTs can engage in, whose emergent structures cannot be sufficiently described with existing frameworks. Therefore, we developed the Domino visual notation to enable an overview and analysis of team configurations and subgroups over time. We also provided measures to quantify team volatility and fragmentation. Furthermore, we conducted a user study to simulate a complex sensemaking task in a hybrid collaboration setting to extend and revise existing frameworks for coupling styles, so that they can be applied on PDTs of arbitrary sizes. We demonstrated how Domino can be applied in research and conclude with a discussion of important design consideration for future hybrid collaboration systems. ACKNOWLEDGMENTS This work was supported by the government of Upper Austria as part of the “Basisfinanzierung” funding initiative by the University of Applied Sciences Upper Austria, project title: “SCOLA Smart Collaboration for Industrial Applications”. This research was also supported by the Austrian Research Promotion Agency (FFG) as part of the COIN capacity building project “USIVIS - User Centered Interactive Visualization for Big Data”. REFERENCES [1] Christopher Andrews, Alex Endert, and Chris North. 2010. Space to think: large high-resolution displays for sensemaking. In Proceedings of the SIGCHI conference on human factors in computing systems. ACM, 55–64. [2] Kevin Baker, Saul Greenberg, and Carl Gutwin. 2002. Empirical Development of a Heuristic Evaluation Methodology for Shared Workspace Groupware. In Proceedings of the 2002 ACM Conference on Computer Supported Cooperative Work (CSCW ’02). ACM, New York, NY, USA, 96–105. [3] Uwe M. Borghoff and Johann H. Schlichter. 2000. Computer-Supported Cooperative Work. Introduction to Distributed Applications. Springer Berlin-Heidelberg. [4] Nathan Bos, Judith Olson, Arik Cheshin, Yong-Suk Kim, Ning Nan, and N Sadat Shami. 2005. Traveling blues: The effect of relocation on partially distributed teams. In CHI’05 Extended Abstracts on Human Factors in Computing Systems. ACM, 1917–1920. [5] Nathan Bos, Judith Olson, Ning Nan, N Sadat Shami, Susannah Hoch, and Erik Johnston. 2006. Collocation blindness in partially distributed groups: is there a downside to being collocated?. In Proceedings of the SIGCHI conference on Human Factors in Computing Systems. ACM, 1313–1321. [6] Nathan D Bos, Ayse Buyuktur, Judith S Olson, Gary M Olson, and Amy Voida. 2010. Shared identity helps partially distributed teams, but distance still matters. In Proceedings of the 16th ACM international conference on Supporting group work. ACM, 89–96. [7] Frederik Brudy, Joshua Kevin Budiman, Steven Houben, and Nicolai Marquardt. 2018. Investigating the Role of an Overview Device in Multi-Device Collaboration. In Proceedings of the 2018 CHI Conference on Human Factors in Computing Systems. ACM, 300. [8] Kelly Burke, Kregg Aytes, Laku Chidambaram, and Jeffrey J Johnson. 1999. A study of partially distributed work groups: The impact of media, location, and time on perceptions and performance. Small Group Research 30, 4 (1999), 453–490. [9] Arik Cheshin, Yongsuk Kim, D Bos Nathan, Nan Ning, and Judith S Olson. 2013. Emergence of differing electronic communication norms within partially distributed teams. Journal of Personnel Psychology 12, 1 (2013), 7. [10] Tim Coughlan, Trevor D. Collins, Anne Adams, Yvonne Rogers, Pablo A. Haya, and Estefanía Martín. 2012. The Conceptual Framing, Design and Evaluation of Device Ecologies for Collaborative Activities. Int. J. Hum.-Comput. Stud. 70, 10 (Oct. 2012), 765–779. [11] Georges Grinstein, Theresa O’Connell, Sharon Laskowski, Catherine Plaisant, Jean Scholtz, and Mark Whiting. 2006. Vast 2006 contest-a tale of alderwood. In Visual Analytics Science And Technology, 2006 IEEE Symposium On. IEEE, 215–216. [12] Jonathan Grudin. 1994. Computer-Supported Cooperative Work: History and Focus. Computer 27, 5 (1994). Proceedings of the ACM on Human-Computer Interaction, Vol. 2, No. CSCW, Article 128. Publication date: November 2018.
Domino: A Descriptive Framework for Hybrid Collaboration and Coupling Styles
128:23
[13] Carl Gutwin and Saul Greenberg. 1998. Design for Individuals, Design for Groups: Tradeoffs Between Power and Workspace Awareness. In Proceedings of the 1998 ACM Conference on Computer Supported Cooperative Work (CSCW ’98). ACM, New York, NY, USA, 207–216. [14] Carl Gutwin and Saul Greenberg. 2002. A Descriptive Framework of Workspace Awareness for Real-Time Groupware. Comput. Supported Coop. Work 11, 3 (Nov. 2002), 411–446. [15] Peter Hamilton and Daniel J Wigdor. 2014. Conductor: enabling and understanding cross-device interaction. In Proceedings of the 32nd annual ACM conference on Human factors in computing systems. ACM, 2773–2782. [16] Danny Holten. 2006. Hierarchical edge bundles: Visualization of adjacency relations in hierarchical data. IEEE Transactions on visualization and computer graphics 12, 5 (2006), 741–748. [17] Petra Isenberg, Danyel Fisher, Meredith Ringel Morris, Kori Inkpen, and Mary Czerwinski. 2010. An Exploratory Study of Co-Located Collaborative Visual Analytics Around a Tabletop Display. In Proc. VAST ’10. Salt Lake City, Utah, USA. [18] Petra Isenberg, Danyel Fisher, Sharoda A. Paul, Meredith Ringel Morris, Kori Inkpen, and Mary Czerwinski. 2012. Co-Located Collaborative Visual Analytics around a Tabletop Display. IEEE Trans. Vis. Comput. Graph. 18, 5 (2012), 689–702. [19] Mikkel R Jakobsen and Kasper Hornbæk. 2014. Up close and personal: Collaborative work on a high-resolution multitouch wall display. ACM Transactions on Computer-Human Interaction (TOCHI) 21, 2 (2014), 11. [20] Hans-Christian Jetter, Jens Gerken, Michael Zöllner, Harald Reiterer, and Natasa Milic-Frayling. 2011. Materializing the Query with Facet-streams: A Hybrid Surface for Collaborative Search on Tabletops. In Proceedings of the SIGCHI Conference on Human Factors in Computing Systems (CHI ’11). ACM, New York, NY, USA, 3013–3022. [21] Hans-Christian Jetter, Michael Zöllner, Jens Gerken, and Harald Reiterer. 2012. Design and Implementation of PostWIMP Distributed User Interfaces with ZOIL. International Journal of Human-Computer Interaction 28, 11 (2012), 737–747. [22] Robert Johansen. 1988. GroupWare: Computer Support for Business Teams. The Free Press, New York, NY, USA. xviii, 205 pages. [23] Robert E. Kraut, Susan R. Fussell, Susan E. Brennan, and Jane Siegel. 2002. Understanding Effects of Proximity on Collaboration: Implications for Technologies to Support Remote Collaborative Work. In Distributed Work, Pamela J. Hinds and Sara Kiesler (Eds.). The MIT Press. [24] Charlotte P. Lee and Drew Paine. 2015. From the Matrix to a Model of Coordinated action (MoCA): A Conceptual Framework of and for CSCW. In Proceedings of the 18th ACM Conference on Computer-Supported Cooperative Work and Social Computing. [25] Andrés Lucero, Jussi Holopainen, and Tero Jokela. 2011. Pass-them-around: Collaborative Use of Mobile Phones for Photo Sharing. In Proceedings of the SIGCHI Conference on Human Factors in Computing Systems (CHI ’11). ACM, New York, NY, USA, 1787–1796. [26] Andrés Lucero, Matt Jones, Tero Jokela, and Simon Robinson. 2013. Mobile Collocated Interactions: Taking an Offline Break Together. interactions 20, 2 (March 2013), 26–32. [27] Andrés Lucero, Jaakko Keränen, and Hannu Korhonen. 2010. Collaborative Use of Mobile Phones for Brainstorming. In Proceedings of the 12th International Conference on Human Computer Interaction with Mobile Devices and Services (MobileHCI ’10). ACM, New York, NY, USA, 337–340. [28] Kenton O’Hara, Jesper Kjeldskov, and Jeni Paay. 2011. Blended Interaction Spaces for Distributed Team Collaboration. ACM Transactions on Computer-Human Interaction 18, 1 (2011). [29] Thomas Plank, Hans-Christian Jetter, Roman Rädle, Clemens N. Klokmose, Thomas Luger, and Harald Reiterer. 2017. Is Two Enough?: ! Studying Benefits, Barriers, and Biases of Multi-Tablet Use for Collaborative Visualization. In Proceedings of the 2017 CHI Conference on Human Factors in Computing Systems (CHI ’17). ACM, New York, NY, USA, 4548–4560. [30] Roman Rädle, Hans-Christian Jetter, Nicolai Marquardt, Harald Reiterer, and Yvonne Rogers. 2014. HuddleLamp: Spatially-Aware Mobile Displays for Ad-hoc Around-the-Table Collaboration. In Proceedings of the Ninth ACM International Conference on Interactive Tabletops and Surfaces (ITS ’14). ACM, New York, NY, USA, 45–54. [31] Yvonne Rogers and Sian Lindley. 2004. Collaborating around vertical and horizontal large interactive displays: which way is best? Interacting with Computers 16, 6 (Dec. 2004), 1133–1152. [32] Johnny Saldaña. 2015. The coding manual for qualitative researchers. Sage. [33] Tony Salvador, Jean Scholtz, and James Larson. 1996. The Denver Model for Groupware Design. ACM SIGCHI Bulletin 28, 1 (1996). [34] Kjeld Schmidt and Rom Rodden. 1996. Putting it all together: Requirements for a CSCW Platform. In The Design of Computer-Supported Cooperative Work and Groupware Systems, Dan Shapiro, Michael Tauber, and Roland Traunmüller (Eds.). North Holland Elsevier, Chapter 11, 157–176. [35] Stacey D. Scott, M. Sheelagh T. Carpendale, and Kori M. Inkpen. 2004. Territoriality in Collaborative Tabletop Workspaces. In Proceedings of the 2004 ACM Conference on Computer Supported Cooperative Work (CSCW ’04). ACM,
Proceedings of the ACM on Human-Computer Interaction, Vol. 2, No. CSCW, Article 128. Publication date: November 2018.
128:24
T. Neumayr et al.
New York, NY, USA, 294–303. [36] Anthony Tang, Melanie Tory, Barry Po, Petra Neumann, and Sheelagh Carpendale. 2006. Collaborative Coupling over Tabletop Displays. In Proceedings of the SIGCHI Conference on Human Factors in Computing Systems (CHI ’06). ACM, New York, NY, USA, 1181–1190. [37] Edward Tse, Chia Shen, Saul Greenberg, and Clifton Forlines. 2007. How Pairs Interact Over a Multimodal Digital Table. In Proceedings of the 2007 CHI Conference on Human Factors in Computing Systems. San Jose, California, USA. [38] Philip Tuddenham and Peter Robinson. 2009. Territorial coordination and workspace awareness in remote tabletop collaboration. In Proceedings of the SIGCHI Conference on Human Factors in Computing Systems. ACM, 2139–2148. [39] Amy Voida, Nathan Bos, Judith Olson, Gary Olson, and Lauren Dunning. 2012. Cross-cutting faultlines of location and shared identity in the intergroup cooperation of partially distributed groups. In Proceedings of the SIGCHI Conference on Human Factors in Computing Systems. ACM, 3101–3110. [40] Pawel Wozniak, Nitesh Goyal, Przemyslaw Kucharski, Lars Lischke, Sven Mayer, and Morten Fjeld. 2016. RAMPARTS: Supporting Sensemaking with Spatially-Aware Mobile Interactions. Proceedings of the SIGCHI Conference on Human Factors in Computing System 2016 (2016). [41] Johannes Zagermann, Ulrike Pfeil, Roman Rädle, Hans-Christian Jetter, Clemens Klokmose, and Harald Reiterer. 2016. When Tablets Meet Tabletops: The Effect of Tabletop Size on Around-the-Table Collaboration with Personal Tablets. In Proceedings of the 2016 CHI Conference on Human Factors in Computing Systems (CHI ’16). ACM, New York, NY, USA, 5470–5481. [42] Björn Zimmer, Ilir Jusufi, and Andreas Kerren. 2012. Analyzing multiple network centralities with ViNCent. In Proceedings of SIGRAD 2012; Interactive Visual Analysis of Data; November 29-30; 2012; Växjö; Sweden. Linköping University Electronic Press, 87–90.
Received April 2018; revised July 2018; accepted September 2018
Proceedings of the ACM on Human-Computer Interaction, Vol. 2, No. CSCW, Article 128. Publication date: November 2018.