Dotplot Patterns: A Literal Look at Pattern Languages Jonathan Helfman AT&T Research Murray Hill, NJ 07974
[email protected]
ABSTRACT
This paper describes the dotplot data visualization technique and its potential for contributingto the identification of design patterns. Pattern languages have been used in architectural design and urban planning to codify related rules-of-thumb for constructing vernacular buildings and towns. When applied to software design, pattern languages promote reuse while allowing novice designers to learn from the insights of experts. Dotplots have been used in biology to study similarity in genetic sequences. When applied to software, dotplots identify patterns that range in abstraction from the syntax of programming languages to the organizational uniformity of large, multi-component systems. Dotplots are useful for design by successive abstraction—replacing duplicated code with macros, subroutines, or classes. Dotplots reveal a pervasive design pattern for simplifying algorithms by increasing the complexity of initializations. Dotplots also reveal patterns of wordiness in languages—one example inspired a design pattern for a new programming language. In addition, dotplots of data associated with programs identify dynamic usage patterns—one example identifies a design pattern used in the construction of a UNIX(tm) file system. Biology, homology, reverse architecture, selfsimilarity, Shakespeare, shuffle, similarity structures, software design, software visualization. Keywords:
Introduction
Pattern languages were identified by Christopher Alexander, an architectural designer, who began describing the design of vernacular buildings and towns in terms of collections of templates or rules-of-thumb that when applied in the right context would result in functional and beautiful structures [1]. Alexander called his templates patterns, and he called collections of related patterns, pattern languages. Alexander’s work has had a strong influence on the objectoriented design community, where the goal of defining patterns is to promote reuse while allowing novice designers to learn from the insights of experts.
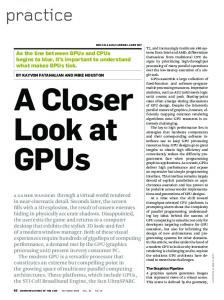
Figure 1: About 2 million lines of C code; an entire module of a telecommunications switching program.
Software patterns are found at different levels of abstraction. Low-level patterns include idioms, useful design techniques for specific programming languages [5]. Higher-level patterns have been identified in behavioral interactions between objects [13] and classes [17]. Even more abstract are highlevel design patterns, or simply design patterns, that are independent of specific programming languages and application domains [11]. Design patterns capture “the intent behind a design” by identifying “classes, instances, their roles, collaborations, and the distributionof responsibilities” [10]. Design patterns have been identified through reverse architecture, a process of “analyzing many software systems in an effort to recover recurring designs and rationals behind them” [21]. Reverse architecture requires reading a lot of code, learning about many different systems, and reflecting on the relative merits of previous designs. Unfortunately, reverse architecture requires a tremendous amount of time and thought. Visualization tools may be particularly helpful for identifying software design patterns. Previous work in visualizing object-oriented systems has shown that animated plots of information about class interactions are useful for identifying
to be or not to be • to • be
• •
or
•
not to • be
•
• •
•
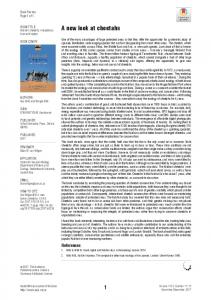
Figure 2: Six words of Shakespeare.
patterns of behavior between classes [17]. Interactive tools are also being developed that will let designers record and organize their observations of object interactions [10]. This paper describes a more general approach to software and data visualization, an approach that requires the introduction of another sort of pattern. Dotplot Patterns, described below, will be shown to identify patterns in software at many different levels of abstraction. Dotplot is a technique for visualizing patterns of string matches in millions of lines of digital information. The dotplot technique is illustrated in Fig. 2. A sequence is tokenized and plotted from left to right and top to bottom with a dot where the tokens match. Dots off the main diagonal indicate similarities. Dotplot patterns can provide a visual overview of the structure of enormous systems. Fig. 1 is a dotplot of about two million lines of C code, one entire module of a large telecommunications switch program. Darker areas indicate regions with a lot of matches (a high degree of similarity). Lighter areas indicate regions with few matches (a low degree of similarity). Dark areas along the main diagonal indicate submodules. Dark areas off the main diagonal indicate a degree of similarity between submodules; the darker the area, the higher the degree of similarity.
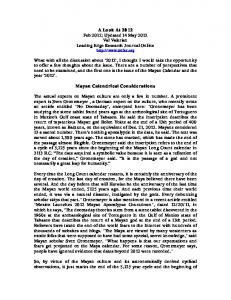
Figure 3: A million words of Shakespeare.
of squares and diagonals, dotplots reveal similarity structures in data regardless of format and in text and software regardless of language. Similarity structures are even found in data formats and languages themselves. Similarity structures identify the relative similarities of sequences that share vocabulary such as copies, versions, translations, documents about similar subjects, and software modules with similar comments or symbols. Dotplots have been used in biology for homology, the study of similarity in genetic material [15, 18]. Dotplot applications now include text analysis (author identification, plagiarism detection, translation alignment, etc.), software engineering (module and version identification, subroutine categorization, redundant code identification, etc.), and information retrieval (identification of similar records in results of queries).
The similarity relationships between submodules in Fig. 1 could be more fully appreciated through an iterative analysis of the following form: 1) determine the dominant vocabulary effect (whatever matches the most), 2) determine the reason for the dominant effect (the mechanism behind the match or the meaning of the match in its context), and 3) temporarily remove the dominant effect and replot to identify secondary effects, etc. The end result of such an analysis is a similarity structure composed of multiple layers of matches at different scales, densities, and levels of representation.
The analysis of string matches might seem to be limited, static, and literal. If you analyze only matching strings in a program’s code or data, you might expect to learn about the program’s syntax, but you might not expect to learn anything about the program’s semantics, how it works, runs, or is used. The examples in this paper, however, show that an analysis of string matches can reveal surprising facts about a program’s history, usage, and behavior. For example, comparing multiple versions of a program’s code reveals information about how the program has evolved. Analysis of certain data related to a program can reveal information about how the program is used and, in some cases, even how the program was designed.
Previous approaches to detecting similarity, such as algorithms that find longest common substrings or measures of angles in high-dimensional spaces, do not reveal the richness of the similarity structures that have been hidden in our software, data, literature, and languages. By plotting matches and relying on the human visual system to identify patterns
The remainder of this paper will attempt to explore the relationship of dotplot patterns to design patterns. After first describing how dotplots are constructed and interpreted, a series of examples will be presented. Discussion of the examples will show that even when dotplot patterns do not identify design patterns, they usually identify less abstract
aaaaaaaaabbbbbbbbb •••••• ••• •••••• ••• •••••• ••• •••••• ••• •••••• ••• •••••• ••• •• • • • • • • • • • •• •• •• •• •• •• •• •• •• •• •• •• •• •• •• •• •• ••• •••••• •• •• •• •• •• •• •• •• •• ••• •••••• •• •• •• •• •• •• •• •• •• ••• •••••• a) Squares.
abcdefgh i abcdefgh i • • •• •• • • •• •• •• • •• • • •• • • • • • • • • • •• • • • • b) Diagonals.
fafbfcfdfefgagbgcgdgeg ••• • • • • • • ••• • • • • • • ••• • • • • • • ••• • • • • • • ••• • • • • • •• • • • ••• • ••••• • • • • • • ••• • • • • •• •• •• ••••• •• • • • • • ••• c) Shuffle.
aaaaaaaabbaaaaaaaa •••••• •• •• •••••• •••••• •• •• •••••• •••••• •• •• •••••• •••••• •• •• •••••• •••••• •• •• •••••• •••••• •• •• •••••• •• • • • • • • • • • • • • • • • ••••• •• •• •••••• •• •••••• ••• ••• •••••• •••••• •• •• •••••• •••••• •• •• •••••• •••••• •• •• •••••• •••••• •• •• •••••• •••••• •• •• •••••• •••••• •• •• •••••• •••••• •• •• •••••• d) Light Cross.
abcdefghabczydefgh • • • • • • • • •• •• •• •• • • •• •• • •• • • • •• •• • • e) Broken Diagonals.
abcdefgh i cdgh i e f ab • • • •• • • • •• •• •• •• • • •• •• • • •• •• • • • •• • • • f) Reordered Diagonals.
aaabbbaaabbbaaabbb ••• ••• ••• •• • • •• • • •• • • •• •• •• ••• ••• ••• •• • • • • • •• • • •• ••• •• •• • • • • • • • • • • • • • • • • ••• ••• ••• •• • • •• • • •• • • • • • • ••• ••• • •• •• ••• • • • • • • ••• ••• ••• ••• ••• ••• •• • • • • • •• • • •• ••• •• ••• ••• ••• g) Reordered Squares.
aaaaaaaaabzbybxbwb •••••• ••• •• •• •• •• •• •• •• •• • • •••••• ••• •• •• •• •• •• •• •• •• • • •• •• •• •• • • • • • • • • • • • • • • • • • •• ••• • • • • • • • • • • •• • • • • • • ••• • • • • • h) Density Variation.
azyaxwavuaaa tsarqapoa •• • • ••• • • • • ••• • ••• • • • • • ••• ••• • • • •• •• •• ••••••• •• •• •• • • • •••• • • • • • • ••• ••• • • • • • ••• • ••• • • • • ••• • • •• i) Dark Cross.
abcdefgh i i hg fedcba • • • •• • • • • • • • •• •• •• •• •• • • •• •• • • •• •• • • j) Palindrome.
Figure 4: Synthetic dotplots.
software patterns, such as dynamic usage patterns and patterns of growth and divergence of software versions. Construction and Interpretation of Dotplots
While Fig. 2 shows six words of Shakespeare, Fig. 3 shows “The Complete Works” [22]. In order to plot millions of matches in a single image, a few additional techniques are used in the construction of Fig. 3 and the other dotplots in this paper. Reconstruction methods and inverse-frequency weighting are used to display matches from more than one pair of tokens in a single pixel (except in Figs. 2 and 4). Weighting prevents matches between frequent tokens from saturating the plot. Grid lines show the boundaries between concatenated files (Figs. 3, 5-7, and 13) or versions (Figs. 9 and 10). While the text sequences of Figs. 2 and 3 are tokenized into words, Fig. 7 uses an n-gram tokenization so that a dot appears where two n-grams match (an n-gram tokenization is obtained by sliding a fixed-width window over the input, one byte at a time). Software sequences are tokenized into lines of code so that a dot appears where two entire lines of code match. The synthetic sequences in Fig. 4, used throughout this paper to model the prototypical dotplot patterns, are tokenized into characters so that a dot appears where two characters match. Additional details of the dotplot technique are described elsewhere [4]. Dotplot patterns are interpreted though a visual language of squares and diagonals [12]. While most visual computer languages focus on organizing images to create information (e.g. programming and control) dotplots are more like statistical plots that are used to interpret information, gain insight, and increase understanding. Squares identify unordered matches (documents with lots of matching words or subroutines with lots of matching symbols), while diagonals identify ordered matches (copies, versions, and translations). The most complex dotplot pattern can be interpreted in terms of its constituent squares and diagonals. Small dark squares in the grid boxes along the main diagonal in Fig. 3 are caused by the names of the casts of characters, which generally match within a single work, but not across different works. The exceptions are the European Histories, which share vocabulary (e.g. “Henry,” “Richard,” “lord,” “steed,” etc.) and form a large dark cluster near the upper left of of Fig. 3. A dark square in a grid box off the main diagonal is roughly analogous to a “high cosine” in the field of information retrieval (i.e. a dark square identifies a pair of documents that have a significant number of words in common). Squares are modeled by the character sequence of Fig. 4a in which the a’s match each other, but not the b’s, and vice versa. In general, one square indicates a high density of unordered matches, usually due to common vocabulary, while two different squares indicate a change in vocabulary. Fig. 5 plots two versions of the xmh program, part of the C code from the X11R5 and X11R6 Window System [20]. Diagonals are formed in the grid boxes that compare the different versions of each file. Diagonals are modeled by the character sequence of Fig. 4b. In general, diagonals indicate ordered matches such as copies or versions. Diagonals indicate that two subsequences have a significant number of words in common, but unlike squares, the common words
Figure 5: Diagonals: two versions of xmh; 58 files, 20,000 lines of C code.
occur in exactly the same order.
Figure 6: Diagonal Texture: copied macros in 23 files, 5000 lines of X11 manual pages.
Concatenation is the simplest way to combine sequences. While concatenating two copies of a sequence creates diagonals, concatenating multiple copies creates a diagonal texture. Fig. 6 is a dotplot of X11R5 manual pages. The diagonal texture is formed by a sequence of macros that are repeated in each manual page. Diagonal textures usually indicate subsequences with a common ancestry. They were probably created from a template or by copying and modifying text with a screen editor. Shuffling is the most complex way to combine sequences. Fig. 7 shows a seemingly contradictory pattern. Dark squares on the main diagonal indicate that each file has unique vocabulary, while the diagonal texture indicates that each file is a copy. Fig. 4c models the combination of squares and diagonals by shuffling together a sequence that forms squares with one that forms diagonals. Fig. 7 is a chapter of a manual in Dutch, French, German, Italian, Spanish, and Swedish. The input is tokenized into 4-grams. The dark squares on the main diagonal are formed by tokens matching within the same language. The diagonal texture is formed by names and numbers that are the same in each language. These words form an identical sequence that is shuffled into each file. Alignments computed from the identical sequences are used to construct multi-lingual concordances for terminology research. Insertion is a trivial type of shuffling. Fig. 8 is a dotplot of several hundred thousand file names, each of the files on our laboratory’s file server one particular afternoon. The file names appear in inode order (the order in which they were created) and a dot appears wherever two file names match. Note the large white cross that spans the entire plot of Fig 8. A light cross is modeled by the character sequence of Fig. 4d in which a sequence of b’s is inserted into a larger
Figure 7: Manual chapter in Dutch, French, German, Italian, Spanish, and Swedish; 1 million 4-grams.
Figure 8: 290,000 file names (light cross is 15,000 unique names).
Figure 9: Two versions of the X Toolkit (66,600 lines of C code).
sequence of a’s. The light cross in Fig. 8 is caused by several thousand files with unique names that were created at about the same time. These file names were in fact generated by the UNIX split utility—someone was in the process of sending the X Window System to Spain via email! (We will revisit the light cross, as well as other features of Fig. 8, in the next section where we discuss dotplots that reveal dynamic usage patterns.) Insertions are also identified by broken diagonals. Fig. 9 shows two versions of the C code for the X Toolkit [2]. The second version is larger than the first. New code is indicated by breaks in the diagonals. Fig. 4e models broken diagonals by inserting extra tokens into an otherwise copied sequence. In general, light crosses indicate insertions into unordered sequences, while broken diagonals indicate insertions into ordered sequences.
Grouping objects by similarity is a simple and natural strategy for establishing order. Automatic detection of similarity structures is useful for organizing multiple versions of large numbers of objects. An example of automatic reordering is shown in Fig. 3 where the concatenation order of Shakespeare’s works was determined by a combinatorial optimization algorithm that attempts to position dark grid boxes near the main diagonal, emphasizing clusters of similar documents. Without automatic reordering it would be impossible to see the large dark cluster formed by the European Histories. Reordering is also useful in information retrieval systems for visualizing document clusters in the results of a query and for automatically detecting similar modules and subroutines in large software systems. Reordering by density alone, however, might fail to reconstruct reordered diagonals. Reordered diagonals can be reconstructed by an image processing algorithm that identifies the clearest diagonal on a strip of grid boxes. Automatic diagonal reconstruction identifies file pairs in reordered versions, which is a crucial first step in comparing versions of large systems that have diverged over time.
Reordering is a crude type of shuffling. Fig. 10 is a dotplot of the C code for two versions of X11 (the dark grid lines show the boundary between the versions). We would expect two versions to plot like the diagonals of Fig. 5. Instead, Fig. 10 reveals shattered and reordered diagonals, such as those modeled in Fig. 4f. Fig. 4f shows the same sequence that plots diagonals in Fig. 4b, but in a different order. When reordered diagonals appear in dotplots of software versions, they usually indicate that file names have changed between versions. Fig. 10 indicates that many of the X11R5 file names have been changed in X11R6, probably because the directory structure has been changed. Reordering is also indicated by a “checkerboard” texture. Fig. 11 shows alternating initializations in a graphics object definition file, ram.bif, which is included with the X11 distribution. Fig. 4g models a checkerboard texture with the same sequence that plots squares in Fig. 4a, but in a different order. In some cases it is useful to automatically reorder sequences.
Automatic reordering only works for crudely shuffled sequences. When sequences are smoothly shuffled together, they appear as density variations that indicate relative similarities of vocabulary. The squares off the main diagonal in Fig. 7 have different grey values or densities of matches. Squares of different densities are modeled in Fig. 4h, where a sequence of non-repeating tokens is shuffled into the second half of a sequence that would otherwise produce squares. In Fig. 7, the grey value of a square indicates the relative similarities of different languages. Matches between files in relatively different languages (e.g. Spanish and German) show up as light grey, while matches between files in very similar languages (e.g. Spanish and Italian) show up as dark grey. Density variations also explain the dark crosses near
Figure 10: Two versions of the X Window System (1,900,000 lines of code).
Figure 11: Reordered initializations in 2500 lines of a graphical object definition.
the center of Fig. 3, which correspond to the poems The Rape of Lucrece and Venus and Adonis. Dark crosses are modeled in Fig. 4i. The poems do not have large casts of characters to distinguish them from the other works. Instead they share tokens common to the other works (e.g. “doth,” “eyes,” “love,” “life,” “death,” etc.). While light crosses indicate unusual subsequences (Figs. 8 and 4d), dark crosses indicate representative subsequences (Figs. 3 and 4i).
has been described. Several dotplots have been presented and interpreted through a visual language of squares and diagonals. One of the examples, Fig. 8, captures a dynamic usage pattern of a file system (rapid allocation of uniquely named files). The following section will present additional dotplot patterns that identify software patterns at various levels of abstraction.
Squares and diagonals appear at different scales. For example, the small dark square near the center of Fig. 10 is caused by a collection of manual pages that were inadvertently included in the input. The manual pages form a square because they have a tremendous number of matches when compared with each other. Fig. 6 shows the same manual pages at a higher resolution. What looked like a square at low resolution appears to be a texture of diagonals at a higher resolution. Lack of resolution tends to obscure ordered matches; dark squares often hide rich similarity structures.
Can Dotplots be Used in Software Design?
Dotplots also reveal similarity structures at different levels of representation. Most dotplot patterns reveal similarity structures in information, but some dotplot patterns reveal similarity structures in languages that are used to represent information. Dotplots reveal the relative similarities of natural languages (Fig. 7) and the wordiness of data formats in artificial languages (Fig. 11). As another example, Fig. 12 shows a texture formed by repeated “break” tokens in a C program “switch” statement. This pattern is not due to a particular programmer, but rather to the designers of the C programming language, who chose to require an explicit syntactic structure (“break”) to achieve a commonly needed function (terminate a switch statement). As a result, such textures occur frequently in dotplots of C code. In this section, the construction and interpretation of dotplots
There is a story related to Fig. 12 that is relevant to both software and programming language design. Although we had anticipated that dotplots would be used for software maintenance and analysis, one of the first users of the dotplot browser used it for design. He made a dotplot of software that he was writing, and wherever he saw a diagonal, he would replace the duplicated code with a subroutine or macro and then replot the new code. After a few iterations, the only discernible patterns were caused by wordiness in the implementation language. His dotplots exhibited the textures of Fig. 12, which were caused by the repeated “break” strings in C switch statements. Most people would have stopped there. But the software that he was plotting was actually an interpreter for a new programming language that he was designing. The textures confirmed his suspicion that “break” should be the default action in switch statements, and he went on to incorporate the following low-level pattern into the design of his new programming language [14]: Break Context: Programming languages use different syntax to model the flow of control in compound conditional directives. Problem: How to minimize syntax and maximize legibility?
Figure 12: A 1000-line C switch statement.
Solution: Make an immediate exit from the compound conditional the default behavior after the first successful test. Do not require the equivalent of an explicit “break” statement. To support extending the flow of control through to the next test, consider requiring the equivalent of an explicit “no break” statement. Using dotplots to eliminate similarities was an unexpected application of dotplot patterns for design. Design by eliminating matches, or by Successive Abstraction, may seem like a reductionist strategy that has more of the flavor of deconstructionism (the latest craze in architectural design) than pattern languages. For prototypes or encapsulated objects, however, Successive Abstraction is a valid and useful design pattern: Successive Abstraction Context: Some portions of programs, modules, and objects are independent and may be reorganized without affecting external interfaces, other modules, or developers. Problem: Redundant code may make programs longer than necessary, difficult to maintain, and difficult to understand. Solution: Identify redundancies as opportunities for further abstraction; wherever possible, replace redundant code with macros, subroutines, classes, or expressions in “little languages.” Successive Abstraction is related to previously identified patterns such as Factor Out Common Attributes [7] and Consolidate the Program to Support Evolution and Reuse [8], although these patterns focus on object-oriented solutions
Figure 13: Copied comments in 3000 lines of C code.
such as identifying abstract base classes. In some cases, there may be reasons for not replacing redundant code with subroutine calls (e.g. the code may require so much state information that a subroutine call may be too inefficient or exceed stack-size limitations). In other cases, replacing redundant code may introduce abstractions that complicate the legibility of the code instead of clarifying it. Unfortunately, most programmers of large systems do not have the freedom to eliminate redundancies. These programmers are encouraged to change as little code as possible and to rely on as little code as possible—it would be a disaster if their code relied on a subroutine in a different module that was changed or eliminated. For these reasons, redundant code has a tendency to proliferate in large software systems. In these cases, because redundancies are necessary, it makes sense to know where copies are located and why they are required. For example, if a bug is fixed in one of the copies, the other relevant copies should probably be fixed as well. In addition, some types of redundancy may be desirable for maintaining uniformity in large programming projects. Fig. 13 shows a diagonal texture caused by matches in comments at the beginning of each subroutine in a subsystem of the telecommunications switching program of Fig. 1. This diagonal texture is similar to that of Fig. 6, which was caused by a repeated sequence of macros in X11 manual pages. Although macros may be used to eliminate certain low-level redundancies, a repeated sequence of macros identifies a higherorder level of redundancy. Repeated sequences of macros and comments are often the result of an organizational or cultural pattern for maintaining uniformity throughout a design: Organizational Uniformity
Context: To promote ease of use and reuse, modules in large collaborative projects require standardization in the form of a uniform interface or method for describing their interface. Problem: It must be easy to identify each component of a system and to distinguish the components from each other. Each component of a software system may be identified by a common header in the form of a template of comments. Such templates make code longer and may include errors. Incorrect comments make code difficult to use and maintain. How to balance the needs for brevity, clarity, accuracy, and uniformity? Solution: Ideally, uniform usage descriptions could be generated from code so that their accuracy could be guaranteed. Where this is not possible, brief and clear usage comments should be maintained to document the interfaces of modules that will need to be reused—but these comments must be kept up-to-date if the code is changed or they may become worse than no comments at all. Organizational Uniformity is related to Mercenary Analyst, a previously identified “organizational pattern” that suggests hiring a technical writer to ensure uniform and up-to-date documentation of systems architecture [6]. Organizational Uniformity interacts directly with Successive Abstraction, which strives for local brevity. Organizational Uniformity sacrifices local brevity for the possibility of reuse, which could achieve global brevity. Organizational Uniformity is a very highlevel pattern; the template format of pattern descriptions (i.e. Name, Context, Problem, Solution) is itself an example of Organizational Uniformity.
Figure 14: Shrinking diagonals in 600 lines of C code.
Some types of redundancies, such as those formed by the object initializations of Fig. 11, indicate that programming languages are not always well suited to the tasks they are required to perform. Fig. 14 plots about 600 lines of C code from the telecommunications switch program of Fig. 1. The texture of shrinking diagonals is caused by a set of data structure initializations and macro calls. The first set consists of sixteen initializations to zero and a macro call. The second set consists of fifteen zero initializations, one non-zero initialization, and a macro call. The third set consists of fourteen zero initializations, two non-zero initializations, etc. At about halfway through the initializations, a pattern begins to form in the non-zero initializations, which causes a secondary texture of growing diagonals. A much larger initialization pattern from the same program is shown in Fig. 15—60,000 lines of signal-table initializations (a small fraction of the actual 230,000-line structure of initializations). Fig. 16 shows a pattern in 9800 lines of finite-state machine code. The massive redundancies in Figs. 15 and 16 (as well as those of Figs. 11 and 14) identify another common design pattern: Complex Initializations Context: Some programs must execute a very large number of slightly different behaviors. In many cases, the number of behaviors must be extensible.
Figure 15: 60,000 lines of signal-table initializations (detail of a 230,000-line structure).
Figure 16: 9800 lines of FSA machines.
Problem: Algorithms for managing large numbers of slightly different behaviors may be too complex to maintain.
Figure 17: 3400 lines of C code.
Solution: Recast complex algorithms as comparatively trivial algorithms that operate deterministically on initialization data. Even trivial algorithms, such as those of finite state machines, can exhibit complex behaviors by operating from complex initializations. Minor behavioral variations are easily achieved with minor variations in the initialization data.
It may make sense to design some programs, such as parts of a telecommunications switch, as a trivially simple algorithm that operates on possibly complex initialization data. Hundreds of slightly different behaviors can then be generated by slightly different initializations. In theory, these systems should be easier to maintain that ones designed with complex algorithms. However, the pattern of Successive Abstraction indicates that the tremendous amount of highly structured duplication in the initializations may, in fact, make maintenance of large state machines quite difficult. Large patterns of Complex Initializations would seem to be good candidates for the design of new “little languages” to help eliminate the redundancy and decrease potential initialization errors [3]. Other improvements may be obtained through object-oriented strategies, such as those identified by the patterns State [11], Three-Layer FSM [16], and Object-Oriented State Machine [19]. How can we tell if redundancies represent patterns to be avoided or emulated? Redundancy may be the result of rampant copying with no regard toward design at all. One way to find out more about the history of redundant code is to compare a dotplot of software with dotplots of related information. Fig. 17 plots about 3400 lines of C code from the
Figure 18: 3400 lines of author names.
Fig. 19 is a detail of Fig. 8, computed with more resolution. Fig. 19 shows reverse diagonals, a rare form of diagonal that is hardly ever seen in dotplots of text or software, yet is quite frequent in dotplots of music. A reverse diagonal, modeled in Fig. 4j, indicates a palindrome, a sequence that is the same forwards as it is backwards. In Fig. 19 the palindromes are formed by sequences of file names that appear first in one order, then later in the reverse order. These files were generated by the UNIX make utility that was used to quickly free several inodes (“make clean”) and then reallocate them (“make”). The file system evidently stores inodes in a stack (i.e. a data structure with a Last-In-First-Out or LIFO access policy) so that they are reallocated in an order that is the reverse of the order in which they are freed. In this case, the dotplot has not only revealed dynamic usage patterns, but it has also revealed a design pattern in the file system code (which isn’t even being plotted): LIFO Allocation Figure 19: Palindromes in 900 file names.
telecommunications switching program of Fig. 1. The long diagonal lines indicate groups of several hundred consecutive lines of code that were copied at least four times. This code is stored in a database that also includes information about when and why the code was created or changed. It is possible to query the database to obtain a wealth of information about the history of each line of code. For example, it is possible to construct a sequence of 3400 author names that correspond to each of the original 3400 lines of C code. A dotplot of the 3400 author names is shown in Fig. 18. Superposition of Figs. 17 and 18 indicates that there was one author who was responsible for the majority of the code copying. Comparing additional related dotplots of modification dates and modification identifiers would probably provide additional insight into the evolution of this code. Just as dotplots of data related to code reveal information about how the code evolved, they may also reveal information about how the code is used. Such usage patterns should probably be understood when evaluating or redesigning the code. For example, we have already described the light cross in Fig. 8, a dotplot of several hundred thousand file names. While Fig. 8 does not plot the actual text of a software system, it instead plots a series of strings that are fundamentally related to the state of the software system. The light cross in Fig. 8 indicates that the file system is used to temporarily create large numbers of uniquely named files while transmitting large programs through the network. Perhaps this usage pattern should be supported in the design of an electronic mail system. Fig. 8 also indicates that the file system is used for massive amounts of versioning. Most of the dark areas of Fig. 8 are formed by diagonal textures, which indicate people are using the file system to store large numbers of different versions of files. These patterns suggest that some of the newer file system implementations that support automatic versioning are probably on the right track [9].
Context: Some programs require fast memory allocation and reallocation of equal-sized data structures and may not be able to use standard memory allocation routines. Problem: Standard, heap-based memory allocation routines may be too slow or unavailable for some high-performance tasks. Solution: Use equal-sized pieces of a preallocated memory segment in a linked-list configuration. Allocate structures by removing them from the head of the list. Free structures by adding them to the head of the list. This strategy is fast, but will not maintain the order of structures that are reallocated. It is also particularly inefficient if the last element of the list must be accessed. Most of the design patterns identified in this section may be thought of as forming a pattern language because they are related to the pattern Successive Abstraction. While implementing a design in a particular programming language, repeated sequences of statements may be identified. Application of Successive Abstraction will coerce many of the repeated sequences into expressive structures of the language (i.e. macros, subroutine calls, class definitions, etc.). The decision to use a particular programming language has consequences that may be emphasized by Successive Abstraction and may appear as additional patterns. Some low-level redundancies may not be eliminated because they are embedded within the programming language itself (e.g. Break). Some high-level redundancies may not be eliminated because they are not compactly expressible within the programming language (e.g. Complex Initializations). In addition, some very-high-level redundancies may not be eliminated because they are required for maintaining Organizational Uniformity regardless of the programming language. Conclusion
Dotplots reveal patterns about software systems that are useful for design. Dotplots facilitate design by Successive Abstraction—a design pattern that attempts to eliminate redun-
dancy. One dotplot pattern revealed wordiness in a programming language (Fig. 12) and identified a programming language design pattern, Break, that was used to eliminate wordiness in the design of a new programming language. Another dotplot pattern revealed uniform usage descriptions in a large programming project (Fig. 13) and identified a very high-level design pattern, Organizational Uniformity, which is also found in the template format of design pattern descriptions themselves (i.e. Name, Context, Problem, Solution). Several dotplot patterns revealed redundant initializations in objects (Fig. 11), data structures (Fig. 14), signal tables (Fig. 15), and finite-state automata code (Fig. 16). These redundancies identify a pervasive design pattern, Complex Initializations, that is useful for simplifying algorithms by increasing the complexity of initializations. Dotplots of data associated with programs identify patterns of software evolution (Figs. 17 and 18) and patterns of dynamic usage (Fig. 8). One dotplot pattern revealed a palindromic organization of file names (Fig. 19), which identified a design pattern, LIFO Allocation, used in the construction of a UNIX file system. Dotplots reveal the similarity patterns that exist in information as well as our various encodings of information (e.g. data formats and natural and artificial languages). Although dotplots are primarily tools for the static analysis of literal string matches, they have been shown to be useful for design. Dotplot similarity patterns do not exist in isolation, but rather, like pattern languages, as interrelated structures at multiple densities, scales, and levels of abstraction. Much of this work is still preliminary. Hopefully the similarities between dotplot patterns and pattern languages will generate new insights and allow us to further explore the relationships between patterns, language, and information. REFERENCES 1. Christopher Alexander. The Timeless Way of Building. Oxford University Press, 1979. 2. Asente and Swick. X Window System Toolkit: The Complete Programmer’s Guide and Specification. Digital Press, 1990. 3. Jon Bentley. More Programming Pearls: Confessions of a Coder, pages 83–100. Addison-Wesley Publishing Company, 1988. 4. Kenneth Church and Jonathan Helfman. Dotplot: A program for exploring self-similarity in millions of lines of text and code. Journal of Computational and Graphical Statistics, 2(2):153–174, 6 1993. 5. J. O. Coplien. Advanced C++ Programming Styles and Idioms. Addison-Wesley Publishing Company, 1992. 6. J. O. Coplien. A generative development-process pattern language. In J. O. Coplien and D. C. Schmidt, editors, Pattern Languages of Program Design, chapter 13, pages 183–237. Addison-Wesley Publishing Company, 1995. 7. Dennis L. DeBruler. A generative pattern language for distributed processing. In J. O. Coplien and D. C. Schmidt, editors, Pattern Languages of Program Design, chapter 5, pages 69–89. Addison-Wesley Publishing Company, 1995. 8. Brian Foote and William F. Opdyke. Lifecycle and refactoring patterns that support evolution and reuse. In J. O. Coplien and
D. C. Schmidt, editors, Pattern Languages of Program Design, chapter 14, pages 239–257. Addison-Wesley Publishing Company, 1995. 9. Glenn S. Fowler, David G. Korn, and Herman C. Rao. n-dfs: The multiple dimensional file system. Trends in Software: Configuration Management, 2:135–154, 1994. 10. Erich Gamma, Richard Helm, Ralph Johnson, and John Vlissides. Design patterns: Abstractions and reuse of objectoriented design. In ECOOP ‘93 Proceedings, Springer-Verlag Lecture Notes in Computer Science, 1993. 11. Erich Gamma, Richard Helm, Ralph Johnson, and John Vlissides. Design Patterns: Elements of Reusable Object-Oriented Software. Addison-Wesley Publishing Company, 1995. 12. Jonathan Helfman. Similarity patterns in language. In IEEE Symposium of Visual Languages, pages 173–175, 1994. 13. R. Helm, I. Holland, and D. Gangopadhyay. Contracts: Specifying behavioral compositions in object-oriented systems. In OOPSLA/ECOOP ‘90 Proceedings, volume 25, pages 169– 180, 1990. 14. David Ladd and Christopher Ramming. A*: A language for implementing language processors. In IEEE International Conference on Computer Languages, 1994. 15. J. Maizel and R. Lenk. Enhanced graphic matrix analysis of nucleic acid and protein sequences. In Proceedings of the National Academy of Science, Genetics, USA, volume 78, pages 7665–7669, 1981. 16. Robert Martin. Discovering patterns in existing applications. In J. O. Coplien and D. C. Schmidt, editors, Pattern Languages of Program Design, chapter 19, pages 365–393. AddisonWesley Publishing Company, 1995. 17. W. De Pauw, R. Helm, D. Kimmelman, and J. Vlissides. Visualizing the behavior of object-oriented systems. In OOPSLA ‘93 Proceedings, volume 28, pages 326–337,453–454, 1993. 18. J. Pustell and F. Kafatos. A high speed, high capacity homology matrix: Zooming through sv40 and polyoma. Nucleic Acids Research, 10(15):4765–4782, 1982. 19. Alexander S. Ran. Patterns of events. In J. O. Coplien and D. C. Schmidt, editors, Pattern Languages of Program Design, chapter 19, pages 547–553. Addison-Wesley Publishing Company, 1995. 20. R. W. Scheifler and J. Gettys. The X window system. ACM Transactions on Graphics, 5(2):79–109, 4 1986. 21. John Vlissides. Reverse architecture, 1995. Position Paper for Software Architectures Seminar, Schloss Daghstuhl, Germany. 22. Stanley Wells and Gary Taylor. William Shakespearethe Complete Works. Oxford University Press, 1989. Electronic Edition for the IBM PC.