AbstractâWith the advent of Internet of Things, the field of domain ... (DQS-Cloud), a cloud-based sensor data services infrastructure. DQS-Cloud is ... management operators. .... ture as a Service (IaaS) and Software as a Service (SaaS).
10th IEEE International Conference on Collaborative Computing: Networking, Applications and Worksharing (CollaborateCom 2014)
DQS-Cloud: A Data Quality-Aware Autonomic Cloud for Sensor Services Abhishek Kothari, Vinay Boddula, Lakshmish Ramaswamy, Neda Abolhassani Department of Computer Science University of Georgia Athens, Georgia 30605 Email: {kothari, boddula, laks, neda}@cs.uga.edu Abstract—With the advent of Internet of Things, the field of domain sensing is increasingly being servitized. In order to effectively support this servitization, there is a growing need for a powerful and easy-to-use infrastructure that enables seamless sharing of sensor data in real-time. In this paper, we present the design and evaluation of Data Quality-Aware Sensor Cloud (DQS-Cloud), a cloud-based sensor data services infrastructure. DQS-Cloud is characterized by three novel features. First, data-quality is pervasive throughout the infrastructure ranging from feed discovery to failure resilience. Second, it incorporates autonomic-computing-based techniques for dealing with sensor failures as well as data quality dynamics. Third, DQS-Cloud also features a unique sensor stream management engine that optimizes the system performance by dynamically placing stream management operators. This paper reports several experiments to study the effectiveness and the efficiency of the framework.
I.
of sensor feeds is critically important for sensing services, the concept of data quality is very weak in most existing infrastructures. Towards addressing the shortcomings of existing sensor services platforms, in this paper, we present DQS-cloud – a novel cloud-based sensor servitization framework that incorporates advanced feed discovery, feed processing and adaptation capabilities. A unique aspect of DQS-cloud is that the concept of data quality (DQ) of sensor feeds is central to its design. DQ is pervasive throughout the architecture and drives all mechanisms and techniques of the DQS cloud. In designing the DQS-cloud infrastructure, this paper makes three research contributions. •
First, we present a sensor service discovery technique that takes into account the DQ requirements of individual sensor service consumers and the DQ properties of individual sensor feeds. This DQ-aware sensor service discovery technique finds the feed that best matches requirements of individual sensor service consumers both with respect to the content of the feed as well as the quality of the feed.
•
Second, we design a DQ-aware technique for planning feed processing workflows. This technique intelligently places feed processing operators on gateway devices as well as cloud servers so as to optimize the bandwidth and battery consumption. Furthermore, our technique incrementally adapts to entry and exit of sensor service providers and consumers.
•
Third, we present a DQ-aware fault tolerance mechanisms to deal with failures and recoveries of individual sensors. Our technique minimizes the disruption of service at sensor data consumers. Further, it also reduces the need for human intervention.
I NTRODUCTION
It is widely expected that the Internet of Things (IoT) paradigm will enable remote sensing on a massive scale. IoT will comprise of large numbers of wirelessly-connected sensors that will collaboratively sense various aspects of a given environment. Furthermore, IoT will facilitate dissemination and sharing of sensor feeds on a global scale in near real-time. Based on the recent trends in various computing domains such as storage, software and infrastructure, it is reasonable to expect that IoT will lead to ‘servitization’ of domain sensing functionalities. In such a sensing-as-service ecosystem, sensor feeds collected by one party (henceforth referred to as sensor service providers) may be utilized by another party (henceforth referred to as sensor service consumers). In other words, sensor service providers install and maintain sensor infrastructures, and share/trade the feeds from these sensors with sensor service consumers over the Internet. The service consumers can then embed the feeds into their own applications. There is some initial work on building infrastructures for supporting the sensing-as-service ecosystem. Xively [1] (formerly known as Cosm and Pachube) is an early attempt at such an infrastructure. However, effective servitization requires powerful mechanisms for sensor feed discovery, planning of feed processing workflow (query processing workflow), failure resilience and system management. To the best of our knowledge, most existing infrastructures do not provide these capabilities, thus requiring high-levels of manual intervention. This imposes significant burdens both at service providers’ as well as service consumers ends. Furthermore, although quality 295
We have implemented a real prototype of the DQS-cloud framework. We present several experiments to demonstrate the efficiency and the scalability of the proposed architecture and techniques. The remainder of the paper is organized as follows. Section II presents background and motivation on Internet of things and Data as a service. Section III explains the system architecture of our DQS-Cloud system. In section IV, we discuss three novel features of our system in detail. Section V demonstrates the experimental study of the system. In the next 978-1-63190-043-3 © 2014 ICST DOI 10.4108/icst.collaboratecom.2014.257475
Fig. 1: High-Level System Architecture of DQS-Cloud
section VI, we cover the related work followed by conclusions in section VII of the paper. II.
BACKGROUND AND M OTIVATION
Internet of Things (IoT) will comprises of billions devices achieving a web where things would be connected, could sense and could communicate with each other. IoT will be true enabler of ubiquitous sensing bringing in dynamic network of billions of devices and will bring further understanding of complex natural processes, efficient management of transport, medical, and infrastructure services, help in effectively reporting and tackling events of interest and many more things. The idea of Computing as Service where the cloud providers have successfully catered Platform as a Service (PaaS), Infrastructure as a Service (IaaS) and Software as a Service (SaaS) model has revolutionized the Information Technology industry. It will be very likely that in near future, the cloud based Data as a Service model where either raw data or processed data would be used for key decision making will further expand the servitization concept. This will gain popularity as it clearly has several advantages. First, as in the case of cloud computing it will reduce the cost for individuals by not having to worry about buying own servers and other technical and maintenance overhead. Second, by enabling individuals, domain scientists and businesses to share real time data, the sensor service paradigm will enable easy data transfer on global scale. Third, it will lay foundation stone to sensor service industry where sensing providers would expose their data feed and the middleware would provide appropriate data service to the consumers. The availability of online data markets such as InfoChimps [24], Azure marketplace [25] data market has validated the Data as a Service model. However, the existing data marketplace host static pre-collected data mostly structured in nature. Our systems intention is to provide real time data to consumers. Xively [1] is the first effort towards building 296
a real time data sharing cloud platform but there remains some fundamental limitation between the requirements of next generation IoT platform and Xively. First, it supports very primitive query to obtain the data of interest hence it is a tedious process for the user to search the data feed that fits her requirements of various kind. Second, if the user chosen data feed stops providing data due to various reasons, the user needs to go back and redo the entire search of finding appropriate data feed. Such design needs the user to write her own feed monitoring tool. Third, the user remains ignorant if a new data feed with better capabilities gets registered with the cloud server. Ideally, in such case the server itself should choose the best data feed dynamically and provide it to the user, but such facility is missing. Fourth, the concept of data quality is completely missing from such platform, as a result a user has no choice of expressing the application specific feed requirements. III.
DQS-C LOUD S YSTEM A RCHITECTURE
In this section, we describe the architecture of our system. The Data Quality-Aware Sensor Cloud system is based on the features of stream and query processing engine, data quality and monitoring. Figure 1 shows the high-level architecture of our proposed cloud system. A. Overview The system consists of three layers, i.e.,sensor data providers, subscribers and cloud server. The first layer is the sensor data providers in which providers can vary from cell phone to Raspberry Pi to any of the possible sensor data receiver acting as a gateway as shown in Figure 2. To be a provider, a device must have the ability to send sensor data over the Internet. The second layer, subscribers, may be any device or application that belongs to a company, a department or a gateway to other wireless sensor network. Subscribers basically show interest to collect sensor data in
Fig. 2: High-Level Architecture of Provider
real time for a particular data flow. The last layer, the cloud server is the backbone of our DQS-Cloud system as shown in Figure 1. Different components exist on the server functioning and working continuously to process the data, keeping an eye on the quality of the data, processing query, and operations in real time. Figure 2 demonstrates a high level architecture of a provider. We use the terms provider / publisher and data stream / sensor interchangeably throughout the paper. Devices such as Raspberry Pi, cell phones are considered as providers because they can connect to the Internet. Small appliances such as temperature, humidity, wind, and heart rate monitor sensors are those that actually collects the data. Each of these devices are connected to the providers to transmit data over the Internet. The channel of data points for each small devices is termed as data stream. Many data streams can be supported by a service provider. A key component of our architecture is the Data processing and query layer. It is responsible for maintaining DQ aware catalogs, DQ aware sensor feed discovery, dynamic allocation and de-allocation of buffers, the operations to be performed on data streams and control the status (active / passive) of the data streams. The Publisher Interface component is responsible for the registration of data providers and streams. It also informs the data stream on its new frequency and delay time interval calculated by the Data processing and query layer. The next component is the Subscriber Interface, which is responsible for the registration of subscribers, maintaining metadata for each subscriber and sending data in real time to the subscriber in question provided by the Data processing and query layer. The next component is the Quality Monitoring component, which is designed to monitor data streams. It checks whether the data stream meets the requirement for which they have agreed during registration. Some of the quality parameters that we consider are data stream polling, the delay time and frequency interval. The other monitoring component is Subscriber Monitoring whose task is same as that of Quality Monitoring component except that it oversees the data processed by the Data processing and Query layer exclusively for the specific subscriber. The quality parameters are also the same as mentioned previously. The last component is Data 297
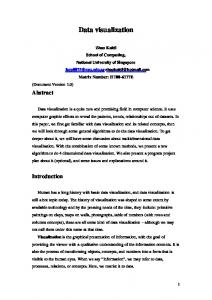
layer, which is composed of in-memory buffers and database comprising of metadata and history information. The Buffers are responsible for storing the recent sensor data feeds to allow real-time processing. The Metadata database stores the information of all subscribers, data providers and data flows. The system also has a History database which is responsible for storing the data points of all data streams. This is useful for batch processing and serve ad-hoc queries. B. Data Quality Model Our main objective is to make a DQ as a multidimensional space considering all sensor devices have multiple quality parameters or metadata like accuracy, delay, frequency, latitude, longitude, sensor type, etc. In addition, the sensors are susceptible to failure which entails the data quality as an important factor to be considered for DQS-Cloud. There is no limitations on the number of quality parameters, but our current system has limited the parameter to few and can readily be adapted to other factors effectively. The quality parameter, Accuracy represents how close the data values of the sensors are to the real values. The Delay is the time interval after which provider sends the data to the cloud server. Frequency is the time interval after which the sensor collects data points or values. Location of sensor is the combination of latitude and longitude. Sensor types are as temperature, humidity, light, wind sensors, etc. With this model, each individual sensor feed maps to a specific point in the multidimensional space at any given point of time. The coordinates of the point to which a feed is currently mapped depends upon the current values of its DQ attributes. On the other hand, each domain application maps to a region (sub-space) of the multidimensional space. This subspace indicates the value ranges along various DQ dimensions that are acceptable to the domain application. With this model, a particular sensor feed, say Si , satisfies the DQ constraints of a domain application DAk , if Si maps to a point that falls within DAk ’s sub-space. Figure 3, illustrates our multidimensional DQ model, in this example, S2 satisfies the DQ requirements of DA1 , whereas S1 does not. Apart from the multidimensional space, a DQ model should
have some characteristics as mentioned below but are not limited to: 1) 2) 3)
Effectively accommodate a diverse and possibly growing set of DQ attributes. Quickly determine the feeds that satisfy the DQ requirements of particular domain applications or subscriber. Compare sensor feeds based on their DQ characteristics. Fig. 4: Query Representation
A. Data Quality Aware Service Discovery The main purpose of this feature is to optimize the number of active data streams. The optimization is performed by choosing the appropriate data stream for subscribers maintaining awareness of quality data. The importance of data quality for sensor data requires a way to establish a mechanism for introducing data quality parameters in the cloud system. Systems like Xively, can provide sensor data, but do not consider the quality of the sensor devices and data. Apart from the quality of the data, the current sensor cloud platform require subscribers to manually perform the tasks of choosing providers, which is a very difficult task to handle.
Fig. 3: Multidimensional DQ Model
C. Query Language DQS query language is used to describe both subscriber the kind of data they need, as well as the provider to describe the feeds they provide. There are several ways to represent the query in the form of XML, JSON and CSV. Our system allows to write the query language, either in JSON or XML. In general, the syntax of the query contains two main parts. 1) 2)
Description of attributes - sensor type, latitude, longitude, etc. The attributes of data quality - delay (milliseconds), frequency (milliseconds), accuracy, etc.
For a provider, the description attribute describes the kind of data that is being served along with geolocation sensors and data quality attribute that describes the ability of quality of sensor data. While for a subscriber, the description attribute specifies the kind of data and the geolocation the subscriber is interested in along with the data quality attributes that describes the data quality requirements of specific application. Figure 4 shows an example of the JSON query language. There are other ancillary attributes in the query language running on our system, but is not described here.
IV.
DATA Q UALITY AWARE T ECHNIQUES
All techniques to be discussed are highly integrated and coupled to perform various autonomic operations like choosing an optimized data stream, failure detections, bandwidth optimization, etc. in our DQS-Cloud system. 298
We used two techniques to carry out the aforementioned limitations of other systems. First, without the subscribers intervention, our system incorporates automated technique for choosing an optimized data stream for the subscriber based on querys DQ parameters. For example, if subscriber Si wants to receive sensor data of type ti with frequency fi and the delay interval di of a particular location li , the subscriber has to manually do the lookup to select a data stream Di . Basic systems do not guarantee availability of exact data streams, as a result the subscriber may have to choose an optimized data stream up to the threshold for each of the DQ parameters. Given this, our system chooses Di on the fly which will be either exact or optimized feed for the subscriber Si , This process is automated without the intervention of the subscriber. To select a data stream for many subscribes, the system selects the one that is better able to meet the need of as many subscribers. In DQ 3-dimensional model, where the parameters of DQ are accuracy, delay and frequency, we chose a data stream with the lowest frequency, the exact accuracy and delay which is within the threshold of the subscriber. For example, in Figure 5, both data streams D1 and D2 are within the DQ sub-space of subscriber S1 . Our system chooses data stream D1 because it has the minimum frequency interval of 10,000 milliseconds. Second, for several subscribers which have similar queries, a single data stream can be used to meet their needs. For example, the subscriber Si and Sj both want to receive data from sensors with type tx , frequency fx , and delay dx of a particular location lx . In the basic system, for both the subscribers, human intervention is required to choose the data stream. Therefore, in the worst case, they are most likely to choose different data streams, assuming that the system has many streams that can meet their needs. This means for the subscriber Si and Sj , Di and Dj data stream has been chosen,
Fig. 5: Illustration of data quality aware service discovery and query planning.
respectively. However, in our case, the number of active data streams for similar subscribers are reduced efficiently. This reduction is due to the selection of already active data streams. For the above example, our system tweaks the DQ parameters of one of the data streams by performing some operations, so that it can satisfy the need for both Si and Sj subscriber within their thresholds, respectively. In Figure 5, as discussed before, our system chooses data stream D1 for subscriber S1 . We can see that both data stream D1 and D2 are also within the sub-space of subscriber S2 . However, our system chooses data stream D1 as it is already active. Thus, it results in fewer data streaming for m subscribers considering data quality awareness. We have also shown this in the experimental section V-C. Using the above techniques, our system also gains more control over providers and subscribers, which can help us in handing of data stream failures dynamically. Also, since we have control on the choice of the data stream to keep active, we can easily switch from one data stream to another on the fly even when the server and the subscribers are up, running and listening. We will discuss more about this in detail later. B. Quality Aware Query Planner The main purpose of this feature is to plan the query effectively. These queries include DQ characteristics that must be considered when selecting a sensor feed for a subscriber. We have already discussed how to discover feeds, but the next challenge is deciding where to place the quality operators such as filter, sampler, etc. The optimized decision should facilitate a lower consumption of bandwidth of the network between providers and cloud server and cloud server and subscribers, respectively. The number of data points required per subscriber can be calculated as: SubscriberDelay(Si d) Si n = SubscriberF requency(Si f ) Similarly, number of datapoints transferred per data stream of the provider is: Di n =
DatastreamDelay(Di d) DatastreamF requency(Di f )
To reduce bandwidth consumption on the network between providers and cloud server, a certain level of operators have to be pushed to the end of the provider. Our system achieves this by using two-step procedures. First, it reduces the number 299
of data points per data stream of a provider. For example, subscribers Si and Sj both want to receive sensor data of type tx with frequency fi , fj and of delay di , dj of a particular location lx , respectively. Both queries are similar but with different delay parameters and frequencies. In the basic system, both queries will be considered as different and choose two different data streams. As we know, Di n must be greater or equal to Si n, otherwise the data stream Di n cannot be selected for the subscriber. Thus, the number of data points to transmit will be more than the desired, i.e. Di n, Dj n for subscriber Si , Sj , respectively. Whereas in our system, which has DQ aware operators, the important task is to decide which operators should be pushed to providers for data streams. For each subscriber, we push the values of the corresponding DQ parameters and perform operations on providers. Thus, transmitting only the selected data points Si n, Sj n as needed. P Therefore, Pwe have reduced the number of data points from Dk n to Sk n, where k ∈ 1 to m and m is number of subscribers. In Figure 5, for both subscribers S1 and S2 , data streams D1 and D2 are selected, respectively. Our system computes new delay interval for D1 and D2 as 50,000 milliseconds and 60,000 milliseconds, respectively and new frequency interval as 250,000 milliseconds and 240,000 milliseconds, respectively. So, the number of data points are reduced from 134 to 37 per 1,000,000 milliseconds. The second step uses incremental approach by annotating the active feeds or data streams. As we discussed in sub section IV-A, we reduce the number of active data streams by calculating new values for the DQ parameters. Thus, for the above scenario, since both queries are similar, only one data stream is needed. The calculated value is the minimum of each DQ parameters of all subscribers to a data stream. If the data stream Di is selected for both the subscribers Si , Sj , a new value for the DQ parameter of a data stream is calculated. For example, Di d and Di f have new value equal to min(Sk d) and min(Sk f ) where k ∈ 1 to m, respectively. With this approach, the data stream transmits DiP n using new calculated values, which is less than or equal to Sk n. In Figure 5, data stream D1 is within the sub-space for subscribers S1 and S2 . The data stream D1 is selected for both as per the data quality aware service discovery mechanism. The computed delay and frequency interval for D1 is 50,000 milliseconds and 240,000 milliseconds, respectively. Hence, the number of data points are further reduced from 37 to 20 per 1,000,000 milliseconds. However, to reduce the bandwidth between the cloud server and the subscriber, we do not send extraneous data points to the subscribers. Using above two steps, data stream Di sends Di n data points, which is greater than or equal to Sk n, where k ∈ 1 to m. So we have a second level of quality operators in the cloud server, to send only data points using the selected or annotated data stream. Now, the second level of planning occurs at Data processing and Query layer to send only the requested quality aware data points to the respective subscribers. Therefore, we apply such as filter, sampler, etc. for each subscriber. In the above case, for subscribers Si and Sj , with the second level of query planning, we transmit only data points Si n and Sj n, respectively, from the cloud server. Therefore, we have reduced the number of data transmission P from the cloud server to subscribers from mDi n to Sk n, which is the desired number of data points. In Figure 5, the number of data points transferred to subscriber S1 and S2 is
Fig. 6: Illustration of failure resilience and adaptations.
20 and 17, respectively. By using the above mentioned approaches we are able to meet the needs of all subscribers without losing any DQ aware threshold. Along with that we also reduce the bandwidth consumption of the network between providers and cloud server. We also demonstrate this experiment in section V-D. C. Failure Resilience and Adaptation The most important aspect of this feature is to detect failures of both providers and subscribers and dynamically adapt to the new environment efficiently. Some of the situations in which the provider or the subscriber may stop responding may be fluctuations in network bandwidth, a malfunction of the sensors, the battery drain, power outage, etc. Current systems such as Xively [1] do not address such failures. If the data stream or the provider fails, the subscriber has to manually choose a new data stream again. Our system through Quality monitoring and Subscriber monitoring component, detects faults of both data streams and subscribers respectively. Both of these glitches are reported to Data processing and Query layer and the system performs autonomic computing. Considering DQ-aware aspects, tasks such as choosing a new data stream for an active subscriber, changing the delay time interval and frequency of data streams and updating the status (active / passive) of data streams and subscribers are taken care exclusively by this feature. Our system deploys a very small application at the providers end for each data stream allowing us to control them. With this application, after each polling interval each of the data stream polls to control new value of DQ parameters. Our system initially sets the delay interval for each data stream to 0. This means that the system does not need the data of this data stream. Therefore, we can deduce that if a data stream delay is set to 0, it is in passive state, otherwise in active state. We activate a data stream if and only if a subscriber needs it. Providers such as sensing devices are highly susceptible to failures. We need such a mechanism that maintains a minimum data reception interruption without fail for the subscribers. For minimal disruption, our system continuously monitors each data stream, regardless of their status (active / passive) and autonomously adjust to the new need. We monitor the polling of each data stream. If for any data stream our Quality monitoring detects that it is probing for a certain period of time, we believe that the data stream is not functioning and sets its delay time interval to 0. However, our system was already 300
using this data stream to meet the need of some subscribers. For such scenarios, our system adapts autonomously and select a new data stream for these subscribers with minimal disruption. While performing this task, the subscriber may not receive data for certain time. Our system ensures that the subscriber receives data within their DQ thresholds or report about current data stream failure with no other data streams satisfying the need. If the subscriber is still willing to wait, the system sends the data as soon as we have a data stream for it. In Figure 6, as discussed for previous two features, D1 is selected for both S1 and S2 . The computed delay and frequency interval for D1 is 50,000 milliseconds and 240,000 milliseconds, respectively. If data stream D1 stops functioning properly and our system detects it, then for both subscriber S1 and S2 we need to choose a new data stream. As a result, our system chooses a data stream D2 for both the subscribers as it is within their DQ sub-space. Similarly, subscribers can also be prone to failure especially if they are sensor devices. Our system’s Subscriber monitoring component detects the failure by checking heartbeat of all subscribers after a certain time interval. Once the failure of a subscriber is detected, the count of the number of subscribers is reduced for a data stream of a provider. This way the system can decide whether to keep data stream active or passive. For example, after a failure of subscribers, none are left for a data stream, we set the delay of this data stream back to 0. However, it may be the case that other subscribers are still active in the system and use this data stream, so the system still keeps it in active state. The important task in this case is to calculate new values for the DQ parameters of a data stream. The system will choose minimum value of DQ parameter of all the corresponding subscribers as noted above. Recalling how we choose the DQ parameter value for the data stream, the system may have to compute new values for its DQ aware parameters. In Figure 6, data stream D1 is selected for both subscriber S1 and S2 . The computed delay and frequency interval for D1 is 50,000 milliseconds and 240,000 milliseconds, respectively. If subscriber S1 stops functioning properly and our system detects it, then for data stream D1 the number of subscribers reduces to 1. The new computed delay and frequency interval for D1 is 60,000 milliseconds and 240,000 milliseconds, respectively. Using the mechanism of direct supervision and coordination of the monitoring components with Data processing and Query layer, our system can withstand failures and dynamically make DQ aware adjustments. V.
E XPERIMENTS
In this section, an experimental study of our DQS-Cloud system is presented. The objective of this experiment is to demonstrate: 1) 2) 3)
The dynamic nature of the system. Optimization incurred in terms of number of active data flows and bandwidth consumption. The efficient working of our system.
We have implemented this prototype from scratch in Java using Java SE SDK 1.7. In order to replicate real-world scenario, we have implemented a client-based architecture where the clients are providers and subscribers, while the
TABLE I: List of data streams considered for experiments. Data Streams Frequency Int. Delay Int.
D1 50 150
D2 25 100
D3 30 150
D4 50 100
D5 60 180
D6 10 200
D7 40 120
D8 30 60
D9 45 180
D1 0 35 140
TABLE III: Time taken to choose a new data stream for a subscriber. Num of Data Streams Time taken (ms)
TABLE II: List of subscribers considered for experiments. S1 50 250
S2 60 240
S3 40 200
S4 40 200
S5 50 100
S6 12 240
S7 11 330
S8 30 90
S9 40 80
S1 0 35 140
For the experiments, the server uses i7-3630QM processor Intel Core clock speed of 2.4 GHz machine having main memory of 12GB and a cache memory of 6MB. The machine operates on the platform of Microsoft Windows 8. The publishers and subscribers machines are running on Windows, Linux, and UNIX operating systems. For persistent storage on the server, we have used MySQL 5.6. The provider generates synthetic data for each data streams and stores the data in the lightweight SQLite database in real time. To consider the network latencies we positioned publishers, subscribers and server geographically. A. Reference Tables and Assumptions In all experiments below, we consider data streams and similar subscribers, so there will be at least one possible match for each subscriber. We assume that all data quality parameters are satisfied except for the frequency and delay interval. Table I and II shows the data streams and subscribers are used for experiments along with their corresponding frequency and delay time intervals. All mentioned time intervals are in terms of seconds. B. Time taken to send first data point to subscriber In general, the subscriber has to manually select an active sensor feed from the list of sensor feeds as in the case of Xively [1]. Also, the subscriber does not know when it will receive its first data point. Whereas, our system has an ability to choose a data stream on the fly and send the subscriber first data points as discussed below:
2)
10 26
50 26
DATA STREAM OPTIMIZATION
server is our cloud server. All providers, subscribers and server are on different machines of different platforms to consider heterogeneous environment.
1)
5 26
12
When the selected data stream is passive, the first step is to make the data stream active and then the active data stream sends data according to the delay time calculated by the Data processing and Query layer. Since the clocks are not synchronized, the time needed would be two times of the delay time of the subscriber in the worst case. If the data stream selected for the subscriber is already active, then the time taken would be equal to the time delay of the subscriber.
Referring to Table I and II, initially assuming all data streams as passive. For the subscriber S1 , system will chose data stream D6 . Therefore, S1 will receive its first data point after twice its delay, i.e. 500 seconds. While when the 301
10
#Data Streams Active
Subscriber Frequency Int. Delay Int.
2 25
8 6
Basic-System DQS-Cloud
4 2 0 2
4
6
8
10
#Subscribers
Fig. 7: Data Streams Optimization
subscriber S2 processing data stream D6 is already active and can satisfy its query, S2 will receive first data point after 240 seconds. Similarly at the time of the failure of current data stream, subscriber will receive next data points in the same manner as above. Table III shows the amount of time it took to choose a new data stream for a subscriber by varying number of data streams and the fixed number of subscribers. C. Data Streams Optimization In this experiment, we demonstrate that our system minimizes the number of active data stream while meeting the needs of all subscribers. Figure 7 shows the comparison with the basic system. In general, it is considered that for each subscriber a new data stream will be selected. Whereas in our system, using DQ aware catalogs and Metadata, the data stream which is already active is chosen and new delay and frequency interval is calculated to meet the need of the subscriber. If there is no active data stream which can accomplish that, we chose the data stream with the lowest frequency that satisfies the delay time from the list of data streams. Looking at Table I and II, and assuming that initially all providers are registered and passive. Figure 7 shows the number of providers that were activated when processing each subscriber. The active data stream at the end of processing all subscribers can be referred from the Table IV. TABLE IV: Active data stream after processing all subscribers. Data Stream Frequency Int. Computed Delay Int. Computed
D2 50 100
D6 11 200
D8 30 80
Here, we show that due to optimizations of data streams, autonomic computations of new delay and frequency interval, and decision to promote some query operations to the provider for the data streams, the DQS-Cloud system can reduce the number of data points transmitted from the provider to the server. We consider the bandwidth consumption of the network in terms of number of data points transmitted from the data streams to the server in the time interval of 1000 seconds. In a basic system, in the worst case, for n subscribers, n data streams will be selected. Therefore, the data points are transferred to each of the subscribers through their respective data streams. So the number of data points is the sum of all data points required by the subscriber.
Despite of data quality aware techniques, memory utilization at the provider for both basic and DQS-cloud system came out to be same. Because of data streams and bandwidth optimization, cloud server uses less in-memory buffer storage with reduced database interaction and less processing power. CPU UTILIZATION AT PROVIDER 30
Basic-System DQS-Cloud
25
CPU Utilization (%)
D. Network Bandwidth Optimization
BANDWIDTH OPTIMZATION
20 15 10
5
400 0 10
20
30
40
50
100
150
200
#Datastreams
300 250 200
Fig. 9: CPU Utilization at provider
Basic-System DQS-Cloud
150
In terms of CPU utilization, for basic system, all data streams are considered as active, hence they continuously transmit the data as per DQ parameters. Whereas, in our system, only few data streams are active and some operators are pushed to the provider for each to reduce extraneous data points. CPU utilization is considerably low at both the provider and the cloud server. This is also due to the need of few data stream monitoring. Figure 9 and 10 shows CPU utilization at the provider and server, respectively.
100 50 0 1
2
3
4
5
6
7
8
9
10
#Subscribers
Fig. 8: Data Points Optimization Referring to Table I and IIand Figure 8, it can be said, for the basic system if all 10 subscribers are active, then 370 data points are needed continuously in real time to the cloud server within 1000 seconds. Whereas in our system, the same data stream is used to meet need of many subscribers. Our system receive only 145 data points to meet the needs of these subscribers. E. CPU and Memory Utilization Here, it is shown that because of all the optimization we have incurred in our system, we have gained a significant performance in terms of CPU and memory utilization. We compare our system against the basic system, which has DQ parameters but not the data quality aware techniques. We generate synthetic data at the provider for each data stream, in order to replicate the real world scenario. The provider can receive data either from itself or from other sensor devices. This data is stored in the SQLite database. Therefore, for each sensor data stream, there are two corresponding process, first, to generate data points, and second, to interact with the cloud server. For this experiment, all the data streams are running on a single provider, which is acting as a gateway, so we captured the CPU and memory utilization of the provider and the cloud server. 302
CPU UTILIZATION AT SERVER 16
Basic-System DQS-Cloud
14 12
CPU Utilization (%)
#Data Points Received
350
10 8 6 4 2 0 10
20
30
40
50
100
150
200
#Datastreams
Fig. 10: CPU Utilization at Cloud server
VI.
R ELATED W ORK
There has been considerable research work done in the area of wireless sensor network and stream processing engines that can be considered as predecessor to our work but not in true sense. Wireless sensor network (WSN) has a network of several sensors connected in a fashion that enables data to reach to the base station. Several research questions such
as network formation, storage, in network processing, localization, debugging have been studies to the depth. However, WSN has not been designed to share the data across geographic region. An important contribution to make the sensor data available is undertaken by projects like IrisNet [9] and Sensor web [10]. These framework define a suite of web service interface and communication protocol to deliver the data to the consumer. Similarly, data stream processing engines and event processing engines such as Aurora [13], Borealis [12], StreamBase [26], Esper [27] are also related to our projects. In this era of Internet, ”Internet of Things” or ”Cloud of Things” is a novel paradigm which is rapidly gaining popularity in the world of wireless technology and sensor web. The basic idea all the things are connected and can communicate with the cloud. Xively [1] is an early attempt in this area which supports uploading and downloading of real time data using RESTful APIs. However, issues such as providing sensor data to internet scale as service, sensor feed discovery, sensor feed composition and interoperability are not adequately addressed. Also, they do not include the data quality aspect in the infrastructure for sensor Data as a service. We believe that DQS-Cloud is the first ever effort towards this direction which provides data quality aware real-time data marketplace cloud service. VII.
C ONCLUSION
It is expected that the Internet of Things paradigm will lead to servitization of the field of domain sensing. However, there is lack of effective infrastructure for supporting such servitization. This paper presented the design of DQS-Cloud, which is a novel cloud based framework for real-time sharing and discovery of sensor feeds. The concept of data quality (DQ) is central to the design of DQS-Cloud in the sense that it drives most key techniques of the framework. DQS-Cloud incorporates three unique features, namely a DQ aware sensor discovery techniques, a DQ aware technique for planning of feed processing workflows and a DQ aware fault tolerance mechanism. Our experiments show that the DQS framework is very effective in delivering appropriate sensor feeds to sensor data consumers while minimizing consumption of valuable resources such as bandwidth and CPU. ACKNOWLEDGEMENT This research has been partially funded by the National Science Foundation under Grant Number CNS-1338276. Any opinions, findings, and conclusions or recommendations expressed in this material are those of the authors, and do not necessarily reflect the views of the NSF.
[5]
M. Balazinska et al., ”Data management in the worldwide sensor web,” IEEE Pervasive Computing, vol. 6, no. 2, 2007.
[6]
D. H. Kim et al., ”Sensloc: sensing everyday places and paths using less energy,” in SenSys, 2010.
[7]
S. Madden et al., ”Tinydb: an acquisitional query processing system for sensor networks,” ACM Trans. Database Syst., vol. 30, no. 1, 2005.
[8]
S. Madden, ”Database abstractions for managing sensor network data,” Proceedings of the IEEE, vol. 98, no. 11, 2010.
[9]
E. Wilde, ”Making sensor data available using web feeds,” in IPSN Proceedings, 2009.
[10]
A. P. Sheth, C. A. Henson, and S. S. Sahoo, ”Semantic sensor web,” IEEE Internet Computing, vol. 12, no. 4, 2008.
[11]
L. Li and K. L. Taylor, ”A framework for semantic sensor network services,” in ICSOC, 2008.
[12]
D. J. Abadi, ”The design of the borealis stream processing engine,” in Proceedings of CIDR, 2005.
[13]
Aurora, ”a new model and architecture for data stream management,” in the VLDB Journal vol. 12, issue 2, pages 120-139, August 2003.
[14]
D. Carney et al., ”Monitoring streams: A new class of data management applications,” in Proceedings of VLDB, 2002.
[15]
L. Brenna et al., ”Cayuga: a high-performance event processing engine,” in SIGMOD Conference, 2007.
[16]
”Sensor Modeling Language (SensorML),” http://www. opengeospatial.org/standards/sensorml.
[17] [18]
”WaterML 2.0 SWG,” groups/waterml2.0swg.
[19]
”IBM InfoSphere Streams Information http://pic.dhe.ibm.com/infocenter/streams/v2r0/index.jsp.
[20]
A. R. Bharambe et al., ”Mercury: supporting scalable multiattribute range queries,” in SIGCOMM, 2004.
[21]
F. Chang et al., ”Bigtable: A distributed storage system for structured data,” ACM Trans. Comput. Syst., vol. 26, no. 2, 2008.
[22]
A. Arasu et al., ”Stream: The stanford stream data manager,” IEEE Data Engineering Bulletin, 26(1), 2003.
[23]
Lakshmish Ramaswamy, Victor Lawson, and Siva Venkat Gogineni, ”Towards a Quality-centric Big Data Architecture for Federated Sensor Service,” BigData Congress, page 86-93. IEEE, (2013)
[24]
R EFERENCES
”TransducerML,” http://www.ogcnetwork.net/infomodels/tml. http://www.opengeospatial.org/projects/
Center,”
Infochimps, ”Big Data - Cloud Services”, http://infochimps.com
[25]
The Windows Azure Marketplace, ”Online market for buying and selling finished Software as a Service (SaaS) applications and premium datasets,” http://datamarket.azure.com
I. Akyildiz and M. Vuran, ”Wireless sensor networks”, Wiley, 2010, vol. 4.
[26]
StreamBase Systems, ”The leader in high performance Complex Event Processing (CEP),” http://www.streambase.com.
[3]
J. Stankovic, ”Wireless sensor networks,” Computer, vol. 41, no. 10, 2008.
[27]
Esper, ”Complex Event http://esper.codehaus.org/.
[4]
S. Nath et al., ”Irisnet: An architecture for internet-scale sensing services,” in VLDB, 2003.
[1]
Xively-”Intenet of Things Platform”, https://xively.com.
[2]
303
Processing
(CEP)
system,”