COASTAL DYNAMICS ‘01
Reprinted from Coastal Dynamics ‘01 Proceedings of the conference American Society of Civil Engineers Held June 11-15, Lund, Sweden
SUSPENDED SEDIMENT AND MORPHOLOGICAL RESPONSE ON BANZU TIDAL FLAT, JAPAN 1
2
Yusuke Uchiyama , Yoshiaki Kuriyama and Kazumasa Katoh
3
Abstract: A short-term field observation was conducted to investigate
hydrodynamics, sediment suspension and morphological processes on an intertidal flat. The topography on the tidal flat was found to fluctuate by about 8 cm during two weeks although long-term accumulation rate was estimated to be only about 4 cm/y. Suspended sediment concentrations were highly correlated with bed shear stress due to tidal current, windinduced current and wave. Episodic erosions were frequently observed with high turbidities, which were caused by relatively high wave and strong current between the high water and the mean water during ebb tide.
INTRODUCTION
For preservation and rehabilitation of ecosystems on tidal flats, wetlands and salt marshes, prediction of topography change is a significant engineering issue (Paterson 1989). The intertidal sediments provide an important habitat to their resident infauna, which acts as a food resource for large communities of shorebirds (Ferns 1983). Even when slight erosion, which may be negligible on sandy beaches, occurs on tidal flats, the impact of the erosion on the resident benthos is preconceived to be remarkably serious (Kakino 2000). The understanding of in situ morphological response of flats and wetlands to their environments including waves and currents is a prerequisite for the formation of conceptual and quantitative models that are essential to allow effective management of the intertidal area.
1) Research Scientist, Littoral Drift Laboratory, Marine Environment Division, Port and Harbour Research Institute, 3-1-1 Nagase, Yokosuka 239-0826, Japan.
[email protected] 2) Chief, Littoral Drift Laboratory, Marine Environment Division, Port and Harbour Research Institute, 3-1-1 Nagase, Yokosuka 239-0826, Japan.
[email protected] 3) Director, Hydraulic Engineering Division, Port and Harbour Research Institute, 3-1-1 Nagase, Yokosuka 239-0826, Japan.
[email protected]
1038
COASTAL DYNAMICS ‘01
1039
Tokyo Bay
N
Tokyo Yokohama Sea of Japan
35 o 30' N
Japan
Hasaki
Yokosuka
Pacific Ocean
50km
0
140 o 00' E
10m
Tokyo Bay Aqua Line (bridge)
5m 0m
5m
BAUZU TIDAL FLAT
N
A'
1
A
Kisarazu Stn.2 Stn.1
15m 0
Obitsu RIver
2
(km) 10m
5m 0m passage
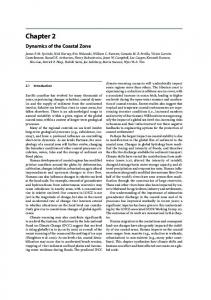
Fig.1: The location of the Banzu intertidal sand-flat, Tokyo Bay (Japan). Bed profiles were surveyed along the reference line A-A’ in the vicinity of the Obitsu River mouth.
Recently, tremendous efforts have been made to understand the sediment transport processes on mudflats located in the Humber Estuary, UK (Christie, et al. 1999), Severn Estuary, UK (O’Brien et al. 2000), and Baie de Marennes-Oleron, France (Bassoullet et al. 2000). Some studies have examined the physical forcings that control mudflat morphological processes and hydrodynamics with considering tidal current, wind-induced current, wave action, density-driven circulation, and drainage processes (e.g., Le Hir et al. 2000). As suggested by Christie et al. (1999), sediment transport processes on tidal flats occur over a variety of timescales, ranging from seconds to seasons. The combination of these processes with different timescales controls the overall development of the intertidal area. Short-term topography changes on tidal flats have been reported to be small on the whole (e.g., Christie et al. 1999), and thus significant hydrodynamics and associated morphological processes have not been observed in previous studies. However, episodic processes are important and can produce infrequent but substantial effects; storms may produce the equivalent of several years’ sediment movement during one
COASTAL DYNAMICS ‘01
1040 Stn.1
Stn.2 ultra sonic wave gauge sand surface meter
electro-magnet current meter turbidity meter
4.5m 10cm 1.5m
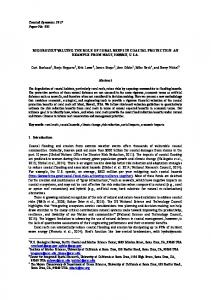
Fig.2: Instrumentation layouts (left: Stn.1, right: Stn.2).
tidal cycle. West and West (1991) suggested significant short-term topography change have occurred in the Severn Estuary in the order of 10 – 30 cm. Hence, morphodynamic processes on tidal flats not only in long term but also in short term are strongly required to be understood although short-term topography changes have not been fully studied yet. The prime objective of the present study is to measure significant episodic topography changes on a tidal flat, and to investigate the mechanism of erosions with estimating bed shear stress due to wave, tidal current and wind-induced current. This contribution also examines hydrodynamics, sediment suspension and short-term morphodynamic process in contrast with long-term topography change. FIELD MEASUREMENT
A field measurement was performed for 16 days, February 7 – 22, 2000, on a tidal flat to investigate short-term topography change, suspended sediment concentration, and physical forcings including tide, wave, current, wind and river discharge. The Banzu intertidal sand-flat, which is a well-mixed semi-diurnal mesotidal sand-flat situated on the eastern shore of Tokyo Bay, Japan, was chosen to conduct the field measurement (Figure 1). The Banzu flat has an intertidal area of 7.6 km2, and the maximum tidal range is about 2.0 m during spring tides. Bottom sediments in the study site are characterized by well-sorted fine sand with a median grain size of 0.19 mm. A preliminary study showed that tidal exchange is the major source of solutes although the Obitsu River mouth is adjacent to the study site. Direct freshwater discharge from the river into the flat was reported to be so small during the measurement that the effects of the river outflow are negligible in the present analyses (Uchiyama 2000). Instrumentation layouts at two monitoring stations are illustrated in Figure 2. At Stn.1, water surface elevation was measured using an ultrasonic wave gauge (KENEK Co., Ltd.) mounted at a height of 4.5m from the bed at a sampling frequency of 5 Hz, and a photoelectric sand-surface meter (SPM-7, Sanyo Sokki Co., Ltd.) was installed to monitor bottom elevation at 10 minutes intervals. At Stn.2, an optical-backscatter turbidity meter (MTB-16K, Alec Electronics Co., Ltd.) and a three-dimensional electro-magnetic current meter (ACM-16M, Alec Electronics Co., Ltd.) were installed to measure suspended sediment concentration and current velocity near the bed at a frequency of 2 Hz. In addition, water level of the Obitsu
COASTAL DYNAMICS ‘01
1041
300
1.3
250 200
1.1 ∆h
0.7
-0.04
0.5
0.00
0.3
Stn.2 200
400 600 800 distance offshore (m)
Stn.1 1000
+0.04 1200
∆ V (m 3 /m)
-0.08
0.9
0.1 0
R=0.833
Feb. 7, 2000 Feb. 22, 2000
∆ h (m)
seabed level (T.P., m)
1.5
150 100 50 0 -50
Fig.3: Bottom profiles along the reference line A-A’ surveyed on Feb.7 and 22, 2000, and their difference, ∆ h.
-100
1994 1995 1996 1997 1998 1999 2000 year
Fig. 4: Long-term accumulation.
River was measured by Chiba Prefecture at 1-hour intervals at the point 5.6 km upstream from the river mouth, and wind velocity was monitored every hour by Japan Meteorological Agency at Kisarazu, about 3.0 km north of the study site. RESULTS AND DISCUSSION Short-term and Long-term Topography Change
Figure 3 shows bottom profiles surveyed on February 7th and 22nd along the reference line A-A’ illustrated in Figure 1, and their difference, ∆ h. The profile of the Banzu flat has a mean slope of about 1:1850, and ∆ h is considerably small. Furukawa et al. (2000) exhibited a series of bottom topography data of the Banzu flat measured along the reference line A-A’ since October 1994. Utilizing their data, we computed long-term variation of the volume of bottom sediment along the reference line A-A’ per unit alongshore length based on that in October 1994, of which result is shown in Figure 4. It is clearly demonstrated that the Banzu flat is gradually accreting in the long term at about 45 m3/m/y. Divided by the length of the reference line, 1,200m, this can be converted into the space-averaged long-term accumulation rate of bed level, 3.8 cm/y. Figure 5 shows time series of seawater elevation averaged for 30 minutes (i.e., tidal elevation) and bottom elevation at Stn.1, and that of turbidity averaged for 10 minutes at Stn.2. The spring-neap-spring tidal cycle and diurnal inequality can be clearly seen in the tide data. The seabed was eroded by about 8 cm in the first three days, and then gradually recovered to the initial elevation with having small erosions and accumulations. Whenever the seabed was eroded, appreciably high turbidity was observed; this fact seems to exhibit that there is a strong relation between the high turbidity and erosion. Hydrodynamics
Figure 6 shows significant wave height (H1/3) and period (T1/3) at Stn.1, and principal wave directions estimated with covariance of the current data. Figure 7 represents wind velocity vectors at Kisarazu, and time-averaged horizontal-current
0.85
2.6 2.1
0.81
1.6
0.77 60
1.1 tide
0.6 0.1
30
turbidity 7
8
9
10
11
12
13 14 15 16 date (Feb., 2000)
17
18
19
20
21
22
0
turbidity (ppm)
tide (T.P., m)
bed level
seabed level (T.P., m)
COASTAL DYNAMICS ‘01
1042
direction
1.0 0.8 0.6 0.4 0.2 0.0 W N E S
7
8
9
10
11
12
5 4 3 2 1 0
T1/3 (s)
H1/3 (m)
13 14 15 16 date (Feb., 2000)
17
18
19
20
21
T1/3 (s)
H1/3 (m)
Fig.5: Bottom elevation and tide level at Stn.1, and turbidity at Stn.2.
22
Fig.6: Significant wave height, H1/3, and period, T1/3, at Stn.1, and principal wave directions. 10 m/s
wind
N
current depth (m)
30 cm/s
N
1.0 0.5 0.0
7
8
9
10
11
12
13 14 15 16 date (Feb., 2000)
17
18
19
20
21
22
Fig.7: Wind velocities at Kisarazu, and current velocities and water depth at Stn.2.
velocity vectors and water depth at Stn.2. The wave condition was relatively severe at the beginning of the observation since the wave height reached 0.8 – 0.9 m with a period of about 4 s. Mild condition was found in the next five days, followed by medium condition in the later half. The principal wave direction was from N or NNW; this means that the waves propagated mostly alongshore. The wave height was likely fluctuated according to the water depth variation (tide, in Figure 5) since it appeared to be high during high waters and low during low waters. Moreover, since the principal wave direction roughly coincided with the
COASTAL DYNAMICS ‘01
10 5
10 2
10 4
10 1 10 0
Wn-s H 1/3
10 -1
0.5
10 4
10 2
10 3
10 1
10 2
10 0
10 1
H 1/3 η
10 0
0.5
0.0
0.0
π /2 π /4 0 - π /4 - π /2 -3 10
π /2 π /4 0 - π /4 - π /2 -3 10
phase(rad)
phase(rad)
10 5
10 3
10 -1 1.0 coh 2
10 2 1.0
24h12h
spectrum of η (m 2 s)
10 3
10 4
2
10 6
10 3
coh 2
10 4
spectrum of H 1/3 (m 2 s)
24h12h
spectrum of H1/3 (m s)
2
spectrum of Wn-s (m /s)
10 7
1043
-2
-1
10 10 frequency (1/h)
(a) H1/3 & Wn-s
10
0
-2
-1
10 10 frequency (1/h)
10
0
(b) H1/3 & η
Fig.8: Cross spectra between (a) significant wave height, H1/3, and N-S component of wind velocity, Wn-s, and (b) H1/3 and η (tide: water depth at Stn.2).
wind directions, the waves seem to be influenced also by the wind. Therefore, to determine the contributions of the wind velocity and the tide to the development of H1/3, cross-spectral analyses were subsequently conducted. Figure 8 shows the cross spectra between (a) significant wave height, H1/3, and N-S component of wind velocity, Wn-s, and (b) H1/3 and η (tide: water depth at Stn.2). It is shown that H1/3 is appreciably correlated with η through a broad frequency band with almost no phase lag. In contrast, coherence between H1/3 and the wind velocity is widely low, while it is slightly high at low frequencies. These results demonstrate that the short-term variation of H1/3 was caused by the water depth variation due to the tide, while H1/3 fluctuated in the long-term mostly in response to the variations of the water depth and the wind velocity. Next, causes of the variation of the horizontal current velocity were investigated. As shown in Figure 7, the horizontal current velocity appears to vary in the long term in response to the fluctuations of the wind velocity and the wave height. The current field on the flat was also significantly influenced by the tide since the semi-diurnal inversions in the current directions occurred with the tidal oscillations. As a result, the currents on the Banzu tidal flat would be affected by the wind, the tide and the wave. Figure 9 shows the cross spectra between (a) Wn-s and Un-s, (b) H1/3 and Un-s, and (c) η (tide: depth at Stn.2) and Un-s. The power spectral density of Un-s has an intense peak in the vicinity of the semi-diurnal period (T = 12 h), while it is relatively low over periods longer than 24 h. The distinct peaks at the semi-diurnal period can be also found in the spectra of η and H1/3 yet there exists no peak in the wind velocity spectrum. The estimated coherences exhibit that the current is remarkably correlated with η and H1/3 at a period of 12 h. On the contrary, the coherence between Wn-s and Un-s becomes high over periods longer than about 24 h, while the long-period component of Un-s does not have so high correlation with the wave height and the
COASTAL DYNAMICS ‘01
10 6
10 4
10 5 10 4
Wn-s Un-s
10 3
10 2
10 6
10 1
10 5
10 0
10 4
H 1/3 Un-s
10 3
10 -1 1.0 coh
2
phase (rad) -2
-1
10 10 frequency (1/h)
(a) Wn-s & Un-s
10
0
π /2 π /4 0 - π /4 - π /2 -3 10
10 4
10 7
10 3
10 6
10 2
10 5
10 1
10 4
η Un-s
10 3
10 0 1.0 0.5 0.0
0.0
π /2 π /4 0 - π /4 - π /2 -3 10
0.5
10 8
π /2 π /4 0 - π /4
phase (rad)
coh
0.5 0.0
phase (rad)
10 7
2
10 2 1.0
10 3
24h12h
spectrum of Un-s (cm 2 /s)
10 5
10 5
10 8
spectrum of η (m 2 s)
10 7
24h12h
coh 2
10 6
10 3
10 4
10 8
spectrum of H 1/3 (m 2 s)
24h12h
spectrum of Un-s (cm 2 /s)
2
spectrum of Wn-s (m /s)
10 7
spectrum of Un-s (cm 2 /s)
1044
-2
-1
10 10 frequency (1/h)
10
0
(b) H1/3 & Un-s
- π /2 -3 10
-2
-1
10 10 frequency (1/h)
10
0
(c) η & Un-s
Fig.9: Cross spectra between (a) Wn-s and Un-s, (b) H1/3 and Un-s, and (c) η and Un-s.
tide. Consequently, the wind velocity mainly affected the current field on the Banzu flat in the diurnal or longer-period fluctuations, and the tide and the waves induced the semi-diurnal or shorter-period fluctuations of the current velocity. Bed Shear Stress
Although wave and current are responsible for advection and dispersion processes of the sediment transport on tidal flats, bottom sediments are in general suspended directly by shear stress near the seabed. Thus we next estimated the bed shear stresses to investigate the mechanism of sediment suspension on the Banzu flat. While various methodologies for evaluating the bed shear stress have been proposed, we choose an approach in which the bed shear stress is estimated with Reynolds stresses calculated with the fluctuating components of the current velocity (e.g., Dyer and Soulsby 1988, French and Clifford 1992). Figure 10 shows time series of the bed shear stress, τb, and the turbidity measured at Stn.2. Because the temporal variations of the turbidity correspond to τb fluctuation, it is verified that the high turbidities, occurred intermittently, were generated by the bed shear stress. In addition, τb and the turbidity are highly correlated with having the correlation coefficient of R = 0.861 (Figure 11). The regression equation, which is represented by the solid line in Figure 11, is expressed as C s = 1.26 × 10 1 × τ b + 3.16 × 10 −1 ,
(1)
where Cs is suspended sediment concentration (ppm). Next, types of bottom sediment movement during the measurement are examined. Previous studies have reported that types of sediment movement is related to the Shields number, Ψm, which represents non-dimensional bed shear stress under oscillatory flow (e.g. Shibayama and Horikawa 1982). The relationship between Ψm
COASTAL DYNAMICS ‘01
10 8 6 4 2 0
0 40 80 7
8
9
10
11
12
13 14 15 16 date (Feb., 2000)
17
18
19
20
21
turbidity (ppm)
shear stress (N/m2 )
1045
22
Fig.10: Bed shear stress (solid line) and turbidity (dotted line) at Stn.2.
70
R=0.861
turbidity (ppm)
60 50 40 30 20 10 00
1
2 3 τ b (N/m 2 )
4
5
Fig.11: Correlations between the bed shear stress, τb, and turbidity.
turbidity (ppm) shear stress (N/m 2 )
current 7 6 5 4 3 2 1
100 50 0 -3
10 m/s N
20 cm/s tide
H1/3(m) 0.9
H1/3
0.6
2.6 2.2 1.8 1.4
shear stress
-2
-1 0 1 elapsed time, t (h)
tide (T.P., m)
wind
1.0
2
3
Fig.12: Ensemble averaged values when the turbidity was in excess of 50 ppm.
and τb is given by Ψ m = u * 2 ( ρ s ρ − 1) d g = τ b
(ρ s − ρ ) d g ,
(2)
where u* is the bed friction velocity (m/s), ρ s and d are the density and median grain size of the bottom sediment (2690 kg/m3 and 0.19mm), ρ is the water density, and g is the gravitational acceleration (9.80 m/s2). By converting the previously proposed threshold Shields numbers into τb using equation (2), we obtain τb ≈ 0.2 (N/m2) for the lowest value for the generation of bed load and τb ≈ 0.6 (N/m2) for the lowest value for the transition to suspended load. As shown in Figure 11, whenever the turbidity is appreciably high, τb is much greater than 0.6. In summary, suspended load dominated the sediment transport when high turbidity was observed during the measurement. Phase of High Turbidity
To investigate the phase when the high turbidity was produced, we conducted conditional samplings to estimate the ensemble averages of the following values for events in which the turbidity exceeded 50 ppm; the values are the wind velocity, the
1046
COASTAL DYNAMICS ‘01
current velocity, the tide level, the significant wave height, and the turbidity. The conditional samplings were made for five events appeared at 21:00 on February 8th, 8:20 and 19:40 on 9th, 12:40 on 15th, and 18:10 on 21st. The evaluated ensemble averages are displayed in Figure 12, in which the time when the peak of turbidity occurred is adjusted to be at the elapsed time t = 0 h for each time series. It is obviously indicated that the wind velocity, the current velocity and the bed shear stress are high near the peak phase of the turbidity. The peak phases of the wave height and the tide level, however, are shifted later from that of the turbidity. The turbidity is high during the ebb started at around t = −1.5 h, and reaches the highest value between the high water and the mean water. In contrast, the wave height, which is normally considered to be a main cause of the bed shear stress, has the peak at about the high water because it fluctuated in response to the tide as shown in Figure 8 (b). If only the waves were predominant for producing the bed shear stress, the peak of the turbidity would not significantly lag behind the high water phase. This discrepancy between the peak phase of the turbidity observed and that of the wave height is attributed to the tide and the wind. In general, tidal current has its maximum values in the middle of the flood tide and the ebb tide. Hence, the tidal current and the resultant bed shear stress are strongest at about 3.0 h after the high water and the low water if the semi-diurnal tide dominates as in the study site. As a result, the velocity of wave-driven oscillatory flow varying in response to the tidal elevation combined with the tidal current velocity becomes strongest at 1.5 h before/after the high water. The inferred phase lag, 1.5 h, exactly agrees with the results of the field measurement indicated in Figure 12. Furthermore, because the wind direction coincided with the ebb current direction, drifting mainly from NNW to SSE, the wind accelerated the tidal current only during the ebb tide. Therefore, the high turbidity was produced at 1.5 h after the high water during the ebb tide, between the high water, when the wave had a peak, and the mean water, when the tidal current had a peak. This result exhibits that the tide plays a key role in the sediment suspension on the tidal flat. CONCLUSIONS
The results of a 16-day study of hydrodynamics, sediment suspension and topography change and a 5-year survey of bed levels have demonstrated that the Banzu intertidal sand-flat has a morphological process consisting of a long-term gradual accretion and short-term episodic erosions and the following accumulations. The topography of the tidal flat fluctuated by approximately 8 cm during the 16-day measurement in winter 2000 with the significant wave height in excess of 0.8 m, which was relatively large for shallow waters in Tokyo Bay, although the long-term accumulation rate is estimated to be only about 3.8 cm/y. The short-term topography change is found to highly correlate with sediment suspension. Episodic erosions occurred with high turbidity, which was caused by the combination of relatively high wave and strong tidal current accelerated by the wind between the high water and the mean water during the ebb tide. Hence, the tide has a significant importance to hydrodynamics and associated morphological process on the tidal flat.
COASTAL DYNAMICS ‘01
1047
ACKNOWLEDGEMETNS
We are grateful for K. Furukawa of Port and Harbour Research Institute (PHRI) for his agreement to refer to the long-term topography data of the Banzu tidal flat. Thanks are also due to T. Nakashima, T. Fujino and M. Nomura of PHRI for their earnest supports in the field measurement. REFERENCES
Bassoullet, Ph., Le Hir, P., Gouleau, D. and Robert, S. 2000. Sediment transport over an intertidal mudflat: field investigations and estimation of fluxes within the “Baie de Marennes-Oleron” (France). Continental Shelf Research, 20, 1635 – 1653. Christie, M.C., Dyer, K.R. and Turner, P. 1999, Sediment flux and bed level measurements from a macro tidal mudflat, Estuarine, Coastal and Shelf Science, 49, 667 – 688. Dyer, K.R. and Soulsby, R.L. 1988 Sand transport on the continental shelf, Annual Review of Fluid Mechanics, 20, 295 – 324,. Ferns, P.N. 1983, Sediment mobility in the Severn Estuary and its influence upon the distribution of shorebirds, Canadian Journal of Fisheries and Aquatic Science, 40 (Supp.1), 331 – 340. French, J.R. and Clifford, N.J. 1992. Characteristics and event-structure of near-bed turbulence in a macrotidal salt-marsh channel, Estuarine, Coastal and Shelf Science, 34, 49 – 69. Furukawa, K., Fujino, T., Miyoshi, T., Kuwae, T., Nomura, M., Hagimoto, Y. and Hosokawa, Y. 2000. Topographical change on tidal flats – case study on Banzu natural tidal flat and Nishiura constructed tidal flat –. Technical Note of the Port and Harbour Research Institute, 965, 1 – 30. (in Japanese) Kakino, J. 2000. Dispersal of Japanese littleneck clam Ruditapes philippinarum (Adams and Reeve) in relation to changes of bottom level due to wave action on Banzu tidal flat, Tokyo Bay. Fisheries Engineering, JSFE, 37 (2), 115 – 128. Le Hir, P., Roberts, W., Cazaillet, O., Christie, M., Bassoullet, P. and Bacher, C. 2000. Characterization of intertidal flat hydrodynamics. Continental Shelf Research, 20, 1433 – 1459. O’Brien, D.J., Whitehouse, R.J.S. and Cramp, A. 2000. The cyclic development of a macrotidal mudflat on varying timescales. Continental Shelf Research, 20, 1593 – 1619. Paterson, D.M. 1989. Short-term changes in the erodibility of intertidal sediments related to the migratory behaviour of epipelic diatoms, Limnology and Oceanography, 34, 223 – 234. Shibayama, T. and Horikawa, K. 1982. Sediment transport and beach transformation, Proceedings of 18th Coastal Engineering Conference, ASCE, 1439 – 1458. Uchiyama, Y. 2000. Suspended sediment and morphological response on Banzu intertidal sand-flat, Tokyo Bay, Japan. Report of the Port and Harbour Research Institute, 39 (3), 3 – 18. (in Japanese) West, M.S. and West, J.R. 1991. Spatial and temporal variations in intertidal zone properties in the Severn Estuary, UK, In: Elliot, M. and Ducrotoy, J.P. (Eds.), Estuaries and Coasts. Alson and Alson, Fredensborg, 25 – 30.