Jun 1, 2013 ... section 57 of the TikZ manual) and assign this number to the count register #2.
The. is executed within a TEX group, so you ...
Drawing Gantt Charts in LATEX with Tik Z The pgfgantt Package
Wolfgang Skala∗ v4.0 2013/06/01
The pgfgantt package provides the ganttchart environment, which draws a Gantt chart within a Tik Z picture. The user may add various elements to the chart, for example, titles, bars, groups, milestones and different links between these elements. The appearance of the chart elements is highly customizable, and even new chart elements may be defined.
Contents 1 Introduction
2
2 User Guide 2.1 Overview . . . . . . . . . . . . . . . . . . . 2.2 Specifying Keys . . . . . . . . . . . . . . . . 2.3 The Canvas . . . . . . . . . . . . . . . . . . 2.4 Line Breaks between Chart Elements . . . . 2.5 Titles . . . . . . . . . . . . . . . . . . . . . 2.6 Predefined Chart Elements . . . . . . . . . 2.6.1 Options: Chart Element Appearance 2.6.2 Options: Label Formatting . . . . . . 2.6.3 Options: Chart Element Positioning 2.6.4 Options: Progress . . . . . . . . . . . 2.6.5 New Node Shapes . . . . . . . . . . 2.7 Defining Custom Chart Elements . . . . . . 2.8 Links . . . . . . . . . . . . . . . . . . . . . . 2.9 Style Examples . . . . . . . . . . . . . . . . ∗
. . . . . . . . . . . . . .
. . . . . . . . . . . . . .
. . . . . . . . . . . . . .
. . . . . . . . . . . . . .
. . . . . . . . . . . . . .
. . . . . . . . . . . . . .
. . . . . . . . . . . . . .
. . . . . . . . . . . . . .
. . . . . . . . . . . . . .
. . . . . . . . . . . . . .
. . . . . . . . . . . . . .
. . . . . . . . . . . . . .
. . . . . . . . . . . . . .
. . . . . . . . . . . . . .
3 3 3 4 10 12 20 23 24 26 29 33 34 36 45
Division of Structural Biology, Department of Molecular Biology, University of Salzburg, Austria;
[email protected]
1
3 Implementation 3.1 Packages . . . . . . . . . . . . . . . . . . 3.2 Macros for Key and Error Management 3.3 The Horizontal and Vertical Grid . . . . 3.4 Time Slot Formats . . . . . . . . . . . . 3.5 The Main Environment . . . . . . . . . 3.6 Starting a New Line . . . . . . . . . . . 3.7 Titles . . . . . . . . . . . . . . . . . . . 3.8 Chart Elements . . . . . . . . . . . . . . 3.9 Node Shapes . . . . . . . . . . . . . . . 3.10 Links . . . . . . . . . . . . . . . . . . . .
. . . . . . . . . .
. . . . . . . . . .
. . . . . . . . . .
. . . . . . . . . .
. . . . . . . . . .
. . . . . . . . . .
. . . . . . . . . .
. . . . . . . . . .
. . . . . . . . . .
. . . . . . . . . .
. . . . . . . . . .
. . . . . . . . . .
. . . . . . . . . .
. . . . . . . . . .
. . . . . . . . . .
. . . . . . . . . .
49 49 49 50 52 55 59 60 66 74 80
4 Index
86
5 Change History
91
1 Introduction The pgfgantt package allows you to draw Gantt charts in LATEX. Thus, you can describe simple project schedules without having to include images produced by external programs. Similar to Martin Kumm’s gantt package1 (which inspired pgfgantt’s fundamental aspects), pgfgantt bases upon pgf and its Tik Z frontend2 . Besides, it provides a comprehensive (and portable) alternative to pst-gantt3 . pgfgantt requires a current pgf installation. Note that the version number must at least be 2.10, dated October 25th, 2010. Furthermore, pgfgantt v4.0 and above is not fully downwards compatible. Acknowledgements I would like to thank Petr Pošík (Czech Technical University in Prague), Raphaël Clifford (University of Bristol), Holger Karl (Universität Paderborn), Jakob Døllner Mønster (Technical University of Denmark), Sascha Yousefi (Universität Freiburg) and Callum Webb for their ideas concerning new features.
1
http://www.martin-kumm.de/tex_gantt_package.php http://ctan.org/tex-archive/graphics/pgf/ 3 http://ctan.org/tex-archive/graphics/pstricks/contrib/pst-gantt/ 2
2
2 User Guide 2.1 Overview To load the package, simply put \usepackage{pgfgantt}
into the document preamble. Compare the following code, which demonstrates some commands provided by pgfgantt, to the output it produces: \begin{ganttchart}{1}{12} \gantttitle{2011}{12} \\ \gantttitlelist{1,...,12}{1} \\ \ganttgroup{Group 1}{1}{7} \\ \ganttbar{Task 1}{1}{2} \\ \ganttlinkedbar{Task 2}{3}{7} \ganttnewline \ganttmilestone{Milestone}{7} \ganttnewline \ganttbar{Final Task}{8}{12} \ganttlink{elem2}{elem3} \ganttlink{elem3}{elem4} \end{ganttchart}
2011 1 2 3 4 5 6 7 8 9 10 11 12
Group 1 Task 1 Task 2 Milestone Final Task
2.2 Specifying Keys Keys (sometimes called options) modify the output from pgfgantt’s commands. You may specify a key in two ways: (1) Pass it to the optional argument present in each command, e. g. \ganttbar[bar height=.6]{Task 1}{1}{2}
3
This locally changes a key for the element(s) drawn by that command. (2) Alternatively, specify a key by the \ganttset{hkey=value listi} macro, which sets its keys within the current TEX group:
\ganttset
\ganttset{bar height=.6}
Since pgfgantt uses the pgfkeys package for key management, all its keys reside in the /pgfgantt/ path. However, if you set your keys by one of the methods explained above, this path is automatically prepended to each key.
2.3 The Canvas Let us have a look at the basic anatomy of a Gantt chart and define some common terms. Each chart consists of several lines, which may contain one or more title elements (at the top) or chart elements (such as bars, groups and milestones). From left to right, the chart is divided into an integer number of time slots that represent the basic x-unit. The ganttchart environment draws a single Gantt chart: \begin{ganttchart}[hoptionsi]{hstart tssi}{hend tssi} ··· \end{ganttchart}
The environment has one optional argument, which specifies the hoptionsi for the chart, and two mandatory arguments, which indicate the start and end time slot specifier. Although you will often put a ganttchart into a tikzpicture environment, you may actually use this environment on its own. pgfgantt checks whether a chart is surrounded by a tikzpicture and adds this environment if necessary. /pgfgantt/time slot format =hformati simple Sets the hformati of time slot specifiers. A time slot specifier (abbreviated “tss”) denotes a certain time slot along the horizontal axis. pgfgantt defines a range of formats: • simple – positive integers (the single format used by pgfgantt prior to v4.0). See also the time slot format/start date key below. Examples: 1, 3, 24 • isodate – dates in ISO-standard format (yyyy-mm-dd). In this format and any other, you may omit the leading zero if month or day are less than 10. Examples: 2013-03-14, 2013-5-1 • isodate-yearmonth – ISO-standard dates without days (yyyy-mm). Such dates are automatically converted to the first day of the respective month. Examples: 2013-03, 2013-5 • little-endian – Gregorian little-endian, i. e. day–month–year (the common German date format). Valid day/month and month/year separators are the
4
ganttchart
hyphen (-), slash (/) and period (.). If you enter a two-digit year (for example, 13 instead of 2013), it will be completed according to the value of time slot format/base century (see below). Examples: 14-03-2013, 14/03/13, 14.3.2013 • middle-endian – middle-endian, i. e. month–day–year (the common US date format). For valid separators and automatic year completion, see little-endian. Examples: 03-14-2013, 03/14/13, 3.14.2013 • big-endian – Gregorian big-endian, i. e. year–month–day (the ISO-standard order). For valid separators and automatic year completion, see little-endian. Examples: 2013-03-14, 13/03/14, 2013.3.14 Two subkeys of time slot format let you configure pgfgantt’s behavior regarding automatic completion of abbreviated dates: /pgfgantt/time slot format/base century =hyear i 2000 Sets the century for auto-completion of two-digit years (used by the time slot formats little-endian, middle-endian and big-endian). Consequently, default settings convert a year like 13 to 2013. /pgfgantt/time slot format/start date =hISO-standard datei 2000-01-01 Numbers denoting time slots in the simple format are internally converted to a date, where 1 is converted to hISO-standard datei, 2 to hISO-standard datei + 1 etc. Advanced users may add their own time slot formats: \newgantttimeslotformat{hnamei}{hconverter codei}
Defines a new time slot format called hnamei. The hconverter codei must convert the time slot specifier stored in #1 to its corresponding Julian day number (see section 57 of the Tik Z manual) and assign this number to the count register #2. The hconverter codei is executed within a TEX group, so you may use temporary macros like \@tempa, counts like \@tempcnta etc. For example, we would like to create a format called stardate, where dates are given as “hyear i.hday of year i”. Thus, we will enter 24th February 2259 as “2259.55”. To this end, we write the following code: 1 \newgantttimeslotformat{stardate}{% 2 \def\decomposestardate##1.##2\relax{% 3 \def\stardateyear{##1}\def\stardateday{##2}% 4 }% 5 \decomposestardate#1\relax% 6 \pgfcalendardatetojulian{\stardateyear-01-01}{#2}% 7 \advance#2 by-1\relax% 8 \advance#2 by\stardateday\relax% 9 }
5
\newgantttimeslotformat
10 11 \begin{ganttchart}[ 12 hgrid, 13 vgrid, 14 time slot format=stardate 15 ]{2259.55}{2259.67} 16 \gantttitlecalendar{year, month=name, day} \\ 17 \end{ganttchart}
2259 February
March
24 25 26 27 28 01 02 03 04 05 06 07 08
The macro \decomposestardate (lines 2–4) has two delimited arguments: The first one is delimited by a period and the second one by \relax. The call in line 5 decomposes the tss stored in #1 and saves the day in \stardateday and the year in \stardateyear. \pgfcalendardatetojulian (section 57.1.1 of the Tik Z manual) calculates the Julian date of the first day of \stardateyear and stores it in #2 (line 6). We then subtract 1 from #2 (line 7) and add the \stardateday (line 8). /pgfgantt/canvas ./style=hstylei shape=rectangle, draw, fill=white The canvas key changes the appearance of the canvas. hstylei is a list of Tik Z keys suitable for the hoptionsi of a Tik Z node (such as shape=rectangle, fill or draw; see chapter 16 of the Tik Z manual). By default, the canvas is a white rectangle with a black frame. \begin{tikzpicture} % optional \begin{ganttchart}[ canvas/.style=% {shape=chamfered rectangle, fill=yellow!25, draw=blue, dashed, very thick} ]{1}{6} \gantttitle{Title}{6} \\ \ganttbar{}{1}{2} \\ \ganttbar{}{3}{6} \end{ganttchart} \end{tikzpicture} % optional
6
Title
/pgfgantt/x unit =hdimensioni .5cm /pgfgantt/y unit title =hdimensioni 1cm /pgfgantt/y unit chart =hdimensioni 1cm These keys specify the width of a time slot and the height of title or chart lines, respectively. Typically, the x/y-dimension ratio approximates 1 : 2, and the line height is equal over the whole chart. Other dimensions are well possible, but you might have to change several spacing-related keys in order to obtain a pleasing chart. \begin{ganttchart}[ x unit=1cm, y unit title=.6cm, y unit chart=1.5cm ]{1}{6} \gantttitle{Title 1}{6} \\ \gantttitle{Title 2}{6} \\ \ganttbar{}{1}{3} \\ \ganttbar{}{4}{6} \end{ganttchart}
Title 1 Title 2
/pgfgantt/hgrid [=false | true | hstyle listi] false /pgfgantt/hgrid style /.style=hstylei dotted /pgfgantt/vgrid [=false | true | hstyle listi] false hgrid draws a horizontal grid which starts immediately below the last title element. The key can be specified in four different ways: Firstly, hgrid=false eliminates the horizontal grid. You may omit this declaration, since it is the default. Secondly,
7
both hgrid and hgrid=true activate the horizontal grid, which is then drawn in the default style dotted. Finally, hgrid=hstyle listi draws the horizontal grid in the given hstyle listi (see below). hgrid style changes the style of single horizontal grid lines that are drawn with \ganttnewline[grid] (see section 2.4). The vgrid key governs the vertical grid; otherwise, use it exactly like hgrid. Style lists allow you to draw the grid lines in different styles. Each style list consists of several style list items separated by a comma. A style list item has the general syntax *{hni}{hstylei} and orders the package to repeat the hstylei hni-times. (This syntax is reminiscent of column specifications in a tabular environment.) Thus, the list *2{red}, *1{green}, *{10}{blue, dashed} instructs pgfgantt to draw first two red vertical grid lines, then a green one and finally ten dashed blue lines. If any grid lines remain to be drawn at the end of the list, the package starts again at the beginning of the list. \begin{ganttchart}[ hgrid=true, vgrid={*2{red}, *1{green}, *{10}{blue, dashed}} ]{1}{20} \gantttitle{Title 1}{20} \\ \ganttbar{}{1}{8} \\ \ganttbar{}{9}{20} \end{ganttchart}
Title 1
In most situations, you can omit the multiplier *1. Hence, the following style lists are equal: {*1{red}, *1{blue, dashed}} {{red}, {blue, dashed}} {red, {blue, dashed}} However, if you wish to use a single style comprising two or more keys for all grid lines, e. g. red, dotted, you must retain the multiplier (i. e., {*1{red, dotted}}).
8
% wrong code
% correct code
\begin{ganttchart}[ hgrid=true, vgrid={{red, dotted}} ]{1}{6} \gantttitle{Title 1}{6} \\ \ganttbar{}{1}{3} \\ \ganttbar{}{4}{6} \end{ganttchart}
\begin{ganttchart}[ hgrid=true, vgrid={*1{red, dotted}} ]{1}{6} \gantttitle{Title 1}{6} \\ \ganttbar{}{1}{3} \\ \ganttbar{}{4}{6} \end{ganttchart}
Title 1
Title 1
In a chart with many time slots, drawing vertical grid lines between all of them will lead to a confusing appearance. In such a case, you can pass an appropriate hstyle listi to vgrid in order to draw every second grid line, for example. \begin{ganttchart}[vgrid={draw=none, dotted}]{1}{12} \gantttitlelist{1,...,12}{1} \\ \ganttbar{}{1}{4} \\ \ganttbar{}{5}{11} \end{ganttchart}
1 2 3 4 5 6 7 8 9 10 11 12
/pgfgantt/today /pgfgantt/today /pgfgantt/today /pgfgantt/today /pgfgantt/today /pgfgantt/today
=htssi none offset =hnumber i 1 rule /.style=hstylei dashed, line width=1pt label =htexti TODAY label font =hfont commandsi \normalfont label node /.style=hstylei anchor=north, font=\ganttvalueof{today label font}
9
Sometimes, you may wish to indicate the current day, month or the like on a Gantt chart. In order to do so, pass an integer value to the today key, which draws a vertical rule at the corresponding htssi. today offset determines the exact y-coordinate in the time slot and should lie between 0.0 (left border) and 1.0 (right border). The today rule appears in the hstylei denoted by today rule. The node that contains the htexti given by today label appears below the rule. It is formatted by today label font and today label node. \begin{ganttchart}[ vgrid, today=2 ]{1}{6} \gantttitle{Title}{6} \\ \ganttbar{}{1}{3} \\ \ganttbar{}{4}{6} \end{ganttchart}
\begin{ganttchart}[ vgrid, time slot format=isodate, today=2013-05-03, today offset=.5, today label=Current Week, today label node/.append style=% {anchor=north west}, today label font=\itshape\color{red}, today rule/.style=% {draw=blue, ultra thick} ]{2013-05-01}{2013-05-06} \gantttitle{Title}{6} \\ \ganttbar{}{2013-05-01}{2013-05-03} \\ \ganttbar{}{2013-05-04}{2013-05-06} \end{ganttchart}
Title
Title
TODAY
Current Week
2.4 Line Breaks between Chart Elements pgfgantt does not automatically begin a new line after finishing a chart element. Instead, you must insert an explicit line break with \ganttnewline. /pgfgantt/newline shortcut =hbooleani true If true, \\ is defined as a shortcut for \ganttnewline within a ganttchart environment, so that the syntax is reminiscent of LATEX’s tabular enviroment. \begin{ganttchart}[hgrid, vgrid]{1}{6} \gantttitle{Title 1}{3}
10
\ganttnewline
\\
\gantttitle{Title 2}{3} \\ \ganttbar{}{1}{3} \ganttnewline \ganttbar{}{2}{3} \ganttbar{}{5}{6} \end{ganttchart}
Title 1
Title 2
However, enabling this shortcut prevents you from entering multi-line node text (see section 16.4.3 of the Tik Z manual). Thus, pgfgantt provides the macro \ganttalignnewline for breaking lines in the node text. \begin{ganttchart}[ hgrid, vgrid, newline shortcut=false, bar label node/.append style=% {align=left} ]{1}{6} \gantttitle{Title}{6} \ganttnewline \ganttbar{% This is a\\ multi-line text.% }{1}{3} \end{ganttchart}
\begin{ganttchart}[ hgrid, vgrid, newline shortcut=true, bar label node/.append style=% {align=left} ]{1}{6} \gantttitle{Title}{6} \\ \ganttbar{% This is a\ganttalignnewline multi-line text.% }{1}{3} \end{ganttchart}
Title
This is a multi-line text. Even if you prefer a canvas without a horizontal grid, you may nevertheless want to separate certain lines by a grid rule. For this purpose, specify the optional argument [grid] for \ganttnewline (or \\), which draws a grid rule in hgrid style between the current and the new line. Alternatively, directly give the desired style as optional argument.
11
\ganttalignnewline
\begin{ganttchart}[hgrid style/.style=red]{1}{12} \gantttitle{Title}{12} \\ \ganttbar{}{1}{3} \ganttnewline[thick, blue] \ganttbar{}{4}{5} \\ \ganttbar{}{6}{10} \\[grid] \ganttbar{}{11}{12} \end{ganttchart}
Title
2.5 Titles A title (comprising one or more lines) at the top of a Gantt chart usually indicates the period of time covered by that chart. For example, the first line could span twelve time slots and display the current year, while the second line could contain twelve elements, each of which corresponds to one month. For these purposes, pgfgantt implements several titling commands. \gantttitle draws a single title element: \gantttitle[hoptionsi]{hlabel i}{hnumber of time slotsi}
The hlabel i appears in the title element, which covers the hnumber of time slotsi starting from the right end of the last title element (or from the beginning of the line, if the title element is the first element in this line). Mostly, you will employ \gantttitle for titles that span several time slots. \begin{ganttchart}[hgrid, vgrid]{1}{12} \gantttitle{2011}{12} \\ \ganttbar{}{1}{4} \ganttbar{}{6}{11} \end{ganttchart}
12
\gantttitle
2011
Whenever you want to draw a larger number of title elements that are equal in size and follow a common enumeration scheme, the \gantttitlelist macro provides a fast solution: \gantttitlelist[hoptionsi]{hpgffor listi}{hlength of each elementi}
This macro generates one title element for each element of the hpgffor listi. The second mandatory argument specifies the hlength of each elementi. Refer to section 56 of the Tik Z manual for the detailed syntax for the hpgffor listi. A simple application is to draw twelve title elements that contain the numbers from 1 to 12. The hpgffor listi is 1,...,12. \begin{ganttchart}[hgrid, vgrid]{1}{12} \gantttitlelist{1,...,12}{1} \\ \ganttbar{}{1}{3} \ganttbar{}{5}{12} \end{ganttchart}
1 2 3 4 5 6 7 8 9 10 11 12
Note that we would have obtained the same result if we had written \gantttitle{1}{1} \gantttitle{2}{1} . . . \gantttitle{12}{1} \\
As an advanced example, we will draw seven title elements containing the names of the weekdays (“Mon” to “Sun”). To this end, we introduce an additional key: /pgfgantt/title list options =hpgffor optionsi var=\x, evaluate=\x Changes the hpgffor optionsi of the \foreach command called by \gantttitlelist (see section 56 of the Tik Z manual). The macro that yields the labels to be printed by \gantttitlelist must be called \x.
\begin{ganttchart}[hgrid, vgrid, x unit=1cm]{1}{7} \gantttitlelist[ title list options=% {var=\y, evaluate=\y as \x%
13
\gantttitlelist
using "\pgfcalendarweekdayshortname{\y}"} ]{0,...,6}{1} \\ \ganttbar{}{1}{4} \ganttbar{}{6}{7} \end{ganttchart}
Mon
Tue
Wed Thu
Fri
Sat
Sun
While you actually may build any chart title with the two commands described previously, \gantttitlecalendar saves a lot of time when you wish to create elaborate calendars:
\gantttitlecalendar
\gantttitlecalendar[hoptionsi]{hcalendar linesi}
Prints a title calendar that spans the whole chart and contains one or more hcalendar linesi. The starred form of the macro prints a calendar from hstart tssi to hend tssi: \gantttitlecalendar*[hoptionsi]{hstart tssi}{hend tssi}{hcalendar linesi}
hcalendar linesi is a comma-separated list of line types: Line type
houtput formati
Example output
year
n/a
2012, 2013, . . .
month [=houtput formati]
(none) name shortname
01, 02, . . . , 12 January, February, . . . Jan, Feb, . . .
week [=hnumber i]
n/a
Week 1, Week 2, . . .
weekday [=houtput formati]
(none) name shortname
0, 1, . . . , 6 Monday, Tuesday, . . . Mon, Tue, . . .
day
n/a
01, 02, . . . , 31
The hnumber i for the week line type is the number of the first week in the calendar. \begin{ganttchart}[ hgrid, vgrid, x unit=4mm, time slot format=isodate ]{2012-12-25}{2013-02-01}
14
\gantttitlecalendar*
\gantttitlecalendar{year, month, day, week=3, weekday} \\ \ganttbar{}{2013-01-14}{2013-01-17} \end{ganttchart}
2012
2013
12
01
02
25 26 27 28 29 30 31 01 02 03 04 05 06 07 08 09 10 11 12 13 14 15 16 17 18 19 20 21 22 23 24 25 26 27 28 29 30 31 01 Week 3
Week 4
Week 5
Week 6
Week 7
Week 8
1 2 3 4 5 6 0 1 2 3 4 5 6 0 1 2 3 4 5 6 0 1 2 3 4 5 6 0 1 2 3 4 5 6 0 1 2 3 4
You can easily add new output formats for month and weekday. The predefined ones use the macros described in section 57.1.3 of the Tik Z manual. For example, weekday=name calls \pgfcalendarweekdayname. Thus, new macros called \pgfcalendarmonthhoutput formati or \pgfcalendarweekdayhoutput formati will provide additional houtput formatis for month and weekday, respectively. A weekday output format called letter, which displays a weekday as single letter, might be implemented as follows: \def\pgfcalendarweekdayletter#1{% \ifcase#1M\or T\or W\or T\or F\or S\or S\fi% } \begin{ganttchart}[ hgrid, vgrid, x unit=18mm, time slot format=little-endian ]{7.1.2013}{13.1.2013} \gantttitlecalendar*{7.1.2013}{13.1.2013}{ month, month=name, month=shortname, weekday, weekday=name, weekday=shortname, weekday=letter } \end{ganttchart}
15
01 January Jan 0 Monday
1
2
3
Tuesday Wednesday Thursday
4
5
6
Friday
Saturday
Sunday
Mon
Tue
Wed
Thu
Fri
Sat
Sun
M
T
W
T
F
S
S
/pgfgantt/calendar week text =hformati Week~\currentweek Changes the text displayed in a week title element. In hformati, four additional macros are available: \currentweek is the current week number; \startyear, \startmonth and \startday expand to the year, month and day of the current week’s Monday. \ganttset{% calendar week text={% \pgfcalendarmonthshortname{\startmonth}~\startday, \startyear% }% } \begin{ganttchart}[ hgrid, vgrid, x unit=4mm, time slot format=isodate ]{2012-12-24}{2013-01-20} \gantttitlecalendar{year, week, day} \\ \ganttbar{}{2013-01-10}{2013-01-17} \end{ganttchart}
16
\currentweek \startyear \startmonth \startday
2012 Dec 24, 2012
2013 Dec 31, 2012
Jan 07, 2013
Jan 14, 2013
24 25 26 27 28 29 30 31 01 02 03 04 05 06 07 08 09 10 11 12 13 14 15 16 17 18 19 20
/pgfgantt/compress calendar =hbooleani false By default, one calendar day is one time slot wide. With compress calendar=true, one month corresponds to one time slot. Consequently, in compressed calendars only year and month are sensible line types for \gantttitlecalendar. The time slot format isodate-yearmonth is especially suited for compressed calendars. \begin{ganttchart}[ hgrid, vgrid, time slot format=isodate-yearmonth, compress calendar ]{2012-01}{2013-5} \gantttitlecalendar{year, month} \\ \ganttbar{}{2012-05}{2013-01} \end{ganttchart}
2012
2013
01 02 03 04 05 06 07 08 09 10 11 12 01 02 03 04 05
/pgfgantt/title /.style=hstylei shape=rectangle, inner sep=0pt, draw, fill=white Sets the appearance of a title element. \usetikzlibrary{shadows} \usetikzlibrary{shadings} ··· \begin{ganttchart}[ vgrid,
17
canvas/.style={draw=none}, title/.append style=% {fill=blue!20, rounded corners=2mm, drop shadow} ]{1}{7} \gantttitle{First week}{7} \\ \gantttitlelist[ title/.style={draw=none, inner color=red} ]{1,...,7}{1} \\ \ganttbar{}{1}{2} \ganttbar{}{4}{7} \end{ganttchart}
First week 1 2 3 4 5 6 7
/pgfgantt/title label font =hfont commandsi \small /pgfgantt/title label node /.style=hoptionsi anchor=center, font=\ganttvalueof{title label font} The hfont commandsi and hoptionsi are applied to the title label node, which is positioned at the center of each title element. \begin{ganttchart}[ vgrid, hgrid, title label font=\LARGE\color{violet}, title label node/.append style={anchor=west} ]{1}{6} \gantttitle{2011}{6} \\ \ganttbar{}{1}{2} \ganttbar{}{4}{6} \end{ganttchart}
2011
/pgfgantt/title left shift =hfactor i
18
0
/pgfgantt/title right shift =hfactor i 0 /pgfgantt/title top shift =hfactor i 0 /pgfgantt/title height =hfactor i 0.6 The first three keys shift the coordinates of a title element’s borders (or rather of its corners), while title height changes its height. By default, the left upper corner of a title element coincides with the origin of the start time slot; its right lower corner touches the right border of the end time slot 0.6 units below the upper line border: Start time slot (1) start: (0, 0) End time slot (6) 2011
(6, 0 + 0.6): stop (6, 1)
The figure below shows a Gantt chart with two lines and one (large) time slot and indicates the distances modified by these keys.
(0, 0)
title top shift (here: 0.25)
title left shift (here: 0.2) (0, 1)
Title element with standard values (1, 0) title right shift (here: -0.3)
title height (here: 0.5)
(1, 1)
For example, you might devise a layout where the title element does not touch the borders of the start and end time slot. \begin{ganttchart}[ vgrid, title/.style={fill=teal, draw=none}, title label font=\color{white}\bfseries, title left shift=.1, title right shift=-.1, title top shift=.05, title height=.75 ]{1}{7} \gantttitle{Title}{7} \\ \ganttbar{}{1}{2} \ganttbar{}{4}{7} \end{ganttchart}
19
Title
/pgfgantt/include title in canvas =hbooleani true The canvas normally comprises all lines of the chart. However, you may wish that your title elements only consist of text lacking any frame or background. In this case, the canvas probably should exclude all lines containing title elements, which you achieve by include title in canvas=false. \begin{ganttchart}[ hgrid={*1{draw=red, thick}}, vgrid, y unit title=.5cm, title/.style={draw=none, fill=none}, include title in canvas=false ]{1}{7} \gantttitlelist{1,...,7}{1} \\ \ganttbar{}{1}{3} \\ \ganttbar{}{4}{7} \end{ganttchart}
1 2 3 4 5 6 7
2.6 Predefined Chart Elements pgfgantt predefines three chart elements: 1. Bars indicate the duration of a task or one of its parts.
\ganttbar
\ganttbar[hoptionsi]{hlabel i}{hstart tssi}{hend tssi}
2. Groups combine several subtasks (represented by bars) into a single task.
\ganttgroup
\ganttgroup[hoptionsi]{hlabel i}{hstart tssi}{hend tssi}
3. Milestones signify that an important task has been completed or that a crucial goal has been reached.
20
\ganttmilestone
\ganttmilestone[hoptionsi]{hlabel i}{htssi}
Each of these macros draws a hlabel ied chart element from the hstart tssi to the hend tssi (or at the given htssi in case of \ganttmilestone). \begin{ganttchart}[vgrid, hgrid]{1}{12} \gantttitle{Title}{12} \\ \ganttgroup{Group 1}{1}{10} \\ \ganttbar{Task 1}{1}{3} \\ \ganttbar{Task 2}{4}{10} \\ \ganttmilestone{Milestone 1}{11} \end{ganttchart}
Title
Group 1 Task 1 Task 2 Milestone 1
For each predefined chart element, there is also a macro that additionally draws a link from the previous element. Otherwise, these macros work exactly like the standard versions: \ganttlinkedbar[hoptionsi]{hlabel i}{hstart tssi}{hend tssi} \ganttlinkedgroup[hoptionsi]{hlabel i}{hstart tssi}{hend tssi} \ganttlinkedmilestone[hoptionsi]{hlabel i}{htssi}
In the following example, the code on the left is equivalent to the code on the right.
21
\ganttlinkedbar \ganttlinkedgroup \ganttlinkedmilestone
% Short version
% Long version
\begin{ganttchart}[ vgrid, hgrid ]{1}{12} \gantttitle{Title}{12} \\ \ganttbar{Task 1}{1}{4} \\ \ganttlinkedbar{Task 2}{5}{6} \\ \ganttlinkedmilestone{M 1}{6} \\ \ganttlinkedbar{Task 3}{7}{11} \end{ganttchart}
\begin{ganttchart}[ vgrid, hgrid ]{1}{12} \gantttitle{Title}{12} \\ \ganttbar{Task 1}{1}{4} \\ \ganttbar{Task 2}{5}{6} \\ \ganttmilestone{M 1}{6} \\ \ganttbar{Task 3}{7}{11} \ganttlink{elem0}{elem1} \ganttlink{elem1}{elem2} \ganttlink{elem2}{elem3} \end{ganttchart}
Title
Task 1 Task 2 M1 Task 3
/pgfgantt/chart element start border =left | right left Determines which border of the start time slot a chart element touches. left is the behavior usually expected, while right strictly interprets the start time slot as an x-coordinate. \begin{ganttchart}[vgrid, hgrid, chart element start border=right]{1}{12} \gantttitle{Title}{12} \\ \ganttgroup{Group 1}{0}{10} \\ \ganttbar{Task 1}{0}{3} \\ \ganttbar{Task 2}{3}{10} \\ \ganttmilestone{Milestone 1}{11} \end{ganttchart}
22
Title
Group 1 Task 1 Task 2 Milestone 1
2.6.1 Options: Chart Element Appearance The following options are similar for all predefined (and user-defined) chart elements: /pgfgantt/bar /.style=hstylei shape=ganttbar, inner /pgfgantt/group /.style=hstylei shape=ganttgroup, /pgfgantt/milestone /.style=hstylei shape=ganttmilestone, inner Determines the appearance of the chart element. The and ganttmilestone are described below.
sep=0pt, draw, fill=white inner sep=0pt, fill=black sep=0pt, draw, fill=black shapes ganttbar, ganttgroup
\begin{ganttchart}[ vgrid, hgrid, bar/.append style={fill=red!50}, group/.append style={draw=black, fill=green!50}, milestone/.append style={fill=orange, rounded corners=3pt} ]{1}{12} \gantttitle{Title}{12} \\ \ganttgroup{Group 1}{1}{10} \\ \ganttbar{Task 1}{1}{3} \\ \ganttbar[ bar/.append style={shape=ellipse, fill=yellow, dashed} ]{Task 2}{4}{10} \\ \ganttmilestone{Milestone 1}{11} \end{ganttchart}
23
Title
Group 1 Task 1 Task 2 Milestone 1
2.6.2 Options: Label Formatting /pgfgantt/bar label text =htexti \strut#1 /pgfgantt/group label text =htexti \strut#1 /pgfgantt/milestone label text =htexti \strut#1 /pgfgantt/bar label font =hfont commandsi \normalsize /pgfgantt/group label font =hfont commandsi \bfseries /pgfgantt/milestone label font =hfont commandsi \itshape /pgfgantt/bar label node ./style=hoptionsi anchor=east, font=\ganttvalueof{bar label font} /pgfgantt/group label node ./style=hoptionsi anchor=east, font=\ganttvalueof{group label font} /pgfgantt/milestone label node ./style=hoptionsi anchor=east, font=\ganttvalueof{milestone label font} The ... label text keys configure the label htexti next to each chart element. Each of these keys should contain a single parameter token (#1), which is replaced by the first mandatory argument of \ganttbar etc. The \strut in the standard value ensures equal vertical spacing of the labels. The hfont commandsi of ... label font and the hoptionsi of ... label node are applied to the label node at the left border of the chart (see inline below). \begin{ganttchart}[ vgrid, hgrid, bar label font=\Large, bar label text={--#1$\rightarrow$}, group label font=\color{orange}, group label text={+#1+}, milestone label font=\color{magenta}, milestone label node/.append style={rotate=30}, milestone label text={#1 !!!} ]{1}{12}
24
\gantttitle{Title}{12} \\ \ganttgroup{Group 1}{1}{10} \\ \ganttbar{Task 1}{1}{3} \\ \ganttbar{Task 2}{4}{10} \\ \ganttmilestone{Milestone 1}{11} \end{ganttchart}
Title
+Group 1+
–Task 1→ –Task 2→ 1 ne
!!!
to
les Mi
/pgfgantt/inline =hbooleani false /pgfgantt/bar inline label anchor =hanchor i center /pgfgantt/group inline label anchor =hanchor i center /pgfgantt/milestone inline label anchor =hanchor i center /pgfgantt/bar inline label node /.style=hoptionsi anchor=center, font=\ganttvalueof{bar label font} /pgfgantt/group inline label node /.style=hoptionsi anchor=south, font=\ganttvalueof{group label font} /pgfgantt/milestone inline label node /.style=hoptionsi anchor=south, font=\ganttvalueof{milestone label font} If two or more chart elements appear in a single line, their labels will overlap at the left border of the chart. Thus, you can place the label adjacent to a chart element by setting the boolean key inline to true. This key instructs the package to draw the label node at the ... inline label anchor of the respective chart element and apply the hoptionsi given by ... inline label node. \begin{ganttchart}[ vgrid, hgrid, inline, milestone inline label node/.append style={left=5mm} ]{1}{12}
25
\gantttitle{Title}{12} \\ \ganttgroup{Group 1}{1}{10} \\ \ganttbar{Task 1}{1}{3} \\ \ganttbar{Task 2}{4}{10} \\ \ganttmilestone{Milestone 1}{11} \end{ganttchart}
Title
Group 1
Task 1 Task 2 Milestone 1
2.6.3 Options: Chart Element Positioning /pgfgantt/bar left shift =hfactor i 0 /pgfgantt/bar right shift =hfactor i 0 /pgfgantt/bar top shift =hfactor i .3 /pgfgantt/bar height =hfactor i .4 /pgfgantt/group left shift =hfactor i -.1 /pgfgantt/group right shift =hfactor i .1 /pgfgantt/group top shift =hfactor i .4 /pgfgantt/group height =hfactor i .2 /pgfgantt/milestone left shift =hfactor i .6 /pgfgantt/milestone right shift =hfactor i .4 /pgfgantt/milestone top shift =hfactor i .3 /pgfgantt/milestone height =hfactor i .4 Shift the coordinates of a chart element’s borders (... shift) and change its height (... height).
26
Start time slot (2)
End time slot (7) Title
(1, 1) start: (1 + 0, 1 + 0.3) (7 + 0, 1 + 0.3 + 0.4): stop (7, 2) (1, 3) start: (1 − 0.1, 3 + 0.4)
(6 + 0.1, 3 + 0.4 + 0.2): stop
Start time slot (2)
(6, 4) End time slot (6) (3, 5)
start: (3 + 0.6, 5 + 0.3) Time slot (4)
(4 + 0.4, 5 + 0.3 + 0.4): stop (4, 6)
The three following figures illustrate the distances modified by these keys. The first figure shows a Gantt chart with a bar, two lines and one time slot.
(0, 0)
bar top shift (here: 0.25)
bar left shift (here: 0.2) (0, 1)
Bar with standard values (1, 0) bar right shift (here: -0.3)
bar height (here: 0.5)
(1, 1)
The second one shows a Gantt chart with a group, two lines and one time slot.
(0, 0) group left shift (here: 0.2) (0, 1)
group top shift (here: 0.25)
group height (here: 0.3)
27
Group with standard values (without peaks) (1, 0) group right shift (here: -0.3) (1, 1)
The third one shows a Gantt chart with a milestone, two lines and two time slots. Milestone with standard values milestone height (1, 0) (here: 0.7) (0, 0) milestone left shift (here: 0.2)
milestone top shift (here: 0.15) (2, 0)
milestone right shift (here: -0.4)
(0, 1)
(2, 1)
(1, 1)
/pgfgantt/group right peak tip position =hfractioni 0.5 /pgfgantt/group right peak width =hfactor i 0.4 /pgfgantt/group right peak height =hfactor i 0.1 /pgfgantt/group left peak tip position =hfractioni 0.5 /pgfgantt/group left peak width =hfactor i 0.4 /pgfgantt/group left peak height =hfactor i 0.1 /pgfgantt/group peaks tip position =hfractioni (none) /pgfgantt/group peaks width =hfactor i (none) /pgfgantt/group peaks height =hfactor i (none) Change the appearance of the peaks at both ends of a group. By default, both the left and right peak are 0.4 units wide and 0.1 units high, their tips lie between the peak sides. The group peaks ... keys set the dimensions for both peaks simultaneously. The figure below exemplifies the keys that apply to the left peak. (0, 0)
(1, 0) width
(0, 1)
height
tip position (as fraction of width)
(1, 1)
For example, you might devise the following layout: Bars are small and rounded; they do not touch the borders of their start and end time slots. Groups stay within the start and end time slot, and the peaks are more acute. \begin{ganttchart}[ vgrid, bar/.append style={fill=red, rounded corners=3pt}, bar left shift=.15,
28
bar right shift=-.15, bar top shift=.4, bar height=.2, group left shift=0, group right shift=0, group peaks tip position=0, group peaks height=.4 ]{1}{7} \gantttitle{Title}{7} \\ \ganttgroup{Group 1}{1}{7} \\ \ganttbar{Task 1}{1}{2} \\ \ganttbar{Task 2}{3}{7} \end{ganttchart}
Title
Group 1 Task 1 Task 2
2.6.4 Options: Progress The progress of a chart element illustrates the extent to which this element has been completed. /pgfgantt/progress =none | today | hnumber i none Indicates that a chart element is hnumber i percent complete. The value none turns progress calculations off. \begin{ganttchart}[vgrid, hgrid]{1}{12} \gantttitle{Title}{12} \\ \ganttgroup[progress=45]{Group 1}{1}{12} \\ \ganttbar[progress=100]{Subtask 1}{1}{3} \\ \ganttbar[progress=37]{Subtask 2}{4}{8} \\ \ganttbar[progress=none]{Subtask 3}{9}{12} \end{ganttchart}
29
Title
Group 1 Subtask 1
45% complete
100% complete
Subtask 2
37% complete
Subtask 3 The value today instructs pgfgantt to calculate progress according to the value of the today key. Thus, if the current date T is earlier than the start date S of a chart element, its progress is 0 %; if the current date is later than the end date E of a chart element, its progress is 100 %; otherwise, its progress P is calculated according to P =
T −S × 100 % E−S
(1)
\begin{ganttchart}[ vgrid, hgrid, time slot format=little-endian, progress=today, today=4.5.13 ]{1.5.13}{12.5.13} \gantttitle{Title}{12} \\ \ganttgroup{Group 1}{1.5.13}{12.5.13} \\ \ganttbar{Subtask 1}{1.5.13}{3.5.13} \\ \ganttbar{Subtask 2}{4.5.13}{8.5.13} \\ \ganttbar{Subtask 3}{9.5.13}{12.5.13} \end{ganttchart}
Title
Group 1 Subtask 1
33% complete
100% complete
Subtask 2
20% complete
Subtask 3
0% complete
TODAY
30
/pgfgantt/bar incomplete /.style=hstylei /pgfgantt/group incomplete /.style=hstylei
/pgfgantt/bar, fill=black!25
/pgfgantt/group, fill=black!25 /pgfgantt/milestone incomplete /.style=hstylei /pgfgantt/milestone, fill=black!25 If P is the progress of a chart element, P % of its area (starting from the left) appear in the basic style (i. e., bar, group, . . . ), while the remainder is drawn in style bar incomplete, group incomplete etc. \begin{ganttchart}[ vgrid, hgrid, time slot format=isodate, today=2013-04-06, progress=today, bar/.append style={fill=green}, bar incomplete/.append style={fill=red}, group incomplete/.append style={draw=black,fill=none} ]{2013-04-01}{2013-04-12} \gantttitle{Title}{12} \\ \ganttgroup{Group 1}{2013-04-01}{2013-04-12} \\ \ganttbar{Subtask 1}{2013-04-01}{2013-04-03} \\ \ganttbar{Subtask 2}{2013-04-04}{2013-04-08} \\ \ganttbar{Subtask 3}{2013-04-09}{2013-04-12} \end{ganttchart}
Title
Group 1 Subtask 1
50% complete
100% complete
Subtask 2
60% complete
Subtask 3
0% complete
TODAY
/pgfgantt/progress label text =htexti \pgfmathprintnumber[precision=0, verbatim]{#1}\% complete /pgfgantt/bar progress label anchor =hanchor i east /pgfgantt/bar progress label font =hfont commandsi \scriptsize
31
/pgfgantt/bar progress label node /.style=hoptionsi anchor=west, font=\ganttvalueof{bar progress label font} /pgfgantt/group progress label anchor =hanchor i east /pgfgantt/group progress label font =hfont commandsi \scriptsize /pgfgantt/group progress label node /.style=hoptionsi anchor=west, font=\ganttvalueof{group progress label font} /pgfgantt/milestone progress label anchor =hanchor i center /pgfgantt/milestone progress label font =hfont commandsi \scriptsize /pgfgantt/milestone progress label node /.style=hoptionsi anchor=west, font=\ganttvalueof{milestone progress label font} The progress label text key sets the htexti that appears beside each progress element in order to indicate its completeness. This key may contain a single parameter token (#1), which is replaced by the (possibly calculated) value of progress. The progress label node is drawn at the ... progress label anchor of the respective chart element, with the hfont commandsi given by ... progress label font and the hoptionsi given by ... progress label node. \begin{ganttchart}[ vgrid, hgrid, bar/.append style={fill=green}, bar incomplete/.append style={fill=red}, progress=today, today=6, group progress label node/.append style={below=3pt} ]{1}{12} \gantttitle{Title}{12} \\ \ganttgroup{Group 1}{1}{10} \\ \ganttbar[ bar progress label font=\color{green!25!black}\sffamily ]{Subtask 1}{1}{3} \\ \ganttbar[ progress label text={$\displaystyle\frac{#1}{100}$} ]{Subtask 2}{5}{12} \end{ganttchart} Title
Group 1 60% complete
Subtask 1
100% complete 25.0 100
Subtask 2 TODAY
32
2.6.5 New Node Shapes pgfgantt defines three new node shapes: (1) The ganttbar node shape derives from shape rectangle (section 48.2 of the Tik Z manual). It provides four additional anchors: on top, on bottom, on left and on right. The hfractioni set by the following keys indicates a position between the left and right (for on top and on bottom) or upper and lower border (for on left and on right), similarly to the /tikz/pos key. /pgfgantt/on top fraction =hfractioni 0.5 /pgfgantt/on bottom fraction =hfractioni 0.5 /pgfgantt/on left fraction =hfractioni 0.5 /pgfgantt/on right fraction =hfractioni 0.5 In the following figures, on top/bottom fraction is 0.7, whereas on left/right fraction is 0.1. (s.130) (s.north) (s.on top)
(s.north west)
(s.north east) (s.on right)
(s.on left)
(s.10) (s.center) (s.west)
(s.east)
ganttbar (s.mid)
(s.base west) (s.mid west)
(s.text) (s.south west)
(s.mid east) (s.base east)
(s.base)
(s.south) (s.on bottom)
(s.south east)
(2) The ganttgroup node shape also derives from shape rectangle. It provides the additional anchors on top, on bottom, on left, on right (same as above), left peak and right peak. (s.north west)
(s.130) (s.north)
(s.on top)
(s.north east) (s.on right)
(s.on left)
(s.10) (s.center) (s.west)
(s.east)
ganttgroup (s.mid)
(s.base west) (s.mid west)
(s.text) (s.south west)
(s.mid east) (s.base east)
(s.base)
(s.south) (s.on bottom)
(s.left peak)
(s.right peak)
33
(s.south east)
(3) The ganttmilestone node shape derives from shape diamond (section 48.3 of the Tik Z manual), but does not consider any aspect ratio. It provides the additional anchors on top, on bottom, on left and on right (same as above). (s.north)
(s.on right)
(s.on left)
(s.on top) (s.130) (s.north west)
(s.north east)
(s.10) (s.center) (s.mid)
(s.west) (s.text)
ganttmilestone
(s.east)
(s.base)
(s.south west)
(s.south east) (s.on bottom)
(s.south)
2.7 Defining Custom Chart Elements You may define completely new chart elements with \newganttchartelement{hnamei}{hnew default key valuesi} \newganttchartelement*{hnamei}{hnew default key valuesi}
\newganttchartelement (unstarred) defines a new chart element \gantthnamei and the corresponding \ganttlinkedhnamei. These chart element macros take one optional argument hoptionsi and three mandatory arguments hlabel i, hstart tssi and hend tssi (like \ganttbar). Chart element macros defined by the starred form, \newganttchartelement*, take the same single optional argument, but two mandatory arguments hlabel i and htssi (like \ganttmilestone). For each new chart element, \newganttchartelement also introduces a set of nine value-storing keys and five style keys and assigns default values to them:
34
\newganttchartelement
\newganttchartelement*
Key
Default value
Style keys hnamei hnamei incomplete hnamei label node hnamei inline label node hnamei progress label node
shape=rectangle, inner sep=0pt, draw, fill=white /pgfgantt/hnamei, fill=black!25 anchor=east, font=\ganttvalueof{hnamei label font} anchor=center, font=\ganttvalueof{hnamei label font} anchor=west, font=\ganttvalueof{hnamei progress label font}
Value-storing keys hnamei label font hnamei inline label anchor hnamei progress label anchor hnamei progress label font hnamei left shift hnamei right shift hnamei top shift hnamei height hnamei label text
\normalsize center east \scriptsize 0 0 .3 .4 \strut#1
Consequently, a new chart element will look like the standard \ganttbar unless you introduce some hnew default key valuesi. Let us define a new chart element called “foobar”, which is basically a fancy-colored and -shaped bar: \definecolor{foobarblue}{RGB}{0,153,255} \definecolor{foobaryellow}{RGB}{234,187,0} \newganttchartelement{foobar}{ foobar/.style={ shape=rounded rectangle, inner sep=0pt, draw=foobarblue!50!black, very thick, top color=white, bottom color=foobarblue!50 }, foobar incomplete/.style={ /pgfgantt/foobar, draw=foobaryellow, bottom color=foobaryellow!50 }, foobar label font=\slshape, foobar left shift=-.1, foobar right shift=.1 }
35
\begin{ganttchart}[ vgrid, progress=today, progress label text=\relax, today=6 ]{1}{12} \gantttitlecalendar{day} \\[grid] \ganttfoobar{Foobar 1}{1}{2} \\ \ganttfoobar{Foobar 2}{3}{7} \\ \ganttlinkedfoobar{Foobar 3}{9}{12} \end{ganttchart}
01 02 03 04 05 06 07 08 09 10 11 12
Foobar 1 Foobar 2 Foobar 3 TODAY
2.8 Links So far, we have drawn charts whose elements were quite independent of each other. However, relations or links between these elements frequently appear on real Gantt charts. For example, a task may only start if a previous one has been completed, or finishing a task may constitute a milestone. \ganttlink[hoptionsi]{hstart element namei}{hend element namei}
/pgfgantt/name =hnamei (empty) The \ganttlink macro connects two elements, which are specified by their hnameis. By default, chart elements are named automatically: The first one receives the name elem0, the second one is called elem1 and so on. However, the name key allows you to assign a name to each chart element.
36
\ganttlink
\begin{ganttchart}[ vgrid, hgrid ]{1}{12} \gantttitle{Title}{12} \\ \ganttbar{Task 1}{1}{4} \\ \ganttbar{Task 2}{5}{7} \\ \ganttbar{Task 3}{10}{12} \ganttlink{elem0}{elem1} \ganttlink{elem1}{elem2} \end{ganttchart}
\begin{ganttchart}[ vgrid, hgrid ]{1}{12} \gantttitle{Title}{12} \\ \ganttbar[name=b1]% {Task 1}{1}{4} \\ \ganttbar[name=b2]% {Task 2}{5}{7} \\ \ganttbar[name=xyz]% {Task 3}{10}{12} \ganttlink{b1}{b2} \ganttlink{b2}{xyz} \end{ganttchart} Title
Task 1 Task 2 Task 3
/pgfgantt/link /.style=hstylei Sets the appearance of the link.
-latex, rounded corners=1pt
\begin{ganttchart}[ vgrid, hgrid, link/.style={[-to, line width=1pt, blue} ]{1}{7} \gantttitle{Title}{7} \\ \ganttbar{Task 1}{1}{4} \\ \ganttbar{Task 2}{5}{7} \ganttlink{elem0}{elem1} \end{ganttchart} Title
Task 1 Task 2
37
/pgfgantt/link type =htypei Link types fall into several categories:
auto
1. Automatic links are arrow-like. As you can see from the examples above, they consist of three segments (two horizontal, one vertical) if their start and end time slots are sufficiently separated. Otherwise, they comprise five segments (three horizontal, two vertical). Three keys further modify the appearance of automatic links: /pgfgantt/link mid =hfactor i 0.5 Changes the position of the single vertical segment (in three-part links) or of the middle horizontal segment (in five-part links). By default, these segments are horizontally centered between the left and the right vertical segment, or vertically centered between the upper and the lower horizontal segment, respectively. /pgfgantt/link bulge =hfactor i 0.4 In five-part links, the upper and lower vertical segments are shifted along the x-axis by +hfactor i and −hfactor i, respectively. /pgfgantt/link tolerance =hfactor i 0.6 Decides whether pgfgantt draws a five- or a three-part link. If the true xcoordinates of the link start and end differ by at least hfactor i (this is the case for the second link in the example below), the package draws a five-part link. \begin{ganttchart}[vgrid, hgrid, link mid=.25, link bulge=1.3]{1}{12} \gantttitle{Title}{12} \\ \ganttbar{Task 1}{1}{4} \\ \ganttbar{Task 2}{5}{7} \\ \ganttbar{Task 3}{10}{12} \ganttlink{elem0}{elem1} \ganttlink[link mid=.8]{elem1}{elem2} \end{ganttchart}
Title
Task 1 Task 2 Task 3
38
2. Straight links are only meant for connecting two bars in order to establish start-to-finish relations (s-f), start-to-start relations (s-s) etc. Their htypei identifiers are reminiscent of the syntax for specifying arrow tips in Tik Z: Each identifier is composed of two letters separated by a hyphen. \begin{ganttchart}[ vgrid, hgrid, link/.style={-latex, draw=red, fill=red} ]{1}{12} \gantttitle{Title}{12} \\ \ganttbar{Task 1}{2}{3} \\ \ganttbar{Task 2}{2}{5} \\ \ganttbar{Task 3}{6}{11} \\ \ganttbar{Task 4}{8}{11} \ganttlink[link type=s-s]{elem0}{elem1} \ganttlink[link type=f-s]{elem1}{elem2} \ganttlink[link type=f-f]{elem2}{elem3} \end{ganttchart}
Title
Task 1 start-to-start
Task 2 finish-to-start
Task 3 finish-to-finish
Task 4
3. Custom links allow you to define completely new link types. Strictly speaking, automatic and straight links are predefined custom links whose code supports the keys mentioned above (section 3.10 presents the Tik Z code of these links). For instance, pgfgantt provides one additional link type, dr (short for “downright”). This type is convenient for connecting inline-labeled bars if the label of the start bar protrudes from its right border. \begin{ganttchart}[ vgrid, hgrid, inline, link/.style={->, ultra thick} ]{1}{15}
39
\gantttitle{Title}{15} \\ \ganttbar{A really long label}{1}{3} \ganttbar{Another really long label}{10}{12} \\ \ganttbar{Task 3}{4}{6} \ganttbar{Task 4}{13}{15} \ganttlink[link/.append style=red]{elem0}{elem2} \ganttlink[link/.append style=green, link type=dr]{elem1}{elem3} \end{ganttchart}
Title
A really long label
Another really long label
Task 3
Task 4
The following macro creates new link types: \newganttlinktype{htypei}{hTikZ codei}
It defines a new link htypei which is drawn by the given hTikZ codei. When you write this code, you do not have to know the final absolute coordinates of each link type instance. On the contrary, several commands that are only available in the second argument of \newganttlinktype help you to design generic link types: • First, you have to choose the border points of the chart elements the link will connect. For this purpose, \ganttsetstartanchor{hanchor i} and \ganttsetendanchor{hanchor i} select an hanchor i of the start and end element, respectively. See the figures in section 2.6.5 for possible hanchor is of the default chart element shapes. You may specify a certain hfractioni for anchors like on top by \ganttsetstartanchor{on top=hfractioni}. pgfgantt sets the default anchors to \ganttsetstartanchor{east} and \ganttsetendanchor{west}, so you even may omit these two commands. • The two macro pairs \xLeft/\yUpper and \xRight/\yLower provide the x- and y-coordinates of the link start and end points, respectively.
40
\newganttlinktype
\ganttsetstartanchor \ganttsetendanchor
\xLeft \yUpper \xRight \yLower
Title
Task 1
(\xLeft, \yUpper)
(\xRight, \yLower)
Task 2
• \ganttlinklabel contains the label that you may assign to each link type via \setganttlinklabel or the link label key (see below). • You can access any values stored in the package’s hkeyis with the macro \ganttvalueof{hkeyi}.
\ganttlinklabel
\ganttvalueof
• Remember that you can use the style /pgfgantt/link to ensure a uniform appearance of all your link types. \newganttlinktypealias{hnew typei}{hexisting typei}
\newganttlinktypealias lets a hnew typei equal an hexisting typei, also copying any label that has been set for the hexisting typei.
\newganttlinktypealias
\setganttlinklabel{htypei}{hlabel i}
\setganttlinklabel sets a hlabel i for the given link htypei. In the following example, note how sta-to-sta and s-s share a common label, while we change the label of fin-to-fin. \newganttlinktypealias{sta-to-sta}{s-s} \newganttlinktypealias{fin-to-fin}{f-f} \setganttlinklabel{fin-to-fin}{f2f} \begin{ganttchart}[vgrid, hgrid]{1}{12} \gantttitle{Title}{12} \\ \ganttbar{Task 1}{2}{3} \\ \ganttbar{Task 2}{2}{8} \\ \ganttbar{Task 3}{6}{8} \ganttlink[link type=sta-to-sta]{elem0}{elem1} \ganttlink[link type=fin-to-fin]{elem1}{elem2} \end{ganttchart}
41
\setganttlinklabel
Title
Task 1 start-to-start
Task 2 f2f
Task 3
Let’s put it all together and devise two new link types. Firstly, zigzag connects the lower right corner of the start element and the upper left corner of the end element with a thick, cyan line decorated by a zigzag pattern. \usetikzlibrary{decorations.pathmorphing} \newganttlinktype{zigzag}{ \ganttsetstartanchor{on right=1} \ganttsetendanchor{on left=0} \draw [decoration=zigzag, decorate, thick, cyan] (\xLeft, \yUpper) -(\xRight, \yLower); } \begin{ganttchart}[vgrid, hgrid]{1}{12} \gantttitle{Title}{12} \\ \ganttbar{Task 1}{2}{3} \\ \ganttbar{Task 2}{7}{12} \ganttlink[link type=zigzag]{elem0}{elem1} \end{ganttchart}
Title
Task 1 Task 2 Secondly, drur (short for down-right-up-right) draws a labelled arrow in the default style link. The link starts at the bottom of the first element and connects to the left border of the second one. In addition, the known keys link mid and link bulge decide where the line going up is positioned and how far the first line going right is below the start coordinate, respectively.
42
\newganttlinktype{drur}{ \ganttsetstartanchor{on bottom=0.75} \ganttsetendanchor{on left} \draw [/pgfgantt/link] % first segment (down) (\xLeft, \yUpper) -% second segment (right) (\xLeft, \yUpper \ganttvalueof{link bulge} * \ganttvalueof{y unit chart}) -% link label node [pos=.5, /pgfgantt/link label anchor] {\ganttlinklabel} % third segment (up) ($(\xLeft, \yUpper \ganttvalueof{link bulge} * \ganttvalueof{y unit chart})!% \ganttvalueof{link mid}!% (\xRight, \yUpper \ganttvalueof{link bulge} * \ganttvalueof{y unit chart})$) -% last segment (right again) ($(\xLeft, \yLower)!% \ganttvalueof{link mid}!% (\xRight, \yLower)$) -(\xRight, \yLower); } \setganttlinklabel{drur}{a fancy link} \begin{ganttchart}[ vgrid, hgrid, link/.style={thick, ->, green!50!black, rounded corners=2mm}, link label anchor/.style=below, link mid=.7, link bulge=.6 ]{1}12} \gantttitle{Title}{12} \\ \ganttbar[inline]{Task 1}{2}{4} \ganttbar[inline]{Task 2}{8}{11} \\ \ganttlink[link type=drur]{elem0}{elem1} \end{ganttchart}
Title
Task 1
Task 2
a fancy link
43
(Please remove the comments if you copy the code above – they will confuse Tik Z and generate tons of errors.) /pgfgantt/link label =hlabel i (empty) /pgfgantt/link label font =hfont commandsi \scriptsize\itshape /pgfgantt/link label node /.style=hoptionsi anchor=west, font=\ganttvalueof{link label font} The link label key locally overrides any label specified by \setganttlinklabel. The hfont commandsi and hoptionsi are applied to the link label node. By default, the label appears to the right of the straight link’s center. \begin{ganttchart}[ vgrid, hgrid, link label font=\small\bfseries\color{purple} ]{1}{12} \gantttitle{Title}{12} \\ \ganttbar{Task 1}{2}{3} \\ \ganttbar{Task 2}{2}{5} \\ \ganttbar{Task 3}{6}{11} \\ \ganttbar{Task 4}{8}{11} \\ \ganttbar{Task 5}{4}{7} \ganttlink[link type=s-s]{elem0}{elem1} \ganttlink[link type=f-s, link label={f$\to$s}]{elem1}{elem2} \ganttlink[ link type=f-f, link label node/.append style={anchor=east} ]{elem2}{elem3} \ganttlink[ link type=s-f, link label node/.append style={anchor=base} ]{elem3}{elem4} \end{ganttchart}
44
Title
Task 1 start-to-start
Task 2 f→s
Task 3 finish-to-finish
Task 4 start-to-finish
Task 5
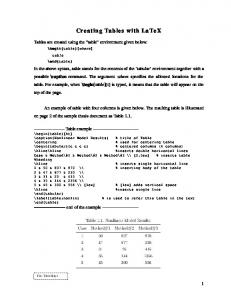
2.9 Style Examples The first example plays around with colors and notably uses equal x- and y-vectors. \begin{ganttchart}[ y unit title=0.4cm, y unit chart=0.5cm, vgrid, time slot format=isodate-yearmonth, compress calendar, title/.append style={draw=none, fill=RoyalBlue!50!black}, title label font=\sffamily\bfseries\color{white}, title label node/.append style={below=-1.6ex}, title left shift=.05, title right shift=-.05, title height=1, bar/.append style={draw=none, fill=OliveGreen!75}, bar height=.6, bar label font=\normalsize\color{black!50}, group right shift=0, group top shift=.6, group height=.3, group peaks height=.2, bar incomplete/.append style={fill=Maroon} ]{2010-09}{2011-12} \gantttitlecalendar{year} \\ \ganttbar[ progress=100, bar progress label font=\small\color{OliveGreen!75}, bar progress label node/.append style={right=4pt}, bar label font=\normalsize\color{OliveGreen}, name=pp ]{Preliminary Project}{2010-09}{2010-12} \\
45
\ganttset{progress label text={}, link/.style={black, -to}} \ganttgroup{Objective 1}{2011-01}{2011-12} \\ \ganttbar[progress=4, name=T1A]{Task A}{2011-01}{2011-06} \\ \ganttlinkedbar[progress=0]{Task B}{2011-07}{2011-12} \\ \ganttgroup{Objective 2}{2011-01}{2011-12} \\ \ganttbar[progress=15, name=T2A]{Task A}{2011-01}{2011-09} \\ \ganttlinkedbar[progress=0]{Task B}{2011-10}{2011-12} \\ \ganttgroup{Objective 3}{2011-05}{2011-08} \\ \ganttbar[progress=0]{Task A}{2011-05}{2011-08} \ganttset{link/.style={OliveGreen}} \ganttlink[link mid=.4]{pp}{T1A} \ganttlink[link mid=.159]{pp}{T2A} \end{ganttchart}
2010 Preliminary Project Objective 1 Task A Task B Objective 2 Task A Task B Objective 3 Task A
2011 100% complete
The second example demonstrates that pgfgantt is really flexible: Even an appearance quite different from the standard layout is possible. (More precisely, the code below tries to reproduce the Gantt chart from the English Wikipedia site, see http://en.wikipedia.org/wiki/Gantt_chart.) \definecolor{barblue}{RGB}{153,204,254} \definecolor{groupblue}{RGB}{51,102,254} \definecolor{linkred}{RGB}{165,0,33} \renewcommand\sfdefault{phv} \renewcommand\mddefault{mc} \renewcommand\bfdefault{bc} \setganttlinklabel{s-s}{START-TO-START} \setganttlinklabel{f-s}{FINISH-TO-START} \setganttlinklabel{f-f}{FINISH-TO-FINISH} \sffamily \begin{ganttchart}[ canvas/.append style={fill=none, draw=black!5, line width=.75pt}, hgrid style/.style={draw=black!5, line width=.75pt}, vgrid={*1{draw=black!5, line width=.75pt}},
46
today=7, today rule/.style={ draw=black!64, dash pattern=on 3.5pt off 4.5pt, line width=1.5pt }, today label font=\small\bfseries, title/.style={draw=none, fill=none}, title label font=\bfseries\footnotesize, title label node/.append style={below=7pt}, include title in canvas=false, bar label font=\mdseries\small\color{black!70}, bar label node/.append style={left=2cm}, bar/.append style={draw=none, fill=black!63}, bar incomplete/.append style={fill=barblue}, bar progress label font=\mdseries\footnotesize\color{black!70}, group incomplete/.append style={fill=groupblue}, group left shift=0, group right shift=0, group height=.5, group peaks tip position=0, group label node/.append style={left=.6cm}, group progress label font=\bfseries\small, link/.style={-latex, line width=1.5pt, linkred}, link label font=\scriptsize\bfseries, link label node/.append style={below left=-2pt and 0pt} ]{1}{13} \gantttitle[ title label node/.append style={below left=7pt and -3pt} ]{WEEKS:\quad1}{1} \gantttitlelist{2,...,13}{1} \\ \ganttgroup[progress=57]{WBS 1 Summary Element 1}{1}{10} \\ \ganttbar[ progress=75, name=WBS1A ]{\textbf{WBS 1.1} Activity A}{1}{8} \\ \ganttbar[ progress=67, name=WBS1B ]{\textbf{WBS 1.2} Activity B}{1}{3} \\ \ganttbar[ progress=50, name=WBS1C ]{\textbf{WBS 1.3} Activity C}{4}{10} \\ \ganttbar[ progress=0, name=WBS1D ]{\textbf{WBS 1.4} Activity D}{4}{10} \\[grid] \ganttgroup[progress=0]{WBS 2 Summary Element 2}{4}{10} \\
47
\ganttbar[progress=0]{\textbf{WBS 2.1} Activity E}{4}{5} \\ \ganttbar[progress=0]{\textbf{WBS 2.2} Activity F}{6}{8} \\ \ganttbar[progress=0]{\textbf{WBS 2.3} Activity G}{9}{10} \ganttlink[link type=s-s]{WBS1A}{WBS1B} \ganttlink[link type=f-s]{WBS1B}{WBS1C} \ganttlink[ link type=f-f, link label node/.append style=left ]{WBS1C}{WBS1D} \end{ganttchart}
WEEKS:
1
2
3
4
5
6
7
8
9 10 11 12 13
WBS 1 Summary Element 1
57% complete
WBS 1.1 Activity A WBS 1.2 Activity B
75% complete START-TO-START
WBS 1.3 Activity C
67% complete FINISH-TO-START
50% complete FINISH-TO-FINISH
WBS 1.4 Activity D
0% complete
WBS 2 Summary Element 2
0% complete
WBS 2.1 Activity E
0% complete
WBS 2.2 Activity F
0% complete
WBS 2.3 Activity G
0% complete
TODAY
48
3 Implementation 3.1 Packages pgfgantt is modest in terms of dependencies: It only requires the Tik Z and pgfcalendar packages. \RequirePackage{tikz} \usetikzlibrary{% arrows, backgrounds, calc,% patterns, positioning, shapes.geometric% 5} 6 \RequirePackage{pgfcalendar} 1 2 3 4
7
3.2 Macros for Key and Error Management \ganttset changes the current key path to /pgfgantt/ and then executes the keys in its mandatory argument. 8
\def\ganttset#1{\pgfqkeys{/pgfgantt}{#1}}
The following auxiliary macros save us some code when we devise keys later on. \@gtt@keydef{hkeyi}{hinitial valuei} declares the key /pgfgantt/hkeyi and stores its hinitial valuei. 9 10 11
13 14
\ganttvalueof
\def\ganttvalueof#1{% \pgfkeysvalueof{/pgfgantt/#1}% }
\@gtt@stylekeydef{hkeyi}{hinitial stylei} declares a style hkeyi with an hinitial stylei. 15 16 17
\@gtt@keydef
\def\@gtt@keydef#1#2{% \pgfkeyssetvalue{/pgfgantt/#1}{#2}% }
\ganttvalueof{hkeyi} retrieves the value stored by a hkeyi. Link type authors should be able to use this macro in their code; thus, it lacks any @s. 12
\ganttset
\@gtt@stylekeydef
\def\@gtt@stylekeydef#1#2{% \pgfkeys{/pgfgantt/#1/.style={#2}}% }
\@gtt@PackageError{hmessagei} and \@gtt@PackageWarning{hmessagei} issue a package error or warning hmessagei, respectively. \def\@gtt@PackageError#1{% \PackageError{pgfgantt}{#1}{}% 20 } 21 \def\@gtt@PackageWarning#1{% 22 \PackageWarning{pgfgantt}{#1}% 23 } 18 19
24
49
\@gtt@PackageError \@gtt@PackageWarning
3.3 The Horizontal and Vertical Grid The count register \gtt@currentline holds the current line; it starts from 0 and decreases. \gtt@lasttitleline equals the line of the title element drawn last. \gtt@currgrid is the index of the current grid line drawn. \gtt@chartwidth equals the number of time slots. 25 26 27 28
\gtt@currentline \gtt@lasttitleline \gtt@currgrid \gtt@chartwidth
\newcount\gtt@currentline \newcount\gtt@lasttitleline \newcount\gtt@currgrid \newcount\gtt@chartwidth
hgrid checks whether its value is false and sets the boolean \ifgtt@hgrid accordingly. If the value is true or missing, horizontal grid lines appear dotted. \@gtt@stylekeydef{hgrid style}{dotted} \newif\ifgtt@hgrid \ganttset{% hgrid/.code={% \def\@tempa{#1}% \def\@tempb{false}% 35 \ifx\@tempa\@tempb% 36 \gtt@hgridfalse% 37 \else% 38 \gtt@hgridtrue% 39 \def\@tempb{true}% 40 \ifx\@tempa\@tempb% 41 \def\gtt@hgridstyle{dotted}% 42 \else% 43 \def\gtt@hgridstyle{#1}% 44 \fi% 45 \fi% 46 },% 47 hgrid/.default=dotted 48 } 29 30 31 32 33 34
hgrid hgrid style \ifgtt@hgrid \gtt@hgridstyle
49
The \gtt@hgrid@do macro decomposes the style list for the horizontal grid into its comma-separated items. Each item is analyzed (see below) only if some grid lines are still left to draw. Note the “elegant” quadruple \expandafter construction, which enables tail recursion. \def\gtt@hgrid@do#1,{% \ifx\relax#1\else \ifnum\gtt@currgrid\gtt@chartwidth\breakforeach\fi% 118 }% 119 } 120
3.4 Time Slot Formats \gtt@smugglecount{hcounti} smuggles the local value of a count register over the end of a TEX group. 121 122 123 124 125
\gtt@smugglecount
\def\gtt@smugglecount#1\endgroup{% \edef\@tempa{\the#1}% \expandafter\endgroup\expandafter#1\expandafter=\@tempa% }
\gtt@juliantotimeslot{hcount 1 i}{hcount 2 i} converts the Julian date stored in hcount 1 i to a time slot and stores the latter in hcount 2 i. This macro is called after the start of Gantt chart. Thus, \gtt@startyear, \gtt@startmonth and \gtt@startjulian (see section 3.5) have already been initialized. If the chart is compressed, one time slot corresponds to one month; otherwise, it corresponds to one day. \newcommand\gtt@juliantotimeslot[2]{% \begingroup% \@tempcnta=#1\relax% 129 \ifgtt@compresscalendar% 130 \pgfcalendarjuliantodate{\@tempcnta}{\@tempa}{\@tempb}{\@tempc}% 131 \@tempcnta=\@tempa\relax% 132 \advance\@tempcnta by-\gtt@startyear\relax% 133 \multiply\@tempcnta by12\relax% 134 \advance\@tempcnta by\@tempb\relax% 126 127 128
52
\gtt@juliantotimeslot
\advance\@tempcnta \advance\@tempcnta \else% \advance\@tempcnta \advance\@tempcnta \fi% #2=\@tempcnta\relax% \gtt@smugglecount#2% \endgroup%
135 136 137 138 139 140 141 142 143 144
by-\gtt@startmonth\relax% by1\relax% by-\gtt@startjulian\relax% by1\relax%
}
145
\newgantttimeslotformat{hnamei}{hcodei} defines the macro \gtt@tsstojulian@hnamei{htssi}{hcounti}. This macro executes hcodei (within a group), which should convert htssi to a Julian date and store the date in hcounti. 146 147 148 149 150 151
\newgantttimeslotformat
\newcommand\newgantttimeslotformat[2]{% \expandafter\def\csname gtt@tsstojulian@#1\endcsname##1##2{% \begingroup#2\gtt@smugglecount##2\endgroup% }% }
The predefined time slot formats simple, isodate and isodate-yearmonth are straight forward. \newgantttimeslotformat{simple}{% #2=#1\relax% \advance#2 by\gtt@tsf@startjulian\relax% 155 \advance#2 by-1\relax% 156 } 152 153 154
157 158 159 160 161 162 163 164 165
\newgantttimeslotformat{isodate}{% \pgfcalendardatetojulian{#1}{#2}% } \newgantttimeslotformat{isodate-yearmonth}{% \pgfcalendardatetojulian{#1-01}{#2}% }
\gtt@tsf@getdmy{hdatei} decomposes a hdatei day[sep]month[sep]year (with [sep] representing a period, hyphen or slash) into day, month and year and stores these numbers in \local@day, \local@month and \local@year, respectively. \newcommand\gtt@tsf@getdmy[1]{% \edef\local@firstarg{#1}% 168 \def\local@decompose##1.##2.##3\relax{% 169 \def\local@day{##1}\def\local@month{##2}\def\local@year{##3}% 170 }% 171 \expandafter\local@decompose\local@firstarg..\relax% 166 167
53
\gtt@tsf@getdmy
\ifx\local@month\@empty% \def\local@decompose##1/##2/##3\relax{% \def\local@day{##1}\def\local@month{##2}\def\local@year{##3}% }% \expandafter\local@decompose\local@firstarg//\relax% \ifx\local@month\@empty% \def\local@decompose##1-##2-##3\relax{% \def\local@day{##1}\def\local@month{##2}\def\local@year{##3}% }% \expandafter\local@decompose\local@firstarg--\relax% \ifx\local@month\@empty% \@gtt@PackageError{Illegal time slot specifier ‘#1’.}% \else% \def\local@decompose##1--{\def\local@year{##1}}% \expandafter\local@decompose\local@year% \fi% \else% \def\local@decompose##1//{\def\local@year{##1}}% \expandafter\local@decompose\local@year% \fi% \else% \def\local@decompose##1..{\def\local@year{##1}}% \expandafter\local@decompose\local@year% \fi%
172 173 174 175 176 177 178 179 180 181 182 183 184 185 186 187 188 189 190 191 192 193 194 195 196 197
}
Time slot formats little-endian, big-endian and middle-endian only differ in their call of \pgfcalendardatetojulian. If the year (stored in \local@year or \local@day) lacks a century (e. g., 13 instead of 2013), it is completed according to the value of time slot format/base century. \newgantttimeslotformat{little-endian}{% \gtt@tsf@getdmy{#1}% \ifnum\local@year