This item was submitted to Loughborough’s Institutional Repository (https://dspace.lboro.ac.uk/) by the author and is made available under the following Creative Commons Licence conditions.
For the full text of this licence, please go to: http://creativecommons.org/licenses/by-nc-nd/2.5/
REVIEW PAPER
1079
Driver tracking and posture detection using low-resolution infrared sensing I J Amin, A J Taylor*, and R M Parkin Wolfson School of Mechanical and Manufacturing Engineering, Loughborough University, Loughborough, Leicestershire, UK The manuscript was received on 14 January 2007 and was accepted after revision for publication on 11 June 2007. DOI: 10.1243/09544070JAUTO517
Abstract: Intelligent sensors are playing an ever-increasing role in automotive safety. This paper describes the development of a low-resolution infrared (IR) imaging system for continuous tracking and identification of driver postures and movements. The resolution of the imager is unusually low at 16×16 pixels. An image processing technique has been developed using neural networks operating on a segmented thermographic image to categorize driver postures. The system is able reliably to identify 18 different driver positions, and results have been verified experimentally with 20 subjects driving in a car simulator. IR imaging offers several advantages over visual sensors; it will operate in any lighting conditions and is less intrusive in terms of the privacy of the occupants. Hardware costs for the low-resolution sensor are an order of magnitude lower than those of conventional IR imaging systems. The system has been shown to have the potential to play a significant role in future intelligent safety systems. Keywords: infrared sensing, artificial Neural Network (ANN), machine vision, intelligent safety system
1 INTRODUCTION This paper discusses research into safety systems based on the use of a low-resolution infrared sensor for driver posture detection and position tracking. The ability to detect driver position and movement will be a key enabling factor in the development of a number of current and future safety systems. These may range from detecting out-of-position (OOP) occupants for safe airbag deployment to time-based monitoring of behaviour, for example to detect periods with attention away from the road or evidence of drowsiness. This research has initially been focused on the needs and problems of older, or ‘third-age’, drivers. Transportation by private car is an important factor for the independence and quality of life of many older people. Demographic changes and reductions * Corresponding author: Wolfson School of Mechanical and Manufacturing Engineering, Loughborough University, Ashby Road, Loughborough, Leicestershire LE11 3TU, UK. email:
[email protected]
JAUTO517 © IMechE 2007
in birth rate have resulted in a large increase in the ageing population of industrialized countries. At present, one-third of the population in these nations is over 55 [1, 2] and, with the average age rising, the number of older drivers will continue to increase for the foreseeable future. The deterioration in driving abilities with advancing age is therefore a cause for concern [3]. Deterioration in cognitive, physical, and visual abilities leads to increasing risks for older people [4], although these are mitigated to some extent by fewer and shorter journeys and a tendency to avoid night driving. The term ‘third age’ is generally applied to those over 55, although this definition is not universally accepted [3, 5]. The adage ‘you are as old as you feel’ holds true, and people in their 60s and 70s may be more active than some younger people. However it is clear that, as the ‘grey’ population increases, the needs of the over 55s will have a greater impact on the design of many products in the future. Problems encountered by third-age drivers typically include reading traffic signs and signals, observing road markings, reading the instrument panel, Proc. IMechE Vol. 221 Part D: J. Automobile Engineering
1080
I J Amin, A J Taylor, and R M Parkin
changing lanes or merging in high-speed traffic, turning the head while parking or reversing, making U-turns, and turning at crossroads or T-junctions. Many tasks that involve neck and trunk movements are restricted in older people [6]. Cars must be designed for use by the full spectrum of the adult population. The subject of automotive ergonomics and safety is clearly complex, and a detailed discussion of older drivers’ problems and characteristics is beyond the scope of this paper. It is reasonable to assume that many of the difficulties and risks typically encountered by this older group will also apply to other groups, of any age, whose driving may be affected by physical impairments. The aim of the research described in this paper is to provide the basis for a system that, ultimately, will make driving safer and more pleasant for any impaired, as well as able-bodied, driver. Additionally, the system may provide a convenient and effective ergonomics tool for driver movement and behaviour analysis, since current means of observing and analysing driver activities can be difficult and time consuming. Some current monitoring procedures involve marker-based visual systems, and others use load cells or pressure mats installed in the car seat [7, 8], methods that are not entirely practical for use in real time in a real car environment. Data from load cells and pressure mats cannot be related accurately to posture and behaviour for a number of reasons, including the wide anthropometric variability of the user group coupled with seat angle choices and other possible misleading effects such as a wallet in the back pocket. Also, importantly, they do not provide information on head turning. Infrared (IR) imaging offers the ability to work in any ambient lighting conditions, a major advantage over visual cameras. The IR sensor used throughout this research programme is an IRISYS IRI1002 thermal imager with a resolution of 16×16 pixels. The advantages offered by this particular sensor include the relatively low cost when compared with highresolution IR cameras (hundreds rather than many thousands of pounds) and the small size. Also, importantly, the low resolution protects the privacy of the car occupants as only indistinct images composed of areas of colour or grey levels are obtained.
by the naked human eye, but infrared imagers with different specifications can capture particular ranges of infrared wavelengths. The principle behind infrared emission detection is based on the assumption that the black body is a perfect radiator, emitting and absorbing all energy that is incident on it. The energy emitted by a black body is the highest possible energy emission for that particular temperature. As real objects are not perfect blackbodies, i.e. a perfect absorber or emitter, the emissivity of the real surface is the ratio of the thermal energy emission from the surface to that of a blackbody at the same condition as that of the real body [9, 10]. The infrared imager used in this paper is a longwavelength infrared imager (LWIR), also termed a far infrared imager. It can measure infrared radiation from 8 to 24 mm wavelength and has a low resolution of 16×16 pixels. This low-resolution device is approximately one-tenth of the cost of a conventional infrared imager, allowing infrared imaging to be considered in areas other than military and defence usage.
3 IMAGING ALGORITHM 3.1 Methodology In this study a driver posture tracking system is developed. The tracking algorithm has three stages of processing, as shown in Fig. 1. The processing stage makes use of artificial neural networks (ANNs). The detected posture is converted into a code-based description of the driver’s position after processing, referred to as a ‘p-code’ (Table 1). The data comes from the low-resolution infrared imager installed inside a car at a suitable location, and, in this study, the thermographs from the infrared imager were taken
2 INFRARED THERMOGRAPHY An infrared imager measures infrared radiation emitted by objects – light with a wavelength in the range 0.78–100 mm. This particular range is unseen Proc. IMechE Vol. 221 Part D: J. Automobile Engineering
Fig. 1 System flow chart for the position tracking algorithm JAUTO517 © IMechE 2007
Driver tracking and posture detection
Table 1 Posture codes Region
ANN numerical output
Posture description
p-Code
R1 R1 R1 R2 R2 R2 R3 R3
1 2 3 1 2 3 1 2
Upright posture Leaning forward Looking down Looking ahead Looking left Looking right Hands on steering Hands not on steering
N E D F L R S NS
for offline analysis. Experiments were conducted in a STISIMA car simulator to verify the algorithm developed. 3.2 Preprocessing 3.2.1 Data acquisition software The bespoke data acquisition software used was developed by the authors for both infrared and visual image acquisition using National Instruments LabWindows/CVI. The user interface is shown in Fig. 2. This software acquires webcam images and thermographs in software-based real time. The image acquisition frequency in the experiment was set at two frames per second (FPS), selected on the basis of the length of experiment. Image acquisition was done for the whole length of the simulation scenario. File naming and storing are structured, as a vast amount of data must be stored during each experi-
1081
mental run. Batch renaming and storing data in folder options are therefore included. The DAT file generated by the data acquisition software is read in Matlab using a function written by the author. 3.2.2 Infrared interpolation The interpolation process estimates values of intermediate components of a continuous function in discrete samples. Interpolation is extensively used in image processing to increase or decrease the image size. An interpolation technique does not add extra information into the image but provides a better image for human perception. In this case interpolation simply provides a larger thermograph area to work on, as a 16×16 pixel image, as shown in Fig. 3, does not provide sufficient visual information. There are commonly five types of interpolation used: cubic, spline, nearest, linear, and hypersurface [11]. Linear interpolation was used because it is the simplest type of interpolation and is fast, as less computation is required. A single infrared image is shown in Fig. 3 with four types of interpolation in greyscale. Linear interpolation considers the 2×2 neighbourhood of known pixel values surrounding the unknown pixel. It then takes a weighted average of these four pixels to obtain a final interpolated value. Higher-order interpolation algorithms, such as cubic or spline, take more surrounding pixels into consideration and give sharper images, therefore
Fig. 2 Infrared data acquisition software JAUTO517 © IMechE 2007
Proc. IMechE Vol. 221 Part D: J. Automobile Engineering
1082
I J Amin, A J Taylor, and R M Parkin
values (white) represents the subject. The thresholding value is chosen as the temperature occurring overall in the minimum number of pixels. 3.3.2 Region allocation
Fig. 3 Four types of interpolated infrared image
being valuable in more conventional editing applications. However, as Fig. 3 shows, little would be gained from using higher-order interpolation on these low-resolution images, and processing speed would be greatly reduced. 3.3 Processing 3.3.1 Segmentation The devised adaptive segmentation method is based on the IR histogram. This method will compensate for slight temperature changes. The histogram of thermographs taken from the experiment contains two peaks, one at each extreme (Fig. 4). The peak with the lower intensity values (black) represents the background, and the peak with the higher intensity
After interpolation and segmentation of the infrared thermograph it is divided into three regions, based upon the field of view and the position of the driver, as shown in Fig. 5. The full image size is 121×121 pixels. Splitting of the IR image into three regions is a novel approach used as the basis for an algorithm designed to maximize the information gained from the limited-resolution thermograph. The three regions are associated with different parts of the driver’s body and generally indicate different types of activity. These regions are labelled as torso region R1, head region R2, and arm and shoulder region R3. With the infrared imager 1 m away, mounted on the front left (passenger-side) ‘A’ pillar of the car, the field of view is 355 mm square approximately. Torso region R1 is termed as such because any activity in this region necessitates trunk movement, and therefore it becomes the focus when the driver is leaning or looking down. This part of the infrared image is about 180×200 mm in size, or 61×80 pixels. Head region R2 focuses on head movements and is the most critical area. Its size in the infrared image is again 180×200 mm divided into 61×80 pixels. Arm and shoulder region R3 looks for arm and shoulder movements with respect to the steering wheel. This is the region where most movements are recorded whenever the driver changes posture or
Fig. 4 Histogram of an infrared thermograph Proc. IMechE Vol. 221 Part D: J. Automobile Engineering
JAUTO517 © IMechE 2007
Driver tracking and posture detection
1083
Fig. 5 Region allocation within the infrared image
moves the steering wheel. The location of region R3 is the lower part of the infrared image with a 150×355 mm field of view, containing 121×41 pixels. 3.3.3 p-Code description For neural network results to be easily readable, a numerical value for each region is allocated that points to a particular type of posture. These values are then used to identify a unique letter code, or p-code, that describes the body position in each region. All three region codes are then combined to describe a particular posture. For example, N-R-S indicates an upright position and looking right with hands on the steering wheel, typical of a posture adopted when entering a roundabout or at a T-junction (see the later comparison with real video data). In comparison, D-L-NS would indicate a driver looking down to the left side with hands not visible on the steering wheel, which means that the driver might be putting on a seat belt or accessing a dashboard compartment, and therefore, if the movement is any more than momentary, the car should not be in a moving state. 3.3.4 Feature extraction Selection of features from the image is a vital step in enabling the imaging algorithm to give useful and accurate results. Therefore, a great deal of care needs to be taken in feature selection, and a procedure has been devised to find each appropriate feature for neural network input (see Fig. 6). Each of the three regions of the IR image is dealt with separately as far as feature selection and JAUTO517 © IMechE 2007
recognition are concerned. The three categories of posture that will be defined in the neural network are non-leaning postures, leaning postures, and looking down postures. Head region R2 is considered the most critical. The three main movements identified in this region are looking ahead, i.e. normal driving, looking right, and looking left. In the shoulder and arm region R3, two positions are identified for training the neural network: hands on and hands off the steering wheel. In region R2, numerous thermograph samples are taken for each volunteer in the first posture, i.e. ‘looking ahead’. Similar samples are also obtained for the two other postures, i.e. looking left and looking right. Two imaging features, i.e. angle and area, from the above-mentioned thermograph images are used to distinguish between the three postures. 3.3.5 Neural network construction and training The neural network for each region is separate, hence there are three neural networks working simultaneously on a single thermograph. Furthermore, for the purpose of comparing the types of neural network for each region, three different types of neural network are constructed. These are the multilayered perceptron (MLP), radial basis network (RBN), and self-organized map (SOM) networks. Comparison and evaluation of all three networks results in determining the best neural network for that particular region. These three types are selected because each has good ability to differentiate between different parameters [12]. Training data are selected to cover all types of motion and the frequency of motion. A total of 300 training samples for each region are taken, i.e. 100 Proc. IMechE Vol. 221 Part D: J. Automobile Engineering
1084
I J Amin, A J Taylor, and R M Parkin
Fig. 6 Feature selection process
samples for each different output. All types of network constructed for each region and for each subject contain a common set of input data and a simulation set 3 times larger to verify the results, i.e. 900 simulation samples in all. The construction of all nine neural networks is shown in Table 2.
car. Driving simulator scenarios were developed to enable subjects to interact and drive as realistically as possible. 4.1 Driving volunteers Twenty subjects were studied during this experiment – ten male and ten female drivers, with ages ranging from 17 to 65 years old. All subjects had driving experience, with the older drivers having the most experience.
4 EXPERIMENTATION The objective of the experiment was to acquire representative information from the infrared imager to test and validate the driver posture tracking methodology. The conditions in the experiments were arranged to be as close as possible to that of driving a real
4.2 IRISYS imager: serial protocol programming The IRISYS IRI1002 thermal imager has its own protocol which needed to be converted into an infrared image. The software has to be compatible
Table 2 Neural network construction specifications Torso region R1
Head region R2
Arm and shoulder region R3
Inputs
1 (area R1)
2 (area/angle R2 and area R2)
2 (area R3)
Multilayer perceptron (MLP)
Layers 2, neurons 2 Inner layer: sigmoid function Output layer: linear function Goal 0.001
Layers 2, neurons 5 Inner layer: sigmoid function Output layer: linear function Goal 0.001
Layers 2, neurons 5 Inner layer: sigmoid function Output layer: linear function Goal 0.001
Radial basis network (RBN)
Spread constant 1 Inner layer: radial function Output layer: linear function
Spread constant 1 Inner layer: radial function Output layer: linear function
Spread constant 1 Inner layer: radial function Output layer: linear function
Self-organizing map (SOM)
Goal 0, epochs 25
Goal 0, epochs 25
Goal 0, epochs 25
Proc. IMechE Vol. 221 Part D: J. Automobile Engineering
JAUTO517 © IMechE 2007
Driver tracking and posture detection
with hardware specifications for the thermal imager, i.e. 1 15 200 baud, eight data bits, no parity, one stop bit, and no handshaking. 4.3 Infrared acquisition software Infrared acquisition software developed by the authors was used in this experiment and has also previously been used by Amin et al. [13, 14]. This software acquires webcam images and thermographs in real time. The image frequency in the experiment was set at 2 FPS. This image acquisition frequency was selected on the basis of the length of experiment, and image acquisition was carried out for the whole length of the simulation scenario. 4.4 Mounting of the IRISYS imager The infrared imager was the main instrument used to acquire driver information during the experiment. The infrared imager and visual camera were mounted close together on a test rig. The camera was positioned on the left (passenger-side) windscreen pillar, making an angle of 60° with the longitudinal direction. The lens field of view (FOV) was 20° and the IR camera was mounted approximately 1 m away from the seat head rest. With the image capturing 355 mm square from the angled position, it manages to acquire the face, shoulders, and arm with the hands on the upper half of the steering wheel.
1085
4.5 Visual camera A visual (CMOS) web camera was used for the purpose of adjusting the field of view of the IR imager and for verification of the results taken from the IR imager after processing. 4.6 Driving simulator The driving simulator comprised a custom-built test rig with a front projection screen and adjustable driving controls (Fig. 7). A separate control room housed a driver communication system and the STISIMA driving simulation software on an IBM PC. The driver was kept in contact with the researcher by means of the driver communication system during the length of the experiment. The STISIMA driving simulator was programmed for the MS-DOS operating system. The simulator is designed such that it provides the driver with realistic driving experience, using both the visual display and audio effects as feedback to driver actions. 4.7 Scenario The scenario selected for the experiment involved busy urban traffic, lasting for approximately 20 min. An urban traffic scene was selected because the number of tasks during driving is much higher than for motorway or trunk-road driving. The scenario
Fig. 7 Driving simulator test rig JAUTO517 © IMechE 2007
Proc. IMechE Vol. 221 Part D: J. Automobile Engineering
1086
I J Amin, A J Taylor, and R M Parkin
involved a number of tasks performed by the volunteer as well as going through the driving simulation. These tasks included putting a seat belt on, adjusting mirrors, looking in the rear view mirror, looking left or right, using a swipe card to simulate entering a secured car park, mobile phone usage while driving, and using an in-car stereo system or climate control. These tasks were in addition to other conventional driving tasks, such as looking left or right before making a turn, arriving at traffic lights and waiting for a signal, lane-changing manoeuvres, and looking at side- and rear-view mirrors. A second scenario was conducted for monitoring fatigue and sleepiness in drivers while driving for longer periods. A long road with curves was programmed in a scenario that lasted for over 50 min, and curtains were drawn over the simulator test rig to give the driver a sense of driving alone. Noise was cut to a minimum, less traffic was shown on the road, and the drivers were asked to maintain a constant speed of 60 mile/h.
Fig. 9 ANN simulation result for head region R2
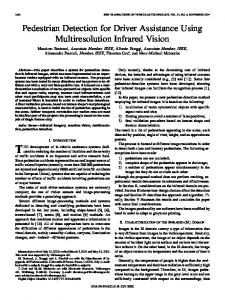
5 EXPERIMENTAL RESULTS 5.1 ANN simulation The simulation set was 3 times the size of the training dataset. Examples of simulation set results are plotted in Figs 8 to 10. The plots are for a single human subject and were chosen to represent an average identification accuracy rate. The different postures in the graphs are linked with the numerical postural code, or p-code – the closer the actual result plot to the posture code, the more accurate is the detection. The figures show a very reliable response. Clearly, in practice occasional frames will give inaccurate results. The posture detection algorithm runs at 4 FPS, i.e. analysing four thermographs per second, so overall
Fig. 8 ANN simulation result for torso region R1 Proc. IMechE Vol. 221 Part D: J. Automobile Engineering
Fig. 10 ANN simulation result for arm and shoulder region R3
accuracy is time related. When a thermograph ANN output gives an inaccurate result or abnormality, this is corrected in subsequent thermographs. Additionally there are three regions combined to give the final result. Reliability and robustness overall are therefore very high. Each driver volunteer is considered individually for ANN training, and therefore the system can detect the same posture with similar accuracy for all subjects. This means that a person with long hair or short hair will not have different accuracies in the system owing to the thresholding of thermographs and individual driver training. In practice, a new driver using the vehicle for the first time will need to go through a simple training procedure, involving movements such as turning the head to left and right, leaning forward, and positioning hands on and off JAUTO517 © IMechE 2007
Driver tracking and posture detection
the steering wheel. A time of approximately 1–2 min would be required to create a custom profile of the person. 5.2 Real-life data comparison with results Video footage of 20 volunteers driving in urban areas and, later, on a motorway was taken. Ten volunteers were below the age of 45, whereas the other ten were over the age of 55. The groups of volunteers were 50 per cent male and 50 per cent female. Each video lasted for at least 45 min depending upon the time each volunteer took to drive from start to finish. The video footage of each volunteer was analysed by taking a movement description and the time taken, and also the p-code was identified and noted. A particular pattern of movements relates to the p-code generated during the video analysis. The movement for each motion detected may be a single event, such as looking right, for example, or it could be a series of movements to carry out a particular manoeuvre, such as putting on a seat belt. This series of movements will create a pattern for that manoeuvre that is more or less the same for most drivers. A few examples of the patterns of motion with p-codes are given in Table 3. The larger manoeuvres are broken down into smaller movements which the safety system detects.
6 DISCUSSION Low-resolution infrared imaging has been shown to be an effective means of monitoring driver posture and movements to provide a number of important physical indicators of driving behaviour. IR imaging is a practical and non-intrusive method of occupant tracking that does not invade the privacy of individuals in the way that visual imaging may be perceived to do and therefore should be ethically acceptable. The system using neural network analysis has been shown to be robust. IR imaging has the advantage of
1087
being entirely independent of lighting conditions. The low resolution allows hardware costs to be kept down, and further reductions will be possible by design for mass production to achieve appropriate cost levels for mid-range and, ultimately, smaller cars. The low resolution means that this safety system cannot detect eye gaze or small movements of the driver’s head. Eye gaze can be anything from looking in the side- and rear-view mirrors to observing scenes on the road. The imaging system as developed can identify 18 different driver postures or movements and reliably interpret these in the form of p-codes. Single-frame analysis can then provide valuable information on occupancy and position, for example OOP drivers, the driver’s physique, and eye height estimates, all of which are important considerations for safe airbag deployment. Further analysis based on time histories will be able to identify a range of high-risk situations. For example, impaired movements can cause difficulty in turning the head sufficiently for adequate vision at junctions and for checking of blind spots. Poor trunk stability can cause lack of confidence and degraded car control. These are typical problems encountered by many older people or people impaired by disability or injury. Although it may be used in a stand-alone mode, the greatest potential of the IR imaging system will be realized as part of an integrated multisensor intelligent safety system. The system needs to run in real time and the algorithm has been designed with this in mind. The interpretation or significance of events and behaviours will clearly depend to an extent on the state of the vehicle, for example whether it is stationary or in motion, driving straight, or turning. Simply linking the IR system with road speed, throttle, and braking information is straightforward and low cost and can provide a rich data source that can be used to identify high-risk situations or behaviours, such as evidence of drowsiness or time with attention away from the road while the vehicle is in motion.
Table 3 Examples of driver positions found from the videos
1 2 3
Task
Time (s)
p-Code
Comments
Applying handbrake Left turn (T-junction or crossroad) Look right Turn left (driver looks ahead) Left turn (T-junction or crossroad) Look right Turn left (driver looks ahead)
2
D-L-S
3 1
N-R-S N-F-S
One hand on steering wheel Subject brakes and carries out following movement Less traffic
6 1
N-R-S N-F-S
JAUTO517 © IMechE 2007
Heavy traffic from right
Proc. IMechE Vol. 221 Part D: J. Automobile Engineering
1088
I J Amin, A J Taylor, and R M Parkin
This research has shown that a low-resolution 16×16 pixel IR imager can play a significant role in the next generation of intelligent safety systems.
REFERENCES 1 World Health Organisation, Population ageing – a public health challenge, WHO Fact Sheet 135, 1998. 2 Dissanayake, S. and Lu, J. J. Factors influential in making an injury severity difference to older drivers involved in fixed object–passenger car crashes. Accid. Analysis and Prev., 2002, 34(5), 609–618. 3 Carr, D., Jackson, T. W., Madden, D. J., and Cohen, H. J. The effect of age on driving skills. J. Am. Geriatrics Soc., 1992, 40(6), 567–573. 4 Lundberg, C., Hakamies-Blomqvist, L., Almkvist, O., and Johansson, K. Impairments of some cognitive functions are common in crash-involved older drivers. Accid. Analysis and Prev., 1998, 30(3), 371–377. 5 Reuben, D. B. Assessment of older drivers. Clinics in Geriatric Med., 1993. 9(2), 449–459. 6 Smith, D. B. D., Meshkati, N., and Robertson, M. M. The older driver and passenger. In Automotive ergonomics (Eds P. Peacock and W. Karwowski), 1993, p. 461 (Taylor and Francis, London). 7 Andreoni, G., Santambrogio, G. C., Rabuffetti, M., and Pedotti, A. Method for the analysis of posture and interface pressure of car drivers. Appl. Ergonomics, 2002, 33(6), 511–522. 8 Rakheja, S., Haru, I., and Boileau, P. E. Seated occupant apparent mass characteristics under automotive postures and vertical vibration. J. Sound Vibr., 2002, 253(1), 57–75. 9 Burney, S. G., Williams, T. W., and Jones, C. H. Applications of thermal imaging, 1988 (Institute of Physics Publishing, Bristol). 10 Holst, G. C. Common sense approach to thermal imaging, 2000 (SPIE-International Society for Optical Engineers, Bellingham, WA).
Proc. IMechE Vol. 221 Part D: J. Automobile Engineering
11 Kulkarni, A. D. Artificial neural networks for image understanding, 1993 (John Wiley & Sons, Inc., New York). 12 Al-Habaibeh, A. and Parkin, R. M. An autonomous low-cost infrared system for the on-line monitoring of manufacturing processes using novelty detection. Int. J. Advd Mfg Technol., 2003, 22(3–4), 249–258. 13 Amin, I. J., Taylor, A. J., and Parkin, R. M. In-cabin occupant tracking using a low-cost infrared system. In Proceedings of the IEEE Mechatronics and Robotics Conference, Aachen, Germany, 2004. 14 Amin, I. J. Sensor fusion of visual and infrared system for monitoring people. MSc Thesis, Wolfson School of Mechanical and Manufacturing Engineering, Loughborough University, 2003, p. 187.
APPENDIX Notation ANN f i FPS IR LWIR L (q) i MLP OOP p-code P(q) q RBN R1 R2 R3 SOM
artificial neural network known values on the grid at points q i frames per second infrared long-wavelength infrared Lagrange polynomial multilayer perceptron out of position a unique letter code describing a body position interpolated value point at which interpolation takes place radial basis network segmented region of the image forward of the driver segmented region of the image containing the driver’s head lower segmented region of the image self-organizing map
JAUTO517 © IMechE 2007