The OLT is connected to a passive optical splitter using an optical trunk fiber, which ... In an EPON, all downstream (from the OLT to the ONU) Ethernet frames ...
Dynamic bandwidth allocation algorithms in EPON: a simulation study D. Nikolova, B. Van Houdt, and C. Blondia University of Antwerp, Dept. Math. and Computer Science, Performance Analysis of Telecommunication Systems Research Group, Middelheimlaan, 1, B-2020 Antwerp, Belgium ABSTRACT In this paper we present a dynamic bandwidth allocation algorithm for EPON, which makes use of the Multipoint Control Protocol (MPCP) with threshold reporting and with inter- and intra-ONU priority scheduling. Three varieties of this algorithm are compared, by means of a detailed simulation program, regarding average packet delay for several priorities, delay variation for constant bit rate (CBR) traffic and bandwidth utilization. We show that by introducing a specific intra-ONU priority scheduling algorithm, which takes the reported values into account, the bandwidth can be fully utilized. However, this scheduling algorithm causes an increased packet delay and delay variation for CBR traffic. In order to eliminate this drawback, we combine this scheduling algorithm with a rate-based scheme for the highest priority (CBR) traffic. This combined algorithm provides an interesting tradeoff between the efficiency, which is still near to the optimal, and the delay characteristics of time critical applications. Finally, we also include a comparision with a standard intra-ONU priority scheme. Keywords: EPON, passive optical networks, FTTH, Multipoint Control Protocol (MPCP), Dynamic Bandwidth Allocation (DBA) algorithm, threshold reporting
1. INTRODUCTION A passive optical network (PON) is a subscriber access network technology that provides high bandwidth capacity. It is a point to multipoint network with a tree topology. The terminal equipment connected at the trunk of the tree is referred to as an optical line terminal (OLT) and typically resides at the service provider’s facility. The OLT is connected to a passive optical splitter using an optical trunk fiber, which fans out at the splitter to multiple optical drop fibers to which Optical Network Units (ONUs) are connected. ONUs typically reside at the subscriber premises, which can be end-user locations or curbs resulting in different fiber-to-the home, business or curb (FTTx) architectures (fiber-to-the-home, fiber-to-the-business or fiber-to-the-curb). Two standardization bodies are currently working on PONs. The International Telecommunication Union has already a family of standards regarding PON1 with Asynchronous Transfer Mode (ATM) as the data-link layer and is currently developing a second one with a new, still to be standardized, data-link layer. Within the IEEE there is a working group (802.3ah) standardizing Ethernet based PONs (EPON). 2 The Ethernet protocol is highly deployed in local area networks (LANs) and it is also becoming an emerging technology for wide area networks (cfr. Metro Ethernet). Therefore, it is natural that the subscriber access network also offers an Ethernet solution. In an EPON, all downstream (from the OLT to the ONU) Ethernet frames transmitted by the OLT, reach all ONUs. ONUs will discard frames that are not addressed to them. In the upstream direction (from the ONU to the OLT) the signal transmitted from the ONU is received only by the OLT. The OLT arbitrates the upstream transmissions from the ONUs by allocating Transmission Windows (TWs), which can have variable lengths. An ONU is only allowed to transmit during the TWs allocated itself. In order to inform the OLT about its bandwidth requirements, ONUs use REPORT messages∗ that are also transmitted (along with the data) in the TW. Frames are never fragmented in EPON, therefore, the IEEE working group also introduced the concept of reporting with “thresholds” in order to achieve a higher bandwidth efficiency (see Section 2.2.1). ∗
{dessislava.nikolova, benny.vanhoudt, chris.blondia}@ua.ac.be See Section 2.2.1.
Tx
Rx
ON
rec.
Data frames
Tx
Tx
Rx
OFF
ON
rec.
Data frames
Tx OFF
Guard time Ethernet frame 1
Ethernet Frame 2
Frame 1
Frame 2
-preamble
Idle
-IPG
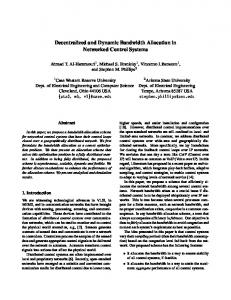
Figure 1. Transmission window and frame format
A time division multiple access scheme with fixed length TWs assigned to each ONU was analyzed in. 3 The disadvantage of this scheme is, obviously, that no statistical multiplexing is possible. Another, more efficient, algorithm where the length of the TWs depends on the ONU’s current bandwidth requirements, was proposed in4 and extensively studied and improved in.5 Roughly speaking, this algorithm works as follows: all ONUs get a TW in a cyclic order, during each TW an ONU will transmit some data as well as a REPORT message to update the OLT’s knowledge about this ONUs bandwidth requirements. The length of a TW of ONU i is completely determined by the contents of the REPORT transmitted in the previous TW of ONU i, that is, the OLT grants a TW with a length equal to the minimum of the requested amount of bandwidth and a predefined maximum (plus the size of a REPORT message). This basic scheduling algorithm was also enriched with a two-stage queueing system at the ONU and a CBR credit scheme (see5 for details). Our work differentiates itself from this prior work by studying the impact of the threshold reporting on the delay and efficiency of the system. Also, the scheduler introduced in this paper should provide better QoS guarantees because it realizes both intraand inter-ONU priority scheduling. In Section 2 we present the current state of the standardization efforts regarding EPON. The bandwidth allocation algorithm is introduced in Section 3. The threshold assignment scheme used in this paper is discussed in Section 4, whereas Section 5 describes a way to incorporate a bandwidth allocation scheme for constant bit rate (CBR) traffic in the algorithm. In section 6 the simulation results are presented, while in Section 7 conclusions are drawn and future work is discussed.
2. EPON: A STATE-OF-THE-ART This section provides an overview of the current state of the EPON standardization efforts made by the 802.3ah working group.
2.1. General parameters, transmission window and frame formats An EPON supports a nominal bit rate of 1000Mb/s, shared amongst the ONUs, which can be at a maximum distance of 20 km. There are two wavelengths – one for the down- and one for the upstream direction. The OLT and the ONUs transmit Ethernet frames at wire speed. In front of each frame there is a preamble of 8 bytes and between two frames there is at least a 12 byte inter-packet gap (IPG).6 Between the TW of two ONUs there is a certain guard time g needed to account for the laser on (TxON ) and off (TxOF F ) times, receiver recovery times and other optics related issues (Rxrec ) (see Figure 1).
2.2. Multi-point control protocol (MPCP) The Multi-point control protocol (MPCP) defines the messages used to control the data exchange between the OLT and the ONUs as well as the processing of these messages. The OLT assigns the TWs via GATE messages. Each ONU uses a set of queues to store its Ethernet frames and starts transmitting them as soon as its TW starts. An ONU can support up to 8 priority queues as defined in 802.1Q.7 During a TW the ONU sends data and/or other management messages such as the REPORT message, the contents of which reflects the ONU’s current bandwidth requirements. The ONU can also be forced to send a REPORT message within a TW. All MPCP
Octets
Repeated n times as indicated by Number of queue sets
Destination Address Source Address Length/Type = 88-08 Opcode = 00-03 Timestamp Number of queue sets Report bitmap Queue #0 Report Queue #1 Report Queue #2 Report Queue #3 Report Queue #4 Report Queue #5 Report Queue #6 Report Queue #7 Report Pad/Reserved FCS
6 6 2 2 4 1 1 0/2 0/2 0/2 0/2 0/2 0/2 0/2 0/2 0-39 4
Figure 2. Format of a REPORT message
messages are transmitted as Ethernet frames. During a TW, an ONU is free to transmit its Ethernet frames according to an internal scheduling algorithm. Ethernet frames are not fragmented, causing idle periods in the TWs. For example, if an ONU was granted a TW of 1000 bytes and it has 10 frames ready for transmission, each of with a length of 101 bytes (including preamble and IPG), it will send only 9 frames in this TW, which leaves 1000-9*101=91 bytes unused. Also, as the order of Ethernet frames must be retained, it is not possible to transmit another frame (from the same queue) that fits in the remainder of the TW. To deal with this drawback the threshold reporting concept was introduced (see Section 2.2.1). 2.2.1. REPORT messages An ONU transmits its current bandwidth requirements to the OLT by means of a REPORT message. These requirements are indicated by the number of bytes waiting in each queue where the granularity of the reported queue value is 2 bytes. This would imply that there is only one value for each queue in a REPORT message, being the current queue length. However, within MPCP, there can be several Queue Reports (QRs) for one queue in a single REPORT message (allowing an ONU to provide some information on the frame bounds as well). As stated earlier, REPORT messages are transmitted as Ethernet frames as can been seen from the format of the REPORT message (Figure 2). The Report bitmap identifies the queues for which QRs follow, e.g., 10011000, indicates that 3 QRs, one for the priority 0, 3 and 4 queue, follow the report bitmap. The timestamp indicates the local time when the i message is transmitted by the ONU. In MPCP, ONU i can have several threshold values τ j,l for queue j (with l = 1, . . . 13). These thresholds are used by the ONU to determine the values of the QR fields (see Figure 3). Denote βji (n) as the total size of the first n packets waiting in queue j at ONU i. ONU i is said to use the i i < βji (n + 1). Infinity can if it includes βji (n) as a QR in the REPORT message, where βji (n) < τj,l threshold τj,l also be a threshold value, meaning that an ONU will report all the bytes waiting in this queue. The length of the REPORT message is 64 bytes and when we add the IPG and the preamble we find that a REPORT message has a length of 84 bytes. From these at most 40 bytes are used to report the bandwidth requirements of an ONU (see Figure 2). 2.2.2. GATE messages The GATE message contains the starting time and the length of a TW, taking the guard time into account. For example, if the OLT wants to grant a transmission window for 1000 bytes to ONU i it actually grants 1000 + g bytes where g is the guard time. GATE messages are transmitted as Ethernet frames of 64 bytes.
Size buffered frames MAC Frame #N Second threshold MAC Frame #5 MAC Frame #4 First threshold
Size of the buffered frames bellow the second threshold
MAC Frame #3 MAC Frame #2 MAC Frame #1
Size of the buffered frames bellow the first threshold
Figure 3. Threshold Reporting
3. THE UPSTREAM BANDWIDTH ALLOCATION ALGORITHM This section introduces our bandwidth allocation algorithm. The proposed algorithm is cycle based, where a cycle is defined as the time that elapses between 2 “executions” of the scheduling algorithm. A cycle has a variable length confined within certain lower and upper bounds, which we denote as Tmin and Tmax (sec), meaning that the algorithm schedules between Bmin and Bmax (bytes) at a time, where Bi is found by multiplying Ti by the line rate. During each cycle each ONU is granted exactly one TW and each registered ONU is forced to send a REPORT message during its TW, thus, even if an ONU reported nothing to the OLT, it is granted a TW by the OLT that is sufficiently large for one REPORT message. Thus, the number of bytes that the OLT needs to ˆmin = Bmin −N (84+g) and B ˆmax = Bmax −N (84+g) bytes (recall, a REPORT requires schedule is bounded by B 84 bytes), where N is the number of registered ONUs. An execution of the scheduling algorithm produces a set of ONU assignments ai , where ai indicates the amount of bytes that an ONU is allowed to transmit in its TW during the next cycle (see Section 3.4). The length of the TW for ONU i is set to w i = ai + 84 + g (bytes). The REPORT messages used by the OLT to schedule cycle n + 1 are exactly those that were received during cycle n. Now, due to the distance between the OLT and the ONUs, it should be clear that the REPORT message of some ONUs might not reach the OLT before it executes its algorithm. Indeed, there should be enough time left for the GATE messages that are produced using the results of an execution, to reach the most distant ONU before the start of cycle n + 1 (which coincides with the end of cycle n) because the first TW of cycle n + 1 could be assigned to this ONU. This in its turn implies that the ONUs scheduled at the end of a cycle are somewhat disadvantaged. Therefore, we decided to make the ONU order within a cycle random. The starting time si of the TW of the i-th ONU in cycle n + 1, for i = 1, . . . , N , is found as si−1 + wi−1 /(line rate), where s0 represents the end of cycle n. Before setting the starting time of the GATE messages the si values are recalculated based on the knowledge of the round-trip times of each ONU to represent their local time.2
3.1. REPORT message generation at the ONU i Several thresholds, denoted as τj,l for l = 1, . . . 13, are associated to each queue j of ONU i. We assume that the i i condition τj,l < τj,l+1 is satisfied. Recall that a REPORT message uses 39 bytes for the QRs and their associated bitmap fields, as a result there can be at most 13 QRs for the same queue j of ONU i in a REPORT message † .
In the current algorithm the last threshold for each queue equals infinity (see Section 4), to allow reporting of the total number of bytes waiting in a queue. The ONU includes in each REPORT message at least one QR for each queue j = 0, . . . , P − 1 that has a length different from 0. Also, the QRs for the queue with the highest priority (priority 0) are created first. The following 3 step algorithm is used to generate a REPORT message: †
This can happen if queue j of ONU i is the only non-empty queue. In this case the REPORT message would contain 13 bitmap fields with a single bit set to one, where each bitmap is followed by a single QR; hence, 39 bytes are used to report the state of queue j.
i i • STEP 1: ONU i generates, for each queue j, a set of 13 values vj,l = maxn {βji (n)| βji (n) < τj,l }. Next, i i i i i i i define the set Vj as {vj,l | 0 6= vj,l 6= vj,l−1 } and let θj = 1 if Vj is not empty and let θj = 0 otherwise. i Ideally, ONU i would like to include a QR for each value vj,l in Vji for all queues j. However, due to the limited size of a REPORT message, this is often impossible. As a result, a selection has to be made.
• STEP 2: Keeping in mind that ONU i has to include at least one QR P for each queue j for which the set Vji is not empty, we find that ONU i includes at most x = b(39 − 2 j>0 θji )/3c QRs for queue 0 (2 bytes are used for the QR, 1 for the corresponding bitmap). Hence, ONU i will include ni0 = min(x, |V0i |) QRs for queue 0. • STEP 3: Denote nij as the number of QRs that are included for queue j (by ONU i). After creating the QRs for the queues 0, . . . , j − 1 we have at most X X y = 39 − 2 nik − max nik − 2 θki k 0) also increases, causing a shorter mean cycle length. Again, due to the better efficiency of R-IPSA compared to R-FPSA, we need a higher data load ρd to reach the maximum cycle length. The higher variation for ρd large is caused by the burstiness of the low priority traffic (that determines the boundaries of the TWs). For IPSA we can see a slight increment in the average queueing delay for ρp in the [0, 0.6] area, although the cycle length is also minimal in this region. The increasing delay can be explained as an effect caused by the IPS scheduling algorithm as follows. In low load situations, an ONU generally gets a TW that is larger than the amount of bandwidth requested. As a result, some (or all) of the data that arrived since the transmission of the last REPORT message, can also be transmitted in the TW. For very low loads this actually causes ONUs to report 0 bytes for all the queues (as reporting happens at the end of the TW), therefore the IPS scheduling reduces to FPS (see Section 3.2) and all the CBR traffic is transmitted first. However, as the load ρ d increases some of the newly arrived low priority traffic will not be able to use the TW anymore and therefore the ONU will report some low priority traffic. The IPS scheduling algorithm will transmit this reported low priority data before the CBR traffic; hence, the CBR traffic shifts to the back of the TW as the load increases. This explains the slight increment in the mean delay. Also, due to the burstiness of the low priority traffic, we get a slight increment in the delay variation. If we further increase ρd (beyond 0.6), some of the CBR traffic will no longer be able to use the TW, causing an additional delay of one cycle. Thus, more and more CBR traffic will suffer this additional delay until eventually all CBR traffic suffers a delay of approximately 1.5 cycles (explaining the strong increase in the mean delay and the delay variation). The peak in the delay variation at 0.8 corresponds to the situation where about half of the CBR traffic uses the first TW after being generated and the other half uses the second TW (this can be seen from the mean delay curve, because the data point for ρ d = 0.8 is located halfway between the two high load plateaus). Finally, the efficiency obtained by IPSA is even higher compared to R-IPSA, because with R-IPSA you only have a good estimation of the CBR traffic present in the ONU and not the exact value. It is clear that IPSA pays a high prize in terms of the delay to achieve this minor efficiency improvement. The average queueing delay for priority 1 and 2 traffic is represented in Figure 7. The mean delay of the priority 1 traffic is substantially higher for R-IPSA and IPSA compared to R-FPSA. This is an obvious consequence of the IPS scheduling, which transmits reported priority 2 traffic before unreported priority 1 traffic. Moreover, in high load situations, IPS forces some priority 1 traffic to wait an additional cycle due to earlier reported priority 2 traffic. The priority 1 delays of IPSA are slightly better than those of R-IPSA because IPSA may transmit priority 1 traffic before priority 0 traffic, which is never the case with R-IPSA (see Section 5). With respect to the priority 2 traffic, we obviously find that R-FPSA achieves the worst results. The strong delay increment for ρd in the [0.6, 0.8] region is caused by the fact that the uplink channel becomes saturated. Indeed the actual load ρ on the channel is higher than the data load ρd due to the overhead caused by the preamble, the IPG, guard time g and possible the idle period at the end of a TW. A less efficient algorithm
10000 R-FPSA R-IPSA IPSA
1.8
(a)
Delay [ms]
1.6
R-FPSA R-IPSA
1000
1.4 1.2 1
(b)
0.8
Delay [ms]
2
IPSA
100 10
0.6
1
0.4 0.2
0.1
0 0
0.2
0.4 0.6 total load r d
0.8
1
0
0.2
0.4
0.6
0.8
1
total load r d
Figure 7. the average queueing delay for (a) the priority 1 and (b) the priority 2 traffic.
causes channel saturation at a lower data load ρd . This is confirmed by comparing Figure 6b and Figure 7b. Finally, the nearly stable delay for ρd beyond 0.8 is caused by the finite buffers.
7. CONCLUSIONS AND FUTURE WORK In this paper we proposed a new dynamic bandwidth allocation algorithm for EPON that uses threshold reporting and supports different priorities. Three varieties of this algorithm, being IPSA, R-FPSA and R-IPSA, were compared regarding the packet delay, the delay variation and the bandwidth efficiency. The three algorithms differ in their CBR traffic allocation method and their intra-ONU priority scheduling algorithm (FPS/IPS). We have demonstrated that with IPSA it is possible to reduce the bandwidth losses, caused by not fragmenting Ethernet frames, to almost zero. The drawback of IPSA is a strong increase of the average queueing delay and the delay variation for the highest priority traffic (CBR traffic) at high data loads. By combining IPSA with rate based scheduling for CBR traffic (R-IPSA), one can significantly reduce this high load delay increment. With respect to the bandwidth efficiency and the delay of the lower priority traffic, IPSA was shown to perform slightly better than R-IPSA. Combining FPS at the ONU with the rate based scheduling for CBR traffic (R-FPSA) results in a priority 0 performance similar to R-IPSA, but improves the average queueing delay characteristics of the priority 1 traffic. The drawback of R-FPSA compared to R-IPSA is a significant reduction in the bandwidth efficiency and, to a lesser extent, an increment in the priority 2 traffic delay characteristics. Future work will consist of further clarifying the following issues: what is the tradeoff between implementing dynamic or fixed length cycles, what is the exact impact of the threshold assignment scheme on the performance and is it worth to implement threshold reporting without IPS scheduling at the ONU ? Finally, we are exploring the possibility to replace the analytical C-MMBP input traffic for the priority 1 and 2 traffic by a trace-driven input source.
Acknowledgements The second author is a Postdoctoral Fellow of the FWO-Flanders, the first and third author were supported by Alcatel-Belgium. We would like to thank E. Six, T. Van Caenegem, C. Dessauvages and E. Ringoot of Alcatel-Belgium for their valuable comments and suggestions on this work.
REFERENCES 1. ”A Broadband optical access system with increased service capabilities using dynamic bandwidth assignment”, ITU-T G.983.4, Nov 2001. 2. ”Media Access Control Parameters, Physical Layers and Management Parameters for subscriber access networks”, IEEE Draft 802.3ah/D1.414, March 2003.
3. G. Kramer, B. Mukherjee, and G. Pessavento, “Ethernet PON (ePON): Design and Analysis of an optical access network”, Photonic Network Comm. 3, pp. 307–319, July 2001. 4. G. Kramer, B. Mukherjee, and G. Pessavento, “Interleaved Polling with Adaptive Cycle Time (IPACT): a dynamic bandwidth distribution scheme in an Optical access network”, Photonic Network Comm. 4, pp. 89–107, Jan 2002. 5. G. Kramer, B. Mukherjee, S. Dixit, Y. Ye, and R. Hirth, “Supporting differentiated classes of service in Ethernet passive optical networks”, Journal of Optical Networking 1(8,9), pp. 280–298, 2002. 6. ”Carrier sense multiple access with collision detection (CSMA/CD) access method and physical layer specifications”,ANSI/IEEE Std. 802.3, Part3, 2002 7. “Virtual Bridged Local Area Networks”, IEEE 802.1q, 1998. 8. E. Ringoot, N. Janssens, M. Tassent, J. Angeloupoulos, C. Blondia, and P. Vetter, “Demostration of Dynamic Medium Access Control for APON and superPON”, in Proc. of Globecom, San Antonio, Texas, USA, 2001. 9. B. Van Houdt, C. Blondia, O. Casals, and J. Garc´ıa”, “Performance Evaluation of a MAC protocol for broadband wireless ATM networks with QoS provisioning”, Journal of Interconnection Networks (JOIN) 2(1), pp. 103–130, 2001.