Apr 6, 2001 - domain that is removed from the active site (Sicheri et ... are free to interact with external ligands. .... Relative to the Free Kinase Domain. 1999 ...
Cell, Vol. 105, 115–126, April 6, 2001, Copyright 2001 by Cell Press
Dynamic Coupling between the SH2 and SH3 Domains of c-Src and Hck Underlies Their Inactivation by C-Terminal Tyrosine Phosphorylation Matthew A. Young,* Stefania Gonfloni,*† Giulio Superti-Furga,‡ Benoit Roux,§ and John Kuriyan*†k * Laboratories of Molecular Biophysics † Howard Hughes Medical Institute The Rockefeller University 1230 York Avenue New York, New York 10021 ‡ European Molecular Biology Laboratory Meyerhofstrasse 1 69117 Heidelberg Germany § Department of Biochemistry Weill Medical College of Cornell University New York, New York 10021
Summary The effect of C-terminal tyrosine phosphorylation on molecular motions in the Src kinases Hck and c-Src is investigated by molecular dynamics simulations. The SH2 and SH3 domains of the inactive kinases are seen to be tightly coupled by the connector between them, impeding activation. Dephosphorylation of the tail reduces the coupling between the SH2 and SH3 domains in the simulations, as does replacement of connector residues with glycine. A mutational analysis of c-Src expressed in Schizosaccharomyces pombe demonstrates that replacement of residues in the SH2-SH3 connector with glycine activates c-Src. The SH2-SH3 connector appears to be an inducible “snap lock” that clamps the SH2 and SH3 domains upon tail phosphorylation, but which allows flexibility when the tail is released. Introduction The Src family of tyrosine kinases are highly conserved signaling proteins in which a catalytic tyrosine kinase domain is preceded by two peptide binding modules, the Src homology domains SH2 and SH3 (reviewed in Sicheri and Kuriyan, 1997; Thomas and Brugge, 1997). Phosphorylation of a C-terminal tyrosine residue (Tyr527 in the chicken c-Src numbering system, used throughout the text) by C-terminal Src kinase, Csk (Nada et al., 1991), results in an intramolecular interaction between the SH2 domain and the phosphorylated C-terminal tail and attenuation of tyrosine kinase activity (MacAuley and Cooper, 1989; Matsuda et al., 1990). Dephosphorylation of Tyr527, or the binding of external ligands to the SH2 or the SH3 domain, results in the activation of the Src kinases (Liu et al., 1993; Alexandropoulos and Baltimore, 1996; Briggs et al., 1997; Moarefi et al., 1997). The active form is maintained by autophosphorylation of Tyr416, located in a central “activation loop” of the k To whom correspondence should be addressed (e-mail: kuriyan@ rockefeller.edu).
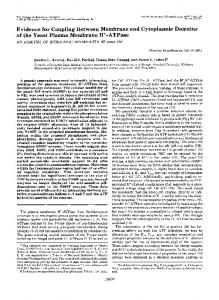
catalytic domain. Tyr416 and Tyr527, therefore, have opposing effects on catalytic activity when phosphorylated. Crystallographic analyses of the inactive form of the Src kinases c-Src and Hck have revealed the structures of an “assembled” state of these proteins, as illustrated in Figure 1 (bottom). The SH2 domain interacts with phosphorylated Tyr527 on the face of the catalytic domain that is removed from the active site (Sicheri et al., 1997; Williams et al., 1997; Xu et al., 1997). The linker connecting the SH2 domain to the catalytic domain forms a type II polyproline helix to which the SH3 domain is bound, in an intramolecular interaction that resembles closely the standard binding mode of SH3 domains. This assembled state is in contrast to the active form, in which the SH2 and SH3 domains are displaced and are free to interact with external ligands. Key structural features of the active and inactive states of Src are depicted schematically in Figure 1 (top). The SH2 and SH3 domains do not directly block the active site of the catalytic domain. Instead, the loss of catalytic activity is correlated with conformational changes at the active site of the catalytic domain. When compared to the structure of the active form of the Src kinase Lck (Yamaguchi and Hendrickson, 1996), an ␣ helix, ␣C, that borders the active site is rotated outward in the inactive form, resulting in the movement out of the active site of a critical glutamate side chain (Glu310). The activation loop is restructured in the inactive state so that the substrate binding site is blocked (Schindler et al., 1999; Xu et al., 1999). The changes in the structure of the activation loop also result in the displacement of Asp404 so that it can no longer properly coordinate a critical magnesium ion. In the active form, Tyr416 is phosphorylated and adopts a relatively extended conformation. This is coupled structurally to the inward rotation of helix ␣C and the proper positioning of residues that coordinate the magnesium ion (Yamaguchi and Hendrickson, 1996; Sicheri et al., 1997; Xu et al., 1997). The interaction between the SH2 domain and Tyr527 is critical for maintenance of the inactive state of the kinase. Mutation of Tyr527 to phenylalanine results in a constitutively active and transforming form of c-Src (Hunter, 1987; Reynolds et al., 1987). Likewise, one crucial distinction between the constitutively active product of the v-Src oncogene and the normal cellular form, c-Src, is the replacement of the C-terminal tail in c-Src with an unrelated sequence in v-Src that does not contain a tyrosine (Takeya and Hanafusa, 1983). Enzymological analysis of Hck demonstrates that the interaction between phosphorylated Tyr527 and the SH2 domain impedes the ability of the protein to phosphorylate Tyr416 in the activation loop; the lag time for autophosphorylation is significantly reduced by dephosphorylation of Tyr527 (Moarefi et al., 1997). Conversely, phosphorylation of Tyr416 results in a weakening of the interaction between the SH2 domain and Tyr527 (Porter et al., 2000). Clearly, the Src kinases are so constructed that there is communication between the two critical sites of tyrosine phosphorylation. The site of engagement between the SH2 domain and
Cell 116
Figure 1. Structural Features of Src Family Kinases (Top) Schematic diagram illustrating inactive and assembled (left) and active (right) Src kinases. (bottom) The crystal structure of the inactive and assembled form of Hck. The connector between the SH3-SH2 connector is shown on the left.
phosphorylated Tyr527 is located ⵑ40 A˚ from the catalytic center of the protein, on the face of the catalytic domain that is distal to the active site. There are several potential mechanisms for coupling the internal engagement of the SH2 domain to structural changes at the catalytic center. For example, the interaction between the SH2 domain and the phosphorylated tail might orient the polyproline helix in the SH2 kinase linker for optimal interaction with the SH3 domain. In turn, interactions between the SH3 domain and the SH2 catalytic domain linker are coupled to rotations of helix ␣C (Gonfloni et al., 1997, 2000; LaFevre-Bernt et al., 1998). Also, the SH2 and SH3 domains may reduce conformational flexibility in the catalytic domain, thereby impeding the activating transition. However, the structures by themselves do not show how changes in conformation at one site influence other regions. In this paper, we describe the application of molecular dynamics simulations to study nanosecond (ns) timescale motions in c-Src and Hck (for reviews of molecular dynamics, see Karplus and Petsko, 1990; Brooks, 1995). The simulations show that the SH2 and SH3 domains are coupled dynamically when the SH2 domain is bound to phosphorylated Tyr527. The simulations also indicate that this coupling is mediated by the short connector between the SH2 and SH3 domains, a segment that has not previously been thought to be particularly important in the regulatory mechanism. This has direct implications for the regulatory mechanism, because simulations in which the activation loop is driven between its inactive and active conformations show that movements
in the catalytic domain that are required to accommodate this transition result in displacements of the SH3 domain that are communicated to the SH2 domain via the SH3-SH2 connector. Ideally, we would verify the importance of the SH3SH2 connector by analyzing the properties of purified wild-type and mutant Src kinases. Unfortunately, such an approach is challenging because the preparation of homogeneously and appropriately phosphorylated protein is difficult when activating mutations are introduced into Src kinases. Expression of activated Src kinases results overwhelmingly in phosphorylation on Tyr416 rather than on Tyr527, as well as a reduction in yield. Instead, we use an experimental system in which Src kinases are expressed heterologously in the fission yeast Schizosaccharomyces pombe (Superti-Furga et al., 1993). This system provides a sensitive assay for the proper regulation of c-Src because the expression of active Src kinases results in inhibited growth of S. pombe cells, which do not contain endogenous Csk. Normal growth of S. pombe can be established in the presence of c-Src by coexpression of Csk, which results in the phosphorylation of Tyr527 of c-Src (Superti-Furga et al., 1993). This assay is powerful because it allows for ready analysis of the effects of mutations in c-Src without purification of mutant proteins, and we use it to show that replacement of residues in the SH3-SH2 connector in c-Src by glycine results in the production of protein that is no longer regulated by phosphorylation on Tyr527. This is consistent with the results of molecular dynamics simulations of mutant proteins, which show
Molecular Dynamics of Src Kinase 117
that the structure of the connector melts when glycines are introduced into it. Results and Discussion We describe computer simulations of atomic motions in c-Src and Hck on a nanosecond time scale. The system simulated is a fully solvated model of the protein, surrounded by ⵑ10,500 water molecules and ⵑ80 ions in a box subject to periodic boundary conditions. The length of the simulations is limited by the computer time required: on a six-processor R10000 Silicon Graphics Origin computer, for example, a 5 ns simulation requires 50 days of dedicated computer time. We describe the results of molecular dynamics simulations of Hck and c-Src initiated from crystal structures of the inactive and assembled state (Schindler et al., 1999; Xu et al., 1999), in which Tyr527 is phosphorylated and Tyr416 is not. We then compare these results to those obtained for simulations of Hck that start from the same initial structure, except that Tyr527 is unphosphorylated and the connection between the C-terminal tail in the SH2 domain is broken. The time scales over which the dynamics of dephosphorylated Hck are simulated (ⵑ5 ns) are too short for conformational changes to occur at the active site. We have, therefore, generated “targeted” molecular dynamics trajectories, in which the conformation of the activation loop is driven toward the active form artificially, starting from the inactive form. Finally, a simulation of c-Src is described in which glycine residues are introduced into the SH3-SH2 connector in order to make it more flexible. The simulations suggest that the introduction of flexibility into the SH3-SH2 connector would lead to the activation of Src kinases. The final part of this paper presents the results of expressing wild-type and mutant forms of c-Src in S. pombe, with and without coexpression of Csk. This mutational analysis shows that the introduction of glycines in the SH3-SH2 connector leads to the constitutive activation of c-Src. On a Nanosecond Time Scale, the Structure of an Isolated SH2 Domain Is Stable, and Activating Transitions Are Not Seen in Isolated Kinase Domains To test the stability of the simulation parameters and methodology, we carried out a 3.0 ns simulation of the isolated SH2 domain of Lck, bound to a phosphotyrosinecontaining peptide. The crystal structure of the peptide complex of the Lck SH2 domain, determined at 1.0 A˚ resolution (Tong et al., 1996), was used as the starting conformation. There is very little drift in the structure of the complex during the simulation, and the RMS deviation in C␣ atoms between the average structure obtained from the simulation and the crystal structure is ⵑ0.5 A˚. The simulation reproduces the structure of the phosphotyrosine binding site to satisfactory extent. Considering all atoms within 5.5 A˚ from the phosphorus atom of the bound peptide, the RMS deviation between the simulation average and the crystal structure is 0.33 A˚. These results indicate that the simulation protocol and force field used here provide an adequate description of structural parameters.
We have also generated simulations of the isolated kinase domains of Hck and c-Src, initiated from the structures of the inactive states of these proteins, in which the activation loops are unphosphorylated and in the conformation observed in the inactive and assembled state (Schindler et al., 1999; Xu et al., 1999). The activation loops remain close to the starting conformation throughout the simulations, showing no tendency to flip out. Thus, although the kinase domain is capable of converting to the active form spontaneously in the absence of inhibitory interactions with the SH2 and SH3 domain, the nanosecond time scale of these simulations is clearly too short to see such a transition. The Assembled Form of Hck Is Conformationally Stable, with Reduced Displacements in the N-Terminal Lobe of the Kinase Domain Relative to the Free Kinase Domain The inactive and assembled form of Hck was simulated for 4 ns, and its structure remains close to that of the crystal structure from which the simulation was initiated (Figure 2 [top]). The initial structure was that of Hck bound to a small molecule inhibitor (a pyrazolo-pyrimidine derivative, PP1), and in order to model the system that was crystallized (Schindler et al., 1999) as closely as possible, the inhibitor was also included in the simulations. The RMS deviation in C␣ positions between the crystal structure and the time-averaged structure from the simulation is 1.2 A˚, calculated by superimposing all the C␣ atoms of the protein. This value includes the effects of small changes in the relative orientations of the domains, and the RMS deviation in C␣ positions for the SH2 and SH3 domains and the N- and C-terminal lobes of the kinase domain are 0.83, 0.61, 0.50, and 0.71 A˚, respectively, when superimposed individually onto the initial structure. Displacements in the orientation of the N-terminal lobe of the kinase domain with respect to the C-terminal lobe of the kinase are likely to be important for activation (Williams et al., 1997, and see below). We compared fluctuations in the N-terminal lobe in the simulation of the assembled and inactive state of Hck to those observed in simulations of the isolated kinase domains, which are potentially active. A time series of the RMS deviation in C␣ atom positions in the N-terminal lobe with respect to the X-ray structure, after superimposing C␣ atoms in the C-terminal lobe, is shown in Figure 2 (bottom). For the assembled state of Hck, the N-terminal lobe of the kinase oscillates around an RMS deviation of ⵑ1.5 A˚ from the initial structure. The effect of the SH2 and SH3 domains on the fluctuations in the N-terminal lobe is evident in the larger deviations seen for the isolated kinase domain in the presence of PP1 (ⵑ2 A˚). Even larger excursions in structure are seen when PP1 is removed from the kinase domain (Figure 2 [bottom]). The Motions of the SH2 and SH3 Domains Are Tightly Coupled in the Inactive and Assembled Forms of Hck and c-Src Visual inspection of animations of the trajectories of inactive Hck and c-Src revealed that the SH2 and SH3 domains move in a highly coupled manner. The en-bloc movements of the SH2 and SH3 domains were quantified by calculating cross-correlation coefficients for fluc-
Cell 118
Figure 2. Dynamic Motions Observed in Molecular Dynamics Simulations of Hck (Top) C␣ atom traces of ten instantaneous structures from the 4 ns simulation of inactive and assembled Hck bound to PP1. Individual structures have been superimposed on the C␣ atoms of the entire protein. (Bottom) Fluctuations in the simulation of three states of the enzyme: (i) The inactive and assembled structure (including SH2 and SH3) bound to PP1 (blue), (ii) the isolated kinase domain in the absence of the SH3 and SH2 domains bound to PP1 (green), and (iii) the isolated kinase domain in the absence of PP1 (red). RMS deviations from the crystal structure of the inactive form of Hck, calculated after superimposing the individual structures on the C-terminal lobe, are shown for the C␣ atoms in the N-terminal lobe of the kinase domain.
tuations in the positions of C␣ atoms during the simulation (Figure 3). Atoms that systematically move in the same direction have a cross-correlation coefficient of 1, and atoms that are uncorrelated in their motions have a correlation coefficient of 0. The cross-correlation coefficients were computed after each structure in the trajectory was superimposed on the C-terminal lobe of the kinase domain of the initial structure. The matrix of the cross-correlation coefficients for the C␣ atoms of Hck is shown in Figure 3. As expected, the SH2 and SH3 domains are highly correlated to the C-terminal tail and the SH2 kinase linker, respectively. In addition, the presence of strong correlations between the SH2 and SH3 domains is particularly striking. These correlations are very clearly channeled through the SH2SH3 connector, which acts as a nexus of correlations; the SH3 domain is strongly correlated to the connector,
which in turn is correlated to the SH2 domain (Figures 3b and 3c). That the SH2 and SH3 domains are highly correlated in their dynamics is unexpected because these domains are usually thought of as peptide binding modules that act independently. Indeed, NMR and hydrogen exchange studies of isolated SH3-SH2 constructs of Src kinases have shown that the domains are flexible with respect to each other when they are removed from the rest of the protein (Engen et al., 1999; Arold et al., 2000). The Motions of the SH2 and SH3 Domains Become Uncorrelated when the Tail Is Dephosphorylated We have generated two simulations of Hck that are initiated from the inactive and assembled state, but with the C-terminal tail dephosphorylated. These simulations
Molecular Dynamics of Src Kinase 119
Figure 3. Dynamic Correlations between the SH2 and SH3 Domains (a) A dynamic cross-correlation matrix for motions of all the C␣ atoms over the course of the simulation of the inactive form of Hck. The correlations were calculated after superimposing each individual structure in the trajectory onto the C-terminal lobe of the kinase domain of the first structure. This procedure removes the correlations to the C-terminal lobe. The scale of the correlations is indicated on the spectrum on the right, with positive correlations plotted in the right lower half of the matrix and negative correlations plotted in the upper left half of the matrix. The correlation coefficient, Cij, between two atoms i and j, is defined as
Cij ⫽
* * 具⌬ r i · ⌬ r j典 1 1, 具⌬ri2典2具⌬rj2典2
* where ⌬ r i is the instantaneous fluctuation of the position of the ith atom with respect to its mean position. The boxed region is magnified in (b). (b) Magnified view of the correlation matrices for the simulations of the inactive, assembled state of Hck (top), the assembled state with Tyr527 in the C-terminal tail dephosphorylated and PP1 present (middle), and the assembled state with Tyr527 dephosphorylated and the nucleotide binding site empty (bottom). The region that is magnified shows the interdomain correlation coefficients between the C␣ atoms of residue pairs that are in the SH3, SH2, and SH3-SH2 connector region (labeled “C”). Arrowheads mark regions in the SH3 and SH2 domains that are strongly correlated to the two other domains in the simulation of the inactive, assembled structure (top). Note that these interdomain correlations decrease in the simulations with Tyr527 dephosphorylated (middle and bottom). In particular, note that for the indicated regions, the connector is strongly correlated (indicated by red) to both the SH2 and the SH3 domains simultaneously, but that the simultaneous correlation of the connector to both domains is weaked when Tyr527 is dephosphorylated. (c) The most highly correlated residues in each of the three simulations described in (b) are indicated by red lines. Red lines are drawn connecting C␣ atoms for pairs of residues with calculated correlation coefficients greater than 0.75. Correlations between pairs of residues in the same domain have been omitted for clarity. The N-lobe, C-lobe, activation loop, and catalytic loop were each considered as separate domains, and thus their correlations were not omitted.
differ in that one contains PP1 bound at the nucleotide binding site, whereas the other does not (the binding site is unoccupied, except for water). In both cases, fluctuations in atomic positions within the SH3 and SH2 domains become less correlated (Figure 3). Over the short time scale of the dynamics, we do not see either domain becoming detached from the body of the kinase domain. However, increased motion in the SH2 domain leads to a concomitant increase in displacements in the SH3 domain, such that the interactions between the SH3 domain and the N-terminal lobe of the kinase become less well defined. This is illustrated in Figure 4, which
shows instantaneous snapshots of structures from the simulations. In each case, every instantaneous structure is superimposed on to the initial X-ray structure using the N-terminal lobe of the kinase. When the phosphorylated tail is connected to the SH2 domain (the inactive state), the SH3 domain is seen to fluctuate very little in position relative to the N-terminal lobe of the kinase (Figure 4a). When the tail is released from the SH2 domain, the fluctuations of the SH3 domain with respect to the N-terminal lobe of the kinase are seen to increase substantially (Figures 4b and 4c). The mean RMS deviation in C␣ positions within the SH3 domain, after super-
Cell 120
Figure 4. Displacements of the SH3 Domain Relative to N-Terminal Lobe of Kinase Each panels shows five instantaneous structures, superimposed on the N-terminal lobe of the kinase domain, for the protein with Tyr527 phosphorylated and PP1 bound at the nucleotide binding site (top), for Tyr527 dephosphorylated and displaced from the SH2 domain (middle), and the same, with PP1 was removed (bottom).
imposing on the N-terminal lobe, for the inactive state is 3.4 A˚, and rises to 5.3 A˚ when the tail is released. We simulated the dynamics of the SH3 and SH2 domains of Hck (including the SH3-SH2 connector) in the absence of the rest of the protein, for 5 ns. The  turn in the connector is broken within 2 ns, and the domains rotate very significantly with respect to each other. We also simulated the dynamics of the SH3-SH2 connector in isolation, and the conformation of the connector is distorted very significantly within 1 ns. These simulations show that when the SH2 and SH3 domains can rotate freely, the hydrogen bonded structure of the connector is disrupted by water molecules. Presumably,
engagement of the SH2 and SH3 by their internal docking sites restricts such rotational flexibility and keeps the hydrogen bonds in the connector locked in place. The role of the SH2-SH3 connector in serving to rigidify the two domains when they are bound to both of their internal docking sites is reminiscent of the behavior of linkers between zinc fingers in certain transcription factors such as TFIIIA (Laity et al., 2000). The zinc modules of these transcription factors are flexible in the absence of cognate DNA. However, when the appropriate DNA site is bound, the linker regions adopt relatively rigid structures, in which a linker residue provides a hydrogen bonded cap for an ␣ helix in the preceding
Molecular Dynamics of Src Kinase 121
zinc finger. The imposition of conformational constraints serves to increase the specificity of the interaction with DNA, and these linkers have been referred to as “inducible snap locks” (Laity et al., 2000). Simulations in which the Activation Loop Is Driven Forcibly from the Inactive to the Active Conformation Demonstrate Coupling between the Active Site and the SH2 Domain Simulations in which the tail is not phosphorylated mimic an initial step in the activation of the Src kinases. However, at no point during the simulations described above does the activation loop move significantly away from the inactive conformation. In order to examine how the assembled state might oppose the activation of the Src kinases, we generated targeted molecular dynamics simulations in which an artificial driving force converts the conformation of the activation loop into that seen in active Src kinases during the course of a short simulation. The conformation of the activation loop in the active form (Yamaguchi and Hendrickson, 1996) was used as a target in a targeted dynamics calculation on Hck. The energy function was augmented by an artificial energy term that depended on the RMS deviation between the current conformation of the activation loop and that in the target structure. The conformation of the activation loop was restrained to be at a specified distance from the target structure, and this distance was decreased progressively until the activation loop was essentially in the target conformation. The energy restraint did not impose precise conformations on the loop during the transition, but only set the global RMS deviation of the loop from the target structure. The initial RMS deviation from the target structure for all nonhydrogen atoms in the activation loop was ⵑ5 A˚. The restrained distance from the target was initially set at 5 A˚, and then decremented in steps of 0.05 A˚ until it became 0. The total simulation length was typically 0.1 ns. These relatively short simulations are meant to show, qualitatively, how the rest of the protein might respond when the activation loop is pushed toward the active conformation. The transition of the activation loop to the active conformation in targeted simulations results in a displacement of the N-terminal lobe of the kinase (Figure 5a). Not surprisingly, the displacement of the N-terminal lobe is tracked by the SH3 domain. What is particularly interesting, however, is that in every case, the displacement of the N-terminal lobe and the SH3 domain is communicated through the connector to the SH2 domain, which moves in a concerted fashion (Figure 5c). These calculations make clear that conformational changes in the activation loop are likely to be coupled to displacements of the SH2 domain. These displacements would be impeded by the engagement of the SH2 domain by a phosphorylated C-terminal tail. The Replacement of Residues in the SH3-SH2 Connector by Glycine Results in a Loss of Correlation between the SH3 and SH2 Domains even when the Tail Is Phosphorylated The SH2-SH3 connector appears to be well suited to play a role as an “inducible snap lock”. The structure
of the connector in the assembled state of c-Src and Hck is not determined by hydrophobic packing interactions, but rather appears to be stabilized by the formation of hydrogen bonds (Figure 1, bottom). The connector contains eight residues that adopt a  turn followed by a single turn of 310 helix, linked by hydrogen bonds. That the conformation of the connector observed in the assembled states of Hck and c-Src has some intrinsic stability is suggested by structures of isolated SH3SH2 constructs of the Src kinases Lck and Fyn. In Lck, the relative orientation of the SH3 and SH2 domains is rotated by ⵑ180⬚ with respect to the structures of inactive c-Src and Hck (Eck et al., 1994). Nevertheless, much of the structure of the SH3-SH2 connector is preserved in the Lck structure, and the dramatic change in relative orientation of the SH3 and SH2 domains occurs due to a rotation about a single torsion angle that results in the breakage of the  turn structure. A structure of the isolated SH2-SH3 domain of Fyn has been also determined (Arold et al., 2000) and the observed conformation is essentially the same as that seen in assembled Hck and Src. The maintenance of a relatively rigid structure is crucial for the ability of the connector to couple dynamical fluctuations between the SH2 and SH3 domains. We reasoned that the introduction of glycine residues into the connector would destroy its rigidity since the lack of a C atom makes glycine the least conformationally restricted of all amino acid residues. This was tested by replacing three residues in the c-Src connector (Ser142, Ala145, and Glu146) with glycine and generating a 4 ns simulation of the assembled state of c-Src, with phosphorylated Tyr527 bound to the SH2 domain. Each of these residues has different interactions within the connector region. Ser142 is conserved in all Src kinases, and its hydroxyl group forms a hydrogen bond with Gln144 (c-Src) or Glu144 (Hck). Glu146 participates in water-mediated interactions with Trp148 in both Src and Hck. Ala145 does not participate in any obvious interactions, and its replacement by glycine is expected to have an effect only on the flexibility of the connector. The presence of glycines in the SH2-SH3 connector has a dramatic effect on the dynamics of the protein (Figure 6). The SH2 and SH3 domains become significantly less correlated in their motions even though the phosphorylated tail is connected to the SH2 domain (Figure 6a). The structure of the mutant form of the connector undergoes a large conformational change during the simulation, whereby it loses the  hairpin and 310 structure, and melts into a flexible segment of ill-defined conformation (Figure 6b). The introduction of flexibility into the SH2-SH3 connector in the simulation therefore mimics the effects of tail dephosphorylation in the simulations. Mutation of Residues in the SH3-SH2 Connector Leads to Constitutive Activation of c-Src in the S. pombe Assay for Regulation The utility and reliability of the S. pombe assay for c-Src regulation is now well established (Gonfloni et al., 1997, 2000). Expression of c-Src without Csk results in growth inhibition approximately 20 hr after the induction of c-Src expression, followed by cell death shortly thereafter.
Cell 122
Figure 5. Response of the SH2 Domain in a Targeted Molecular Dynamics Trajectory that Moves the Activation Loop from the Inactive to the Active Conformation The RMS deviation of the restrained atoms (the activation loop, residues 404 to 421) from the structure of the target is shown in black (dashed line). The plot fails to reach zero due to the fact that, in this analysis, the structures were superimposed on the C-lobe of the kinase domain rather than just the restraint set. RMS deviations of the atoms in the N-terminal lobe of the kinase relative to the conformation of the crystal structure of the inactive form are shown in red. Displacement of the C␣ atom of Arg175, a critical residue in the SH2 domain that coordinates the phosphotyrosine, is shown in blue. Individual structures at the beginning, middle, and end of the simulation are also shown.
The extent of growth inhibition is proportional to the catalytic activity of Src (Gonfloni et al., 1997). The expression of Csk alone has no phenotype because it is highly specific for the C-terminal tail of Src kinases. Expression of Csk along with c-Src restores normal growth (Superti-Furga et al., 1993). The recognition of c-Src by Csk depends only on the C-terminal lobe of the kinase domain (Gonfloni et al., 1997; Wang, 2001),
and thus mutations that we introduce into the connector region will not affect Csk-dependent phosphorylation of the C-terminal tail. Ser142, Ala145, and Glu146 of c-Src were each mutated individually as well as simultaneously and the mutant forms were studied in the S. pombe regulation assay. Expression of wild-type c-Src without Csk leads to growth arrest (Figure 7a). Growth is recovered by Figure 6. Effect of the Triple Glycine Mutation in Simulations of c-Src (a) Simulation of wild-type c-Src. (b) Simulation of a c-Src variant in which Ser142, Ala145, and Glu146 are replaced by glycine. In each case, a plot indicating the most highly correlated residues (see Figure 3c) is shown on the left, and the final structure, after 4 ns of dynamics, is shown on the right. Note the altered structure of the SH3-SH2 connector in the simulation of the mutant.
Molecular Dynamics of Src Kinase 123
Figure 7. S. pombe Based Growth Assay of the Ability of Csk to Properly Downregulate Wild-Type and SH3-SH2 Connector Mutant Forms of c-SRC (a) Growth curves of S. pombe cells expressing wild-type and mutant forms of c-Src from the inducible nmt1 promoter of the pRSP vector (as indicated) and pAU (empty vector) or pAU-Csk. The y axis is logarithmic. Under the conditions used, expression of Src takes around 20 hr post-induction to reach maximal accumulation. (b) Immunoblots of lysates prepared from S. pombe 22 hr post-induction show the levels of Src and Csk proteins accumulated.
coexpressing Csk, indicating normal repression of catalytic activity by C-terminal phosphorylation of wild-type c-Src (Figure 7, Superti-Furga et al., 1993). In the individual mutations, Ser142 was replaced by glycine, Ala145 by glycine, and Glu146 by arginine (which is expected to disrupt the water-mediated interactions with Trp148). In each case, the coexpression of Csk with these mutant forms of c-Src leads to only a partial recovery from the growth arrested state (Figure 7), indicating that each individual mutation damages the communication be-
tween the C-terminal tail and the catalytic center of the enzyme. The effect of the Ala145 to Gly mutation in partially activating c-Src is notable since it involves the removal of a single methyl group that is not involved in any packing interactions. The most dramatic phenotype is obtained when all three residues in c-Src are replaced by glycine. In this case, coexpression of Csk completely fails to restore normal growth (Figure 7). This demonstrates that tail phosphorylation is de-coupled from active site regula-
Cell 124
tion in this mutant form of Src, a very clear indication that a rigid linkage between the SH3 and SH2 domains is crucial for the proper control of Src kinase activity. This is to be contrasted to the junction region between the SH2 domain and the SH2 kinase linker. This is a region of high local flexibility in the simulations, and a previous mutational analysis of this region failed to alter Src regulation significantly (Gonfloni et al., 1997). Activating mutations in c-Src that are localized to the SH3-SH2 connector have not been reported previously. Interestingly, in c-Abl (a relative of the Src Kinases), mutation of the residue corresponding to Ser142 (one of the three residues in the connector that are replaced in our study) is strongly transforming (Brasher, 2001). Conclusions Taken together, the results of the molecular dynamics simulations and the mutational analysis show that the SH2 and SH3 domains of the Src kinases have a hitherto unsuspected property that is important for the regulatory mechanism. When they engage their internal targets simultaneously, the connector between the SH2 and SH3 couples the two domains together by forming an “inducible snap lock,” a term previously used to describe similar behavior in the connector segments of certain zinc finger proteins (Laity et al., 2000). A crucial aspect of the coupling between the SH2 and SH3 domains is that it is sensitive to phosphorylation of the tail. Disconnecting the SH2 domain from the tail loosens up the connection between the domains. Presumably, this leads to displacement of the SH2 and SH3 domains, a step that is crucial for the ability of the SH2 and SH3 domains to serve their targeting function. Flexibility in the SH2-SH3 linkage would allow these domains to bind their targets independently, which might facilitate more rapid docking onto their targets, as well as the recognition of targets with diverse architectures. Experimental Procedures Computer Simulations The atomic coordinates for the crystal structures of Hck complexed with a nucleoside analog PP1 (Protein Data Bank ID 3HCK) (Schindler et al., 1999), and for Src complexed with the ATP analog AMPPNP (Protein Data Bank ID 2SRC) (Xu et al., 1999), were used as the starting structures in a series of molecular dynamics calculations using the AMBER (Assisted Model Building with Energy Restraints) suite of programs, version 5.0 (Case et al., 1997), with the parm98 force field (Cornell et al., 1995). The AMP-PNP inhibitor in the Src crystal structure was replaced with PP1 (docked into the ATP binding site using the Sybyl molecular modeling package) to be consistent with the simulations of Hck. The very N-terminal “unique” regions of c-Src and Hck, upstream of the SH3 domains, were not included in the crystal structures and are omitted from the simulations. The crystal structures for each of the proteins were prepared for dynamics using the Leap module of AMBER. This involved first adding protons to the structure, aligning the principle axes of the protein with the Cartesian axes of the box, and neutralizing the net charge of the protein by adding Na⫹ ions. All ionizable side chains were configured in their characteristic ionized states at pH 7.0. All crystallographically determined water positions were retained during the simulation setup. The simulation unit cell was configured as a rectilinear box, which extended 5.5 A˚ beyond the protein in each dimension, resulting in a box size of 60 ⫻ 85 ⫻ 75 A˚. The protein, crystallographic waters, and ions in the simulation box were then surrounded with water molecules by overlaying a periodic box
of waters on top of the crystallographic coordinates and removing any overlapping water molecules. The periodic box of waters (TIP3P water model, Jorgensen, 1981) had been pre-equilibrated at 298 K via Monte Carlo simulation. Finally, 36 Na⫹/Cl⫺ ion pairs were added at random positions (replacing water molecules in the event of an overlap), such that the molar salt concentration was ⵑ150 mM. The solvated Hck and c-Src systems contained ⵑ40,000 atoms, comprised of roughly 8000 protein atoms, the small molecule kinase inhibitor PP1, ⵑ7 neutralizing Na⫹ ions, ⵑ36 Na⫹/Cl⫺ ion pairs, and roughly 10,300 water molecules. Simulations involving the isolated kinase domain of Src or Hck (amino acids 260 through 519) were set up using the same protocol, resulting in a box size of roughly 65 ⫻ 72 ⫻ 57 A˚, composed of just under 25,000 atoms, ⵑ4,100 protein atoms, the PP1 inhibitor, 2 neutralizing Na⫹ ions, ⵑ20 Na⫹/ Cl⫺ ion pairs, and roughly 6800 water molecules. Parameters were generated for the ⫺2 charge state (Bradshaw and Waksman, 1998) of the phosphotyrosine amino acid using the standard AMBER force field protocol (Cornell et al., 1995). Optimized geometries and torsional rotation energies were calculated using quantum mechanics at the RHF theory level, driving the C-C-O-P torsion from 0 through 90⬚, at 30⬚ increments using the Guassian-98 package (Gaussian Inc.). Atomic charges for the amino acid were obtained using the RESP program (Cieplak et al., 1995) to fit potentials calculated at the MP2 6–31G* level. This was done to fit the potential calculated for two values of the C-C-O-P torsion angle simultaneously. One was the minimum energy angle from the in vacuo torsional calculations, and the other torsion angle was that observed in the high resolution crystal structure of the Lck SH2 domain. Lastly, a new torsional term was added to reproduce the RHF torsional rotational energy. The parameter set used is available as supplementary material on the Cell website at http://www.cell. com/cgi/content/full/105/1/115/DC1. The conformation of the solvated protein system was relaxed via a series of energy minimizations before initiating the dynamics, using the SANDER module of AMBER. Periodic imaging of the central cell was included to model an infinite solvated protein environment and eliminate solvent/vacuum boundaries, and the particle mesh Ewald summation technique was employed to calculate electrostatic interactions for atoms at distances greater than 9.0 A˚, effectively eliminating the truncation of long-range electrostatic interactions (Darden et al., 1995). Following minimization, the system was gradually heated to 298 K by slowly increasing atomic velocities over a period of 10 ps. Harmonic positional restraints were imposed on the protein atoms for the first 50 ps of the simulation to allow the solvent to equilibrate around the protein. The force constants of the positional restraints were gradually reduced in magnitude over this 50 ps time segment. The remainder of the dynamics was carried out in the absence of any restraints, under constant temperature and constant pressure conditions, and using a 2 fs time step, with the SHAKE algorithm (Ryckaert et al., 1977) applied to maintain rigid bond lengths for bonds containing hydrogen atoms. Production dynamics generated roughly 100 ps per day using six processors in parallel on a 195 MHz R10000 SGI computer. The targeted molecular dynamics simulations were carried out using academic version (c27b1) of the program CHARMM (Chemistry at Harvard Molecular Mechanics) (Brooks et al., 1983), modified to incorporate an energy restraint based on the RMS distance with respect to a reference target conformation. This technique is similar to that used in previous targeted MD studies (Guilbert et al., 1995), but with the addition of the offset term, d0. To be consistent with the results from the other simulations described in this paper, a CHARMM formatted version of the AMBER parm98 force field (conversion carried out by T. E. Cheatham, III, NIH, Bethesda, Maryland, 1999) was used throughout. The functional form of the RMS energy restraint is ERMS ⫽ 1/2 K[DRMS (X(t), Xtarget) ⫺ d0]2 where K is a force constant (in kcal/mol/A˚2), DRMS is the relative RMS distance for a selected set of atoms between the instantaneous conformation X(t) and the reference Xtarget, and d0 is an offset constant (in A˚). The calculation of DRMS involves finding the optimal orientation of the reference structure at every time step of the forced trajectory; the forces (analytic first derivative) are calculated accordingly. One essential aspect of the restraint ERMS is that it leaves the atoms in the selected restraint set free to rearrange spontaneously during the course of the targeted dynamics without experiencing
Molecular Dynamics of Src Kinase 125
any spurious forces, so long as the overall RMS deviation relative to the target conformation remains constant. During the course of the forced trajectory, the conformational transition is driven by monotonically reducing the value of the RMSD offset parameter d0 as a function of the simulation time until it reaches zero. The target for the restrained molecular dynamics was a model for the active state of the Hck kinase domain, based upon the crystal structure of Lck (pdb id 3LCK). The conformational transition of the activation segment was driven by applying RMSD restraints to heavy atoms in residues 404–519, with a total force constant of 500 kcal mol⫺1 A˚⫺2 (sum over all atoms). The restrained trajectories were initiated from an arbitrary time point chosen from the equilibrium dynamics ensemble of an unrestrained trajectory of the protein. The offset parameter (d0) was initiated at the calculated RMS deviation between the simulation structure and the target, ⵑ5 A˚. d0 was decremented by 0.05 A˚ every 1 ps of the simulation until the offset value reached zero deviation. At this point, the force constant of the restraint was slowly lowered while continuing to carry out dynamics, eventually continuing the dynamics without any restraints. S. pombe Assay for Src Regulation Chicken c-Src alleles were tested in the S. pombe strain SP200 (h⫺s leu32 ura4 ade6–210) as described (Gonfloni et al., 1997). Src constructs used in the S. pombe assay were cloned in the pRSP thiamine-repressive expression vector (Superti-Furga et al., 1993; Gonfloni et al., 1997). Point mutations were generated by PCR using the Quickchange site-directed mutagenesis system (Stratagene), according to the manufacturer’s instructions. Mutants were verified by sequencing of the relevant parts. At least three independently generated mutants for each allele were tested. Cells were kept in medium containing 4 M thiamine to repress the nmt1 promoter. Withdrawal of thiamine from the medium induced expression of c-Src. Yeast cultures were grown in a gyratory shaker at 30⬚C and cell counts were done by measuring optical density. Native protein extracts from S. pombe cells were obtained by lysing cells using the buffer-glass beads method, as described previously (SupertiFurga et al., 1993). Proteins were run out on SDS gels and tested for the presence of c-Src and Csk using immunoblotting. In all immunoblots, 15 g of total protein extracts were probed with monoclonal anti-CSK antibody (Transduction Laboratories). The membranes were then stripped in 62.5 mM Tris pH 6.7/0.5% SDS/100 mM -mercaptoethanol, extensively washed in TBS, reblocked in TBS/5% milk, and probed with rabbit antiserum anti-SRC (SRC-2, Santa Cruz Biotechnology); The ECL chemiluminescent method (Amersham) was used for detection. Acknowledgments
genic analysis of the regulatory function of the c-Able Src homology 3 domain. Oncogene, in press. Briggs, S.D., Sharkey, M., Stevenson, M., and Smithgall, T.E. (1997). SH3-mediated Hck tyrosine kinase activation and fibroblast transformation by the Nef protein of HIV-1. J. Biol. Chem. 272, 17899– 17902. Brooks, B.R., Bruccoleri, R.E., Olafson, B.D., States, D.J., Swaminathan, S., and Karplus, M. (1983). CHARMM: a program for macromolecular energy, minimization, and dynamics calculations. J. Comput. Chem. 4, 187–195. Brooks, C.L., 3rd. (1995). Methodological advances in molecular dynamics simulations of biological systems. Curr. Opin. Struct. Biol. 5, 211–215. Case, D.A., Pearlman, D.A., Caldwell, J.W., Cheatham, T.E., III, Ross, W.S., Simmerling, C., Darden, T., Merz, K.M., Stanton, R.V., Cheng, A., et al. (1997). AMBER 5.0 (San Francisco, CA, UCSF). Cieplak, P., Cornell, W.D., Bayly, C., and Kollman, P.A. (1995). Application of the multimolecule and multiconformational RESP methodology to biopolymers: charge derivation for DNA, RNA and proteins. J. Comput. Chem. 16, 1357–1377. Cornell, W.D., Cieplak, P., Bayly, C.I., Gould, I.R., Merz, K.M., Jr., Ferguson, D.M., Spellmeyer, D.C., Fox, T., Caldwell, J.W., and Kollman, P.A. (1995). A second generation force field for the simulation of proteins, nucleic acids, and organic molecules. J. Am. Chem. Soc. 117, 5179–5197. Darden, T., York, D., and Pedersen, L. (1995). Particle mesh ewald. J. Chem. Phys. 98, 10089–10092. Eck, M.J., Atwell, S.K., Shoelson, S.E., and Harrison, S.C. (1994). Structure of the regulatory domains of the Src-family tyrosine kinase Lck. Nature 368, 764–769. Engen, J.R., Smithgall, T.E., Gmeiner, W.H., and Smith, D.L. (1999). Comparison of SH3 and SH2 domain dynamics when expressed alone or in an SH(3⫹2) construct: the role of protein dynamics in functional regulation. J. Mol. Biol. 287, 645–656. Gonfloni, S., Williams, J.C., Hattula, K., Weijland, A., Wierenga, R.K., and Superti-Furga, G. (1997). The role of the linker between the SH2 domain and catalytic domain in the regulation and function of Src. EMBO J. 16, 7261–7271. Gonfloni, S., Weijland, A., Kretzschmar, J., and Superti-Furga, G. (2000). Crosstalk between the catalytic and regulatory domains allows bidirectional regulation of Src. Nat. Struct. Biol. 7, 281–286. Guilbert, C., Perahia, D., and Mouawad, L.A. (1995). A method to explore transition paths in macromolecules. Applications to hemoglobin and phosphoglycerate kinase. Comp. Phys. Comm. 91, 263–273. Hunter, T. (1987). A tail of two src’s: mutatis mutandis. Cell 49, 1–4.
We thank S. Hanafusa, S. Harrison, M. Karplus, S. Taylor, D. Beveridge, T. Schindler and members of the Kuriyan Lab for valuable discussions and L. Leighton for assistance in the preparation of figures. M. A. Y. is supported by Fellowship DRG-1553 of the Cancer Research Fund of the Damon Runyon-Walter Winchell Foundation. We acknowledge the National Center for Supercomputing Applications for supercomputer time used in these calculations. Received December 19, 2000; revised February 28, 2001. References Alexandropoulos, K., and Baltimore, D. (1996). Coordinate activation of c-Src by SH3- and SH2-binding sites on a novel p130Cas-related protein, Sin. Genes Dev. 10, 1341–1355. Arold, S.T., Ulmer, T.S., Mulhern, T.D., Werner, J.M., Ladbury, J.E., Campbell, I.D., and Noble, M.E.M. (2001). The role of the SH3–SH2 interface in the regulation of Src kinases. J. Biol. Chem., in press. Bradshaw, J.M., and Waksman, G. (1998). Calorimetric investigation of proton linkage by monitoring both the enthalpy and association constant of binding: application to the interaction of the Src SH2 domain with a high-affinity tyrosyl phosphopeptide. Biochemistry 37, 15400–15407. Brasher, B.B., Roumiontsou, S., and Van Etten, R.A. (2001). Muta-
Jorgensen, W.L. (1981). Transferable intermolecular potential functions for water, alcohols and ethers. Application to liquid water. J. Am. Chem. Soc. 103, 335–340. Karplus, M., and Petsko, G.A. (1990). Molecular dynamics simulations in biology. Nature 347, 631–639. LaFevre-Bernt, M., Sicheri, F., Pico, A., Porter, M., Kuriyan, J., and Miller, W.T. (1998). Intramolecular regulatory interactions in the Src family kinase Hck probed by mutagenesis of a conserved tryptophan residue. J. Biol. Chem. 273, 32129–32134. Laity, J.H., Dyson, H.J., and Wright, P.E. (2000). DNA-induced alphahelix capping in conserved linker sequences is a determinant of binding affinity in Cys(2)-His(2) zinc fingers. J. Mol. Biol. 295, 719–727. Liu, X., Brodeur, S.R., Gish, G., Songyang, Z., Cantley, L.C., Laudano, A.P., and Pawson, T. (1993). Regulation of c-Src tyrosine kinase activity by the Src SH2 domain. Oncogene 8, 1119–1126. MacAuley, A., and Cooper, J.A. (1989). Structural differences between repressed and derepressed forms of p60c-src. Mol. Cell. Biol. 9, 2648–2656. Matsuda, M., Mayer, B.J., Fukui, Y., and Hanafusa, H. (1990). Binding of transforming protein, P47gag-crk, to a broad range of phosphotyrosine-containing proteins. Science 248, 1537–1539. Moarefi, I., LaFevre-Bernt, M., Sicheri, F., Huse, M., Lee, C.H., Kuri-
Cell 126
yan, J., and Miller, W.T. (1997). Activation of the Src-family tyrosine kinase Hck by SH3 domain displacement. Nature 385, 650–653. Nada, S., Okada, M., MacAuley, A., Cooper, J.A., and Nakagawa, H. (1991). Cloning of a complementary DNA for a protein-tyrosine kinase that specifically phosphorylates a negative regulatory site of p60c-src. Nature 351, 69–72. Porter, M., Schindler, T., Kuriyan, J., and Miller, W.T. (2000). Reciprocal regulation of Hck activity by phosphorylation of Tyr(527) and Tyr(416). Effect of introducing a high affinity intramolecular SH2 ligand. J. Biol. Chem. 275, 2721–2726. Reynolds, A.B., Vila, J., Lansing, T.J., Potts, W.M., Weber, M.J., and Parsons, J.T. (1987). Activation of the oncogenic potential of the avian cellular src protein by specific structural alteration of the carboxy terminus. EMBO J. 6, 2359–2364. Ryckaert, J.P., Ciccotti, G., and Berendsen, H.J.C. (1977). Numerical integration of the Cartesian equations of motion of a system with constraints: molecular dynamics of n-alkanes. J. Comput. Phys. 23, 327–336. Schindler, T., Sicheri, F., Pico, A., Gazit, A., Levitzki, A., and Kuriyan, J. (1999). Crystal structure of Hck in complex with a Src familyselective tyrosine kinase inhibitor. Mol. Cell 3, 639–648. Sicheri, F., and Kuriyan, J. (1997). Structures of Src-family tyrosine kinases. Curr. Opin. Struct. Biol. 7, 777–785. Sicheri, F., Moarefi, I., and Kuriyan, J. (1997). Crystal structure of the Src family tyrosine kinase Hck. Nature 385, 602–609. Superti-Furga, G., Fumagalli, S., Koegl, M., Courtneidge, S.A., and Draetta, G. (1993). Csk inhibition of c-Src activity requires both the SH2 and SH3 domains of Src. EMBO J. 12, 2625–2634. Takeya, T., and Hanafusa, H. (1983). Structure and sequence of the cellular gene homologous to the RSV src gene and the mechanism for generating the transforming virus. Cell 32, 881–890. Thomas, S.M., and Brugge, J.S. (1997). Cellular functions regulated by Src family kinases. Annu. Rev. Cell Dev. Biol. 13, 513–609. Tong, L., Warren, T.C., King, J., Betageri, R., Rose, J., and Jakes, S. (1996). Crystal structures of the human p56lck SH2 domain in complex with two short phosphotyrosyl peptides at 1.0 A and 1.8 A resolution. J. Mol. Biol. 256, 601–610. Wang, D., Huang, X.-Y., and Cole, P.A. (2001). Molecular Determinants for Csk-Catalyzed Tyrosine Phosphorylation of the Src Tail. Biochemistry 40, 2004–2010. Williams, J.C., Weijland, A., Gonfloni, S., Thompson, A., Courtneidge, S.A., Superti-Furga, G., and Wierenga, R.K. (1997). The 2.35 A crystal structure of the inactivated form of chicken Src: a dynamic molecule with multiple regulatory interactions. J. Mol. Biol. 274, 757–775. Xu, W., Harrison, S.C., and Eck, M.J. (1997). Three-dimensional structure of the tyrosine kinase c-Src. Nature 385, 595–602. Xu, W., Doshi, A., Lei, M., Eck, M.J., and Harrison, S.C. (1999). Crystal structures of c-Src reveal features of its autoinhibitory mechanism. Mol. Cell 3, 629–638. Yamaguchi, H., and Hendrickson, W.A. (1996). Structural basis for activation of human lymphocyte kinase Lck upon tyrosine phosphorylation. Nature 384, 484–489.