WEFTEC®.06
DYNAMIC MATHEMATICAL MODELING OF MEMBRANE FOULING IN SUBMERGED MEMBRANE BIOREACTORS By Eugenio Giraldo and Mark LeChevallier American Water, Innovation and Environmental Stewardship Voorhees, NJ, 08043
[email protected] ABSTRACT A mathematical model is developed that accounts for internal fouling of membranes due to soluble microbial products during subcritical flux operation, and for supercritical flux fouling due to cake formation and compression.. The model takes into account the filtration effect generated by the cake. A set of differential equations is derived and solved numerically to obtain a description of cake formation and growth, removal of substrate due to cake-membrane behavior, change in membrane permeability over time, increase in cake headloss over time, removal of soluble microbial products by the cake, and change of transmembrane pressure over time. The model allows operational changes of membrane operation such as modifications of permeate fluxes e.g. membrane relaxation, modification of aeration rates, backflushing and changes in water quality variables during one run. The model adequately describes several commonly observed effects such as: exponential increase in transmembrane pressure due to high mixed liquor suspended solids, reduced fouling rates at increased aeration intensities, subcritical operation fouling, and effect of increased particle size on the filterability of the microbial suspension. KEYWORDS Model, membrane, fouling, cake, bioreactor, soluble microbial products, colloids, submerged, compression INTRODUCTION Membrane bioreactors (MBRs) for wastewater treatment are becoming increasingly popular across the world due to the high quality of their treated effluent, relative simplicity, and increased reliability. The cost of membranes has been steadily reducing over the last decade and the operation of the systems has simplified. At the same time, the operational expenditures have reduced as the energy requirements for operation and the membrane cleaning and replacement costs continue to decrease. The most widely applied commercial technologies are all based on the concept of submerged membranes. The membranes are usually located in a separate membrane tank placed after the biological tank in the same location as the final clarifier in an activated sludge tank. Continuous recirculation of the mixed liquor takes place between the biological tank and the membrane tank. Suction is applied to the inside of the membrane to create a transmembrane pressure that drives the treated water from the outside of the membrane to the inside and then out of the system. The permeate is the treated water, consistently of very high quality. The biological flocs, colloidal particles, and some soluble compounds are retained on the outside of the membrane. The flow of water towards the membranes convectively transports all of these substances to the membrane
Copyright ©2006 Water Environment Foundation. All Rights Reserved
4895
WEFTEC®.06
surface. The membranes are continuously aerated to induce turbulence and movement which controls deposition of substances on the membrane surface.These substances can foul the surface, thus compromising the operation of the whole plant. Understanding membrane fouling in MBRs is, therefore, critical for the successful application of the technology. There have been numerous advances in the understanding of membrane fouling in MBRs. The interrelation between the operational conditions of the biological process and the fouling potential of the mixed liquor is now better understood. The role of soluble microbial products, SMPs, colloidal particles and biological flocs has also been better elucidated. Finally, the effects of aeration intensity and the rate of fouling has been recently clearly described. There are some mathematical models of membrane fouling that can account for internal fouling of the membranes (Weisner and Apel, 1996) but their application is usually limited to laboratory conditions with constant flux or differential pressure. On the other hand, there is a significant body of knowledge on the description of cake filtration in several different disciplines. In environmental engineering, cake filtration theory is usually applied for understanding dewatering operations and consolidation of soils (Lee and Chang, 2000). To the knowledge of the authors, there is not any existing model of submerged membrane fouling that dynamically couples internal and external-cake membrane fouling, including cake filtration effects and compressibility. The objective of this contribution is to present such model, to test the applicability of the model with published data, and to establish future directions for model development. MODEL DESCRIPTION The mathematical model described in this contribution considers the following phenomena: 1. Forward transport of two (2) different types of particles: a biological floc particle of a size significantly bigger than the pore size of the membrane, and a smaller particle of a size significantly smaller than the pore size of the membrane. The former is subject to concentration polarization phenomena and could form a cake on the surface of the membrane depending on the operational conditions. The latter does not accumulate at the membrane surface and is not subject to concentration polarization phenomena. This implies that the particles size of the substance(s) is smaller than the pore size of the membrane However, it could be adsorbed on the surface of the membrane and on the pores causing pore blockage and pore size reduction. This fouling requires backflushing and/or chemical cleaning to restore the original permeability of the membrane. 2. Subcritical-flux membrane fouling. The model considers fouling due to pore blockage and pore size reduction by particles smaller than the nominal pore size of the membrane. 3. Supercritical flux cake formation. The model considers cake formation when backward transport of retained particles from the membrane surface to the bulk liquid is slower than forward transport of particles from the bulk liquid to the membrane surface. backward transport is induced primarily by air scouring of the membrane. 4. Cake compression. The model considers the cake as a compressible layer of particles. The specific resistance of the cake is a function of the size of the particles forming the cake. As the cake grows and the headlosses of the fluid through the cake increase, the friction of the fluid against the cake matrix compresses the structure. The resistance to flow through the cake increases due to compression.
Copyright ©2006 Water Environment Foundation. All Rights Reserved
4896
WEFTEC®.06
5. Cake filtration. The model considers the cake as a precoat, or a secondary dynamic membrane that acts as a filter to retain the smaller sized pore-plugging particles, thus minimizing the long-term irreversible fouling of the membrane. 6. Dynamic Conditions. The model accepts changes of operational characteristics of the membrane filtration cycle such as: changes in filtration flux and changes in air scouring intensity. Subcritical Flux Fouling. Membrane filtration of a solution containing different particle sizes can still undergo fouling due to small particles that are not subject to concentration polarization phenomena. It has been shown by numerous researchers that soluble microbial products, SMPs, are the primary source of internal fouling of membranes due to pore blockage and pore size reduction. The relationship between membrane permeability, pore size, and membrane resistance is usually expressed as (Wiesner and Aptel, 1996)1:
Rmembrane =
8θδ m 2 frpore
(1)
Where:
θ = pore tortuosity δ m = membrane effective thickness
f = membrane porosity ( fraction of pore area )
rpore = effective pore radius
Depending on the mechanism selected for internal fouling, the model considers membrane porosity and/or the membrane effective pore radius as a time varying parameter. Two differential equations are introduced to account for the effect of adsorption of small-sized particles within the pore of the membrane, or on the surface partially blocking the pore area of the membrane.
df = − α f ⋅ C m' ⋅ J dt drpore dt
= − α p ⋅ C m' ⋅ J
(2)
(3)
Where:
α f = membrane porosity reduction coeficient α p = membrane pore reduction coeficient C m' = concentration of fouling particles at membrane surface e.g. SMPs
J = permeate flux
Copyright ©2006 Water Environment Foundation. All Rights Reserved
4897
WEFTEC®.06
During subcritical flux fouling, the concentration of small fouling particles at the surface of the membrane is the same as the concentration of fouling particles in the bulk liquid. However, during supercritical flux filtration the cake acts as a precoat and the concentration of fouling particles at the surface of the membrane is reduced due to the filtration effect of the cake. Cake Formation A mass balance for the cake forming particles around the membrane surface produces the following differential equation:
ρc
dz c β = J ⋅ C b − α v ⋅ v air dt
(4)
α v = air scouring coefficient z c = depth of cake layer C b = Concentration of cake for min g particles in the bulk liquid v air = scouring air surface velocity β = air scouring dependance exp onent
ρ c = density of cake layer The first term of equation (4) represents the forward transport of floc particles from the bulk liquid to the surface of the membrane. The second term represents the backward transport of cake particles due to the air scouring effect, from the cake to the bulk liquid. It is clear from this equation that the formation of the cake layer depends on the concentration of mixed liquor suspended solids, MLSS, in the membrane tank, the flux to the membrane, and the scouring energy induced by the aeration. A more concentrated solution would require a more intense scouring energy to control the growth of the cake, while a dilute solution would require less energy. Subcritical flux conditions would be obtained when the backward rate of transport is higher than the forward rate of transport. During subcritical conditions, fouling would be due to adsorption of soluble substances on the pores of the membrane. During supercritical flux conditions, both internal membrane resistance, and external cake resistance would increase over time. Cake resistance could be controlled by relaxation of the membrane, J= 0, during operation which creates backward transport without forward convective flux. Cake Resistance Cake resistance is calculated according to2 : Rc = Rˆ c ⋅ z c
(5)
Where:
Copyright ©2006 Water Environment Foundation. All Rights Reserved
4898
WEFTEC®.06
Rˆ c = specific cake resistance
The specific cake resistance in turn can be calculated using Kozeny-Karman equation3: 180(1 − ε c ) Rˆ c = d p2 ε c3
2
(6)
Where:
ε c = cake porosity d p = effective mean diameter of floc particle forming the cake
In order to take into account the effect of the compressibility of the cake on the specific resistance the following equation was used4: Rˆ ccomp = Rˆ c ΔPcn
(7)
Where Rˆ ccomp = Compressible cake specific resistance
ΔPc = Pressure drop across the cake layer n = Cake compressibility coefficient When the coefficient n is equals to zero, the cake is not compressible. Previous laboratory studies on the compressibility of activated sludge indicated that the value of the coefficient n varies between 0.79 and 1.45. Cake Filtration The effect of the cake on the retention of smaller particles that can clog the membrane is incorporated in the model. The removal of particles in the cake is considered a first order transport process with respect to the removed particle concentration in the cake media. A mass balance on an element within the cake produces: dC '
dC ' =− J ⋅ − kC ' dz dt
(8)
It is considered that the filtration through the cake is a fast reaction with respect to the rest of the phenomena. In that case a steady state can be assumed, obtaining
J⋅
dC ' = kC ' dz
(9)
Copyright ©2006 Water Environment Foundation. All Rights Reserved
4899
WEFTEC®.06
Integrating equation (9) across the depth of the cake layer produces: C m' = C b' ⋅ e
−
k ⋅ zc J
(10)
Where: C m' = Concentration of clogging particles on the membrane surface C b' = Concentration of the clogging particles in the bulk liquid k = First order particle removal coefficient NUMERICAL SOLUTION Equations (2) to (4) were converted into finite difference equations and solved simultaneously using the Euler technique. The equations were programmed in Visual Basic for Excel. The change in time of membrane porosity and/or membrane pore radius, and the thickness of the cake layer are used to obtain the membrane resistance due to internal fouling, and the cake resistance, respectively. The filtration effect due to the presence of the cake layer was dynamically calculated at each time step using Equation (10). The results from the membrane and cake resistance where combined into the following equation to obtain the change of transmembrane and cake pressure differential as a function of time (Wiesner and Aptel, 1996): J=
Δp
μ ( Rm + Rbiofilm + Rcake + ...)
(11)
The model accepts changes in the following variables over time:
• •
Membrane flux, J Membrane scouring aeration velocity, vair
The rest of the parameters characteristic of the membrane and MLSS, e.g. floc size and concentration, are considered constant over time during the duration of one model run. These parameters are defined at the beginning of each run. A copy of the model is available from the authors upon request. MODEL CALIBRATION The model was calibrated using an extensive set of data obtained by Germain et al., 20056. The authors used a pilot scale submerged MBR (ZenoGem, Zenon, Canada). The plant consisted of two interconnected tanks, an anoxic tank of 9.5 m3 and an aerobic tank of 12.7 m3. The plant received primary effluent from Manor Farm Sewage Treatment Works (Thames Water, Reading, UK). The membranes used were ZW230 with a membrane area per cassette of 21 m2, and a nominal membrane pore diameter of 0.04 μ m. Coarse bubble air diffusers were integrated at the
Copyright ©2006 Water Environment Foundation. All Rights Reserved
4900
WEFTEC®.06
bottom of each cassette to provide air for membrane movement and scouring. An air cycling operation was applied between the two modules with an alternating aeration frequency of 10 seconds to each module. The hydraulic retention time in the MBR was maintained at 48 hours through all of the experimental period. A more detailed description of the system can be obtained in Germain et al. (2005). The authors also conducted an extensive characterization of the MLSS including: particle size distribution, viscosity, extracellular polymeric substances (EPSs), soluble microbial products (SMPs), and capillary suction time (CST). A series of experiments to determine the membrane fouling rate were conducted using the flux step method (Germain et al., 2005). A step of 15 minutes of duration was applied and the increase in transmembrane pressure (TMP) over time was recorded. The flux was increased in steps of 5.5 lmh between 5.5 and 33 lmh. The slope of the TMP over time in each step was reported as the membrane fouling rate. In between each step the membrane was backflushed for one minute to eliminate reversible fouling that could occur. The membrane fouling rate was determined for seven (7) different MLSS concentrations in combination with three (3) membrane aeration velocities (0.07, 0.10 and 0.13 m/s) and six (6) permeate fluxes, for a total of 126 tests. The mathematical model was used to obtain membrane fouling rates (mbar/min) during simulated step flux tests. The biological flocs were considered as the cake forming particles and the carbohydrate SMPs as the internal membrane fouling, pore-reducing particles. Only one of the internal fouling mechanisms was used to calibrate the internal fouling rate in order to avoid over-parameterization of the model. The concentrations of MLSS, SMPs, fluxes and aeration rates were set to the conditions in each of the tests. The floc particle sizes selected for the model were obtained from the measurements reported for each condition. Internal fouling was calibrated by using only one of the fouling mechanisms. The constant α f was used to fit the results of the model at low MLSS concentrations and high aeration rates when no cake was assumed to have formed on the surface. The initial cake porosity, ε c , was used to calibrate the cake specific cake resistance by matching the fouling rates at high flux and low aeration rates. The increment in pressure at high fluxes and fouling rates was used to calibrate the cake compressibility coefficient, n. A first attempt to calibrate the model using an incompressible cake failed. The effect of the air flow rate on the fouling rate was expressed with the β coefficient. The three curves of the effects of aeration on the fouling rates were used to calibrate β once the other coefficients were determined. The cake filtration constant was selected based on the observed reduction of the fouling rate with increased MLSS concentration at the three higher flux test series. RESULTS The original results from Germain et al. indicated that the permeate flux has the highest effect on the fouling rate of the membrane. At low fluxes, the fouling rate decreased to very low levels independently of the other two variables, aeration intensity and MLSS concentration. The more significant differences in fouling rates were observed at the higher permeate fluxes. The results
Copyright ©2006 Water Environment Foundation. All Rights Reserved
4901
WEFTEC®.06
from the modeled and the observed fouling rates for the three aeration rates and the 33 LMH permeate flux are presented in Figures 1 to 3 below: Figure 1
Fouling Rate (mbar/min)
Calibration Results Flux = 33 LMH, Aeration = 0.07 m/s 6 5 4 3 2 1 0
Measured Modeled
0
5
10
15
MLSS concentration (g/L)
Figure 2
Fouling Rate (mbar/min)
Calibration Results Flux = 33 LMH, Aeration = 0.1 m/s 3 Measured
2
Modeled
1 0 0
5
10
15
MLSS Concentration (g/L)
Figure 3
Fouling rate (mbar/min)
Calibration Results Flux = 33 LMH, Aeration = 0.13 m/s 3 Measured
2
Modeled
1 0 0
5
10
15
MLSS concentration (g/L)
Copyright ©2006 Water Environment Foundation. All Rights Reserved
4902
WEFTEC®.06
As can be observed, the model represents accurately the reported fouling rates at the lower aeration intensities. It is important to note that as the concentration of MLSS increases, the actual fouling rate decreases temporarily; a further increase in the MLSS concentration induces further exponential increases in the fouling rate thus forming a concave-shaped curve. This effect is due to the filtration of pore-clogging particles by the cake layer on the surface of the membrane. A thin layer is beneficial because it generates a reduction of internal membrane fouling and is not dominant in the overall resistance of the membrane. A further increase in cake depth induces a high cake resistance that controls and limits the flux without further improving the clogging particle removal. This effect will be further explored in the next sections of this paper. At the highest aeration intensity, 0.13 m/s, the relative rates of fouling are all low and fall within the margin of error of the measurements. The model predicts higher fouling rates than observed at the lower MLSS concentrations. It was reported that, during the duration of the different tests, the concentration of SMPs in the bioreactor varied significantly (Germain et al.). At low MLSS and high aeration intensity, there is no cake formation and a variation of the SMPs directly affects the fouling rates. As mentioned before, the hypothesis of the compressibility of the cake structure was tested during the course of the calibration procedure. The compressibility of the cake structure was set to zero in a first attempt, in order to keep the model simple and to minimize the number of parameters required to reflect the observed data. The results obtained are presented on Figure 4 below: Figure 4
Fouling Rate (mbar/min)
Calibration Results Flux = 33 LMH, Aeration = 0.07 m/s 6 5 4
Measured No-Compression
3 2 1 0
Compression
0
5
10
15
MLSS concentration (g/L)
The model with no cake compression predicts a much lower fouling rate that the actual observed rate during the tests. It is clear that it is necessary to include the compression effect of the cake in order to account for the high fouling rates observed at the increased MLSS concentrations. This exponential increase in the fouling rates at high MLSS concentrations has been previously observed by a number of researchers7 8 9. The compression of the cake structures affects the porosity of the cake that, in turn, increases the cake specific resistance coefficient according to Copyright ©2006 Water Environment Foundation. All Rights Reserved
4903
WEFTEC®.06
Kozeny’s equation. The effect is autocatalytic because the increased headloss in turn generates further cake compression, that increases the resistance and so forth. The overall increase at a given MLSS and permeate flux is a function of the aeration intensity as presented in Figure 5 below. A higher aeration rate induces increased fiber agitation and scouring shear stresses on the surface of the membrane that, in turn, increase cake erosion and subsequent backward transport of cake particles to the bulk liquid. Figure 5 Model Results, Effect of Aeration on Fouling Flux = 33 LMH
Fouling Rate (mbar/min)
6 0.07 m/s
4
0.13 m/s
2
0.1 m/s
0 0
5
10
15
MLSS concentration (g/L)
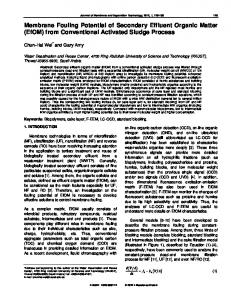
A less pronounced increase in fouling rates is observed when the scouring intensity and the MLSS solids are fixed and the permeate flux rate is increased. Figure 6 below illustrates the observed and modeled results for one of the conditions where the MLSS was set to 13.5 g/L and the aeration intensity to 0.13 m/s. The model accurately predicts the observed results. Because the field tests were conducted with step intervals of 15 minutes, the compression effect of the cake does not become significant until the last permeate flux increase from 27.5 to 33 lmh. Figure 6
Calibration Results MLSS=13.5 g/L, Aeration = 0.13 m/s
Fouling rate (mbar/min)
1.5 1
Measured Modeled
0.5 0 0
10
20
30
40
Permeate Flux (lmh)
Copyright ©2006 Water Environment Foundation. All Rights Reserved
4904
WEFTEC®.06
Dynamic Modeling
The model allows changing the operational conditions of the membrane compartment of the bioreactor as a function of time. In order to illustrate this feature, the model output graphs are presented for the step permeate flux test with relaxation and backflushing for the experiment presented in Figure 6 above. In this test series, the MLSS was set at 13 g/L, the aeration intensity to 0.13 m/s and the permeate flux increased in a step-wise manner during intervals of 15 minutes. In between each increase in flux, the membrane was backflushed to remove particles that caused fouling of the pores and relaxed for 15 minutes with continuous aeration and absence of permeate flux, in order to remove any cake deposited on the surface. Figure 7 below illustrates the change in time of permeate flux during this test. At time zero, the flux was set to 5 lmh for 15 minutes. At time 15 min, the membrane was backflushed and relaxed for an additional 15 minutes with no permeate flux and air scouring. At time 30 min, the flux was set to 12.5 lmh for an additional 15 minutes and the step-backflush-relaxation cycle was repeated. For the last flux increment, the model was allowed to run for a longer period of time to illustrate the effect of cake accumulation on transmembrane pressure. Figure 7
Step Flux Test with Relaxation and Backflushing MLSS=13,000, vair= 0.13 m/s
P e r m e a te F l u x (l m h )
35 30 25 20 15 10 5 0 0
15
30
45
60
75
90
105
120
135
150
Time of flux Change (min)
The change in transmembrane pressure over time due to the membrane and cake is presented in Figure 8.
Copyright ©2006 Water Environment Foundation. All Rights Reserved
4905
WEFTEC®.06
Figure 8
TMP (mbar)
Evolution of Transmembrane Pressure over Time
1000 800 600 400 200 0 0
50
100
150
200
250
Time (minutes) Ptot
Pcake
Pin
As can be seen, the cake headloss is not the predominant component of the total transmembrane pressure at low permeate fluxes; it becomes significant during the higher permeate fluxes. An interesting output from the model is the evolution of the cake mass over time. The results are presented in Figure 9. Figure 9
Ev olution of Cake M ass ov e r Time
Cake Mass (mg/cm2)
16 14 12 10 8 6 4 2 0 0
50
100 150 Time (min)
200
250
According to the model, no cake accumulation on the surface of the membrane is predicted during the first 90 minutes of operation, which corresponds to permeate fluxes below 22 lmh (with concentrations of MLSS of 13 g/L and 0.13 m/s of aeration velocity). At 22 lmh, a slight accumulation of cake is predicted, however, during the relaxation period at time 105 min, the Copyright ©2006 Water Environment Foundation. All Rights Reserved
4906
WEFTEC®.06
cake is removed from the surface of the membrane. An effective way to control the effects of excessive cake headlosses during high permeate flux operation is to provide relaxation periods for cake removal. The rate of cake accumulation increases with the increased flux as expected. Even though the cake accumulation rate is linear for a given operational condition, the effect of cake growth on the headlosses of the cake is exponential, as can be observed by comparing the previous two graphs. In this particular set of conditions, the aeration rate is set to a high intensity. As presented before, lower aeration rates induce an earlier and more pronounced effect of the cake on the overall TMP. An additional outcome of the model is the calculated evolution of the porous area on the surface of the membrane due to clogging of the pores with SMPs. The results are presented in Figure 10 below: Figure 10
Fraction Porous Area
Internal Fouling of Membrane over Time 0.655 0.65 0.645 0.64 0.635 0.63 0.625 0
50
100
150
200
250
Time (min)
The graph shows how the deposits of adsorbed particles on the surface of the membrane slowly reduce the total amount of membrane porous area. When backflushing occurs, the model was set to return the membrane to original conditions according to the results reported by Germain et al (2005). Other authors have reported some level of irreversible fouling. The model can be set to fit those conditions as well. Those periods when the membrane was relaxed and no fouling occurred are represented by a horizontal line on the graph. The slope of the curves during the initial periods of the test when no cake was deposited on the surface, or the first 90 minutes, increases consistently with an increase in the permeate flux. It is also observed that after the cake is in place, or after the initial 90 min, there is a reduction in slope over time. This effect is clearer in the last step increase where the slope consistently decreases reaching a point of no fouling at time 200 min, in spite of the fact that the permeate flux is the highest. The filtration effects of the cake layer are presented in Figure 11:
Copyright ©2006 Water Environment Foundation. All Rights Reserved
4907
WEFTEC®.06
Figure 11 Concentration of SMPs in the Permeate
SMPs (mg/L)
7 6 5 4 3 2 1 0 0
50
100
150
200
250
Time (min)
The effluent concentration of SMPs in the filtered effluent remains constant over time during the first 90 minutes of the step test. This is due to the fact that no cake layer is deposited on the surface of the membrane. Once the membrane surface forms a cake, it acts as a precoat layer retaining some of the pore clogging particles, SMPs, in this case. This is reflected in the graph as a reduction in the SMPs concentration in the permeate over time. During the relaxation periods, when there is no permeate, the model sets the concentration to the concentration of the last filtered effluent. According to the model, the concentration of SMPs reaches very low levels once the cake is allowed to grow. The removal of the SMPs causes a reduction in the internal fouling rate of the membrane as was observed before. Several groups have observed a significant difference between the concentration of SMPs in the MLSS and the permeate. Trussell et al. (2004)10 observed a difference of 30 to 50 mg/L in the COD concentration of an MBR permeate and the COD of the MLSS after filtering over a 0.45um membrane. Recently Rosenberg et al (2006)11 have shown that the removal of SMPs in an MBR during the pass through the membrane cannot be explained by the effect of a clean membrane with no cake. The authors conclude that the cake is instrumental in the removal of SMPs. Long-term Subcritical Fouling
The model can also represent the effects of long-term subcritical fouling experiments. During subcritical fouling,by definition, no floc-cake is present on the membrane and the membrane would see the full concentration of SMPs present in the soluble fraction of the MLSS. No headloss due to SMPs gel formation is considered in the calculations. . TMP increases exponentially with time as the porous area of the membrane is reduced for subcritical permeate flux operation, J= 12 lmh, MLSS= 11g/l and vair = 0.13 m/s. The shape of the curve corresponds to the pore plugging model used in this case. Alternatively, the model could use a pore reduction model which would produce a faster increase in the fouling rate over time. It is observed that the total TMP and the membrane TMP are the same indicating that there is no contribution to the overall TMP due to a cake. The graph that illustrates the change of
Copyright ©2006 Water Environment Foundation. All Rights Reserved
4908
WEFTEC®.06
porous area over time exhibits a linear behavior reflecting the steady conditions used during the simulation. Several researchers have recently observed this type of behavior on MBRs operating in subcritical permeate flux rates, as well as in laboratory tests with SMPs surrogate substances. Jefferson et al. (2004)12 summarize several experiences of their research group with subcritical membrane fouling and give guidance on how to improve operation. They conclude that the concept of critical flux operation does not strictly apply to multiparticle systems where some of the particles are not retained by the membrane. Figure 12
TMP (mbar)
Longterm Subcritical Fouling J= 12 lmh, MLSS=11 g/L, vair = 0.13 m/s 1200 1000 800 600 400 200 0 0
200
400
600
800
1000
Time (minutes) Ptot
Pcake
Pin
Figure 13
0.8
8
0.6
6
0.4
4
0.2
2
0
0 0
200
400
600
800
Permeate SMPs (mg/L)
Fraction Porous Area
Internal Membrane Fouling under Subcritical Conditions
1000
Time (min) f
Co
Effect of Colloidal Material on Filterability
Merlo et al (2004)13 reported that MBR bioreactors have a higher proportion of colloidal material (quantified as MLSS supernatant turbidity) than conventional activated sludge reactors operated Copyright ©2006 Water Environment Foundation. All Rights Reserved
4909
WEFTEC®.06
under similar conditions. The authors suggest that this is due to the retention of colloidal material inside the MBR by way of the membrane, while in the conventional activated sludge reactor a significant fraction of the colloidal particles are washed out with the effluent. Kim et al (2001)14 evaluated the effects of high shear rates during pumping in a cross flow membrane bioreactor; they concluded that small flocs and colloidal particles produce an increase in the rate of membrane fouling. Recently, Fan, Zhou and Husain (2006)15 reported that colloidal organic particles in the MLSS were a major determinant in predicting the critical flux in a hollow fiber submerged MBR using the step permeate flux test. The current model can account for the increased cake resistance associated with colloidal particles (less than one (1) micrometer) by affecting the effective mean particle size of the MLSS. The Kozeny-Karman equation contains a strong dependence of the cake specific resistance to the effective mean diameter of the particle. The effect of changing the mean effective particle size of the MLSS floc particle is illustrated in Figure 14 below. The graph represents the modeled results of a permeate flux step test. The same incremental sequence including relaxation and backflushing presented before was used during this run. The concentration of the MLSS was changed to 20,000 mg/L and the aeration intensity was decreased to 0.11 m/s to induce additional cake formation. Figure 14
150
30
100
20
50
10
0 0
50
100
150
200
TMP (mbar) 100 um
TMP (mbar) 50 um
Evolution of Cake TMP over Time
0 250
Time (minutes) 50 um
100 um
Notice that each curve is plotted on a different vertical scale. There is a fivefold increase in the cake headlosses when the particle size changes by a factor of two. According to the weak definition of the critical flux, critical flux is the highest flux rate in a step flux test before the TMP increase becomes non-linear. Therefore, the net effect of filtering a smaller sized MLSS is to lower the critical flux of the system. In the example above, the critical flux determined during a step flow test would have decreased by at least one incremental step depending on the sensitivity of the field equipment. A change in the particle size of the cake forming particle can also be used to explain the effects of polymer addition for critical flux optimization during dynamic operation of MBR. Addition of
Copyright ©2006 Water Environment Foundation. All Rights Reserved
4910
WEFTEC®.06
a coagulant would likely aggregate much of the colloidal particles, thus increasing the effective particle size of the cake-forming particles, and decreasing the specific resistance of the cake. For example, in the graph above, by increasing the effective particle size from 50 to 100 um the headlosses through the cake are reduced by a factor of five. This approach, however, does not allow modeling the variation in colloidal particles that might take place during dynamic influent flow conditions to the bioreactor. These conditions are likely to occur during storm events in plants treating municipal sewage. In this case, it would be more convenient to alter the specific surface area of the cake due to the retention of colloidal particles during filtration. The model does not incorporate, currently, a change in the backward transport rate of cake-forming particles due to differences in particle size; neither does the model incorporate additional headlosses due to a ripening effect during filtration associated with retention of colloidal particles in the cake. Both of these effects could be added in the future if the increased prediction ability warrants the added complexity. CONCLUSIONS The mathematical model presented in this paper accurately represents several observed behaviors of membrane fouling dynamics in submerged membrane bioreactors. In particular, the model describes accurately the following observations: • Dynamic fouling during operation due to increased permeate flux rates with constant aeration intensity and MLSS. The model describes the change in the predominant fouling mechanism when permeate flux changes from subcritical to supercritical flux. • Long-term fouling of membranes during subcritical flux operation. The effect of SMPs on long -term fouling of the membrane is accurately described. • The controlling effect of SMPs as fouling determinants during subcritical membrane operation. • Effect of changes in aeration intensity on the dynamics of membrane fouling with different MLSS and permeate flux rates. • Exponential increase in the fouling rate of the membrane due to increased MLSS concentrations during operation with constant permeate flux rates and aeration intensity. • Formation of cake on the membrane surface composed of biological flocs from the mixed liquor. • Filtration effect of the cake-membrane composite.and the observed decrease in the membrane fouling rate due to cake presence. • Reduction in the rate of fouling in the membrane due to an increase in the particle size of the flocs. ACKNOWLEDGEMENTS The authors would like to thank Eve Germain of Thames Water for sharing the information on the processes used to run the pilot plant and clarification of the results.
Copyright ©2006 Water Environment Foundation. All Rights Reserved
4911
WEFTEC®.06
REFERENCES
1 Wiesner, M.R. and P. Aptel (1996) “Mass Transport and Permeate Flux and Fouling in Pressure-Driven Processes” in Water Treatment. Membrane Process, AWWA-McGrawHill 2 Opus cit. 3 Opus cit. 4 Lee, D.J. and C.H. Chang (2000) Theories of Cake Filtration and Consolidation and Implications to Sludge Dewatering, Wat. Res., 34, 1, 1-20 5 Kim, J.S., Ahn W.Y. and Lee, C.H. (1998) Comparison of Ultrafiltration Characteristics between Attached and suspended Growth Microorganisms in Submerged Membrane Bioreactor. Water Research, 35, 10, 2435 6 Germain, E., T.Stephenson and P.Pearce (2005) Biomass Characteristics and Membrane Aeration: Towards a Better Understanding of Membrane Fouling in Submerged MBRs. Biotechnology and Bioengineering, 90, 316-322. 7 Trussell, R.S., R. Merlo, S. Adham, P.Gagliardo, R.R. Trussell, (2001) Understanding the Upper Limit for Suspended Solids in the Operation of Submerged Membrane Bioreactors (SMBR), presented at WEFTEC 2001. 8 Jefferson, B., A.Brookes, P.LeClech and S.J.Judd (2004) Methods for Understanding Organic Fouling in MBRs, Wat.Sci.Tech, 49,2,237-244 9 Andreottola, G. and G.Guglielmi (undated) Critical Flux Determination in Two MBRs for Municipal Wastewater Treatment. Available in the www. 10 Trussell, R.S., R. Merlo, S. Hermanowicz, D. Jenkins (2004) The Effect of Organic Loading on Membrane Fouling in a Submerged Bioreactor Treating Municipal Wastewater., Presented at WEFTEC 2004 11 Rosenberger S. C. Laabs, B.Lesjean, R. Gnirss, G.Amy, M Jenkel, J.-C. Schrotter (2006) Impact of Colloidal and Soluble Organic Material on Membrane Performance in Membrane Bioreactors for Municipal Wastewater Treatment, Water Research, 40, 710-720. 12 Jefferson, B., A. Brookes, P. LeClech, S.J. Judd (2004) Methods for Understanding Organic Fouling in MBRs, Wat.Sci.Tech, 49, 2, 237-244 13Merlo R.P., R.S. Trussell, S.W. Hermanowicz, D.Jenkins (2004) Physical, Chemical and Biological Properties of Submerged Membrane Bioreactor and Conventional Activated Sludge. WEFTEC 2004
Copyright ©2006 Water Environment Foundation. All Rights Reserved
4912
WEFTEC®.06
14 Kim, J., Ch. Lee, I.Chang (2001) Effect of Pump Shear on the Performance of a Crossflow Membrane Bioreactor, Water Reasearch, 35, 2137-2144 15 Fan, F., H.Zhou, H. Husain (2006) Identification of wastewater sludge characteristics to Predict Critical Flux for Membrane Bioreactor Processes. Water Research, 40, 205-212
Copyright ©2006 Water Environment Foundation. All Rights Reserved
4913