flawed by varying degrees of dynamic nonlinearity inherent to the conversion process, especially at ... in the sampling rate, although the design ofthe switching.
PAPERS
Dynamic Model-Based Linearization of Quantized Pulse-Width Modulation for Applications in Digitalto-Analog Conversion and Digital Power Amplifier Systems* M. O. J. HAWKSFORD, AES Fellow
Department
of Electronic
Systems Engineering,
University of Essex, Colchester,
Essex, C04 3SQ, UK
Quantized pulse-width modulation (PWM) offers an efficient means of converting digital data to analog either at low signal levels for DAC systems or at higher levels in power amplification. However, although a number of techniques exist, they are flawed by varying degrees of dynamic nonlinearity inherent to the conversion process, especially at lower sampling rates. The basic nonlinear mechanisms of PWM are described and a family of model-based solutions to the linearization problem is presented that retains the advantage of a uniform sampled digital format. As such it is possible to design PWM converters that exhibit vanishing levels of distortion even under broadband high-level signal excitation.
0 INTRODUCTION Pulse-width modulation (PWM) was invented by A. H. Reeves, who also invented pulse-code modulation (PCM) [1]-[3] and the capacitor microphone. The technique of PWM has had a long history of theoretical and practical development, where it has found wide application in power-efficient amplifiers and powersupply systems [4], [5]. Indeed, it is somewhat appropriate that both PCM and PWM originate from the same inventor, as this paper seeks to find an optimum solution to combining the two systems within the digital domain, Recently PWM has been identified as a means of achieving digital-to-analog conversion (DAC) and has been used in MASH conversion systems in association with noise shaping and oversampling. Such systems require the process ofgenerating PWM to be performed in the digital domain, where an early study was undertaken by Sandler [6], with evolutionary extensions subsequently reported in numerous related papers [7][ 10]. One approach is to mimic the analog methods of implementing PWM using a digital ramp function and * Manuscript received 1991 September 19; revised 1991 December14. d.AudioEng.Soc.,Vol.40,No.4,1992April
comparator. However, if the technique of natural sampling is implemented, then there is significant cornputational complexity in calculating the intersection of ramp and finely time-quantized, oversampled, and band-limited data as well as extremely high clock rates to time the pulse transitions. More recently it has been recognized that oversampling and noise shaping with multilevel quantization can be used to reduce the resolution required of the PWM signal, where an outline system was proposed [ 11, sec. 8.3] by the author in 1985. Later work by Sander and coworkers [ 12], [ 13] has developed this theme and supported the feasibility of more practical switching rates in association with acceptable signal-to-noise ratios. Theoretically the target performance of PWM is enhanced by an increase in the sampling rate, although the design ofthe switching output stage is then more problematic and efficiency degrades due to the extra signal transitions where both voltage and current occur simultaneously in the output transistors. Also edge slewing, jitter, and power-supply complianceandits associatedtransientresponsedegrade performance. For high efficiency the sampling rate should be low, but for low distortion and ease of signal reconstruction using low-pass filtering, the rate should be high. However, it will also be shown that an increase in samplingraterequires an increasein system accuracy, 235 i
HAWKSFORD
PAPERS
thus negating some of the reported advantage of noise shaping and excessive oversampling, The principal thrust in modern PWM systems is to convert uniformly time-sampled and amplitude-quantized audio data directly into an efficient PWM code that exhibits a low level of nonlinearity. Ideally, only modest oversampling should be used, which is sufficient to gain a signal recovery and possible noise-shaping advantage, but limited so as not to degrade efficiency. Also, it is advantageous if the bulk of signal processing occurs at the uniform sampling rate to avoid the need for excessive oversampling ratios to mimic the process of natural sampling, In this paper we address directly the principal distortion-generating mechanisms of PWM and demonstrate that by use of dynamic (or time-varying) filtering, model-based linearization can be achieved to a high degree of accuracy that generates a low residue, even in the presence of high-level and energetic signals, The process is first demonstrated using a symmetrical nonrecursive filter architecture with constrained re-
sitions so as to approximate those of a naturally sampled system. This is a fundamental proposition in the evolution of digital PWM that paves theway to a lowdistortion, all-digital power amplifier system. However, research now suggests that there exist more optimal strategies for linearizing uniformly sampled digital PWM, and in this paper an approach argued from the spectral domain is presented.
cursive coefficient adaptation forward and backward of the present output sample, which is suitable for finely resolved PWM. The technique is then applied to more coarsely quantized structures, which also enables a noise-shaping advantage to lower the resolution of the PWM samples, Two recent papers by Mellor et al. [14], [15] have demonstrated significant i'eductions in PWM distortion by modifying the uniform sampling process. As it is well documented that naturally sampled PWM offers enhanced linearity over uniform sampling, Mellor proposes using linear interpolation operation between adjacent input samples to estimate the PWM pulse tran-
oversampling format, although alternative oversampling ratios can also offer advantage in association with noise shaping. The uniformly sampled PWM process maps each data sample to an equivalent-area rectangular pulse of constant amplitude but variable width. We consider a symmetricalpulse distribution, as shown in Fig. 2. The width of the pulse 'r is then determined as
symmetrical
triangular
staircase
I NONLINEAR
MECHANISMS
IN PWM
The discussion in this paper is restricted to a particular class of PWM, where the input data are assumedto be uniformly sampled and the pulse width is calculated at each sampling instance. This technique simplifies signal processing compared with natural sampling, where in digital architectures there is a significant complication in calculating the intersection of a finely interpolated audio signal with that of a linear staircase function, as illustrated in Fig. 1. Initially we shall assume audio data in four times
x
_["_ _ _"l Ts A
(1)
where A is the pulse amplitude, x(n) the amplitude the nth input sample, and Ts the sampling period
waveform
interpolated
digital
I
of of
slgnal
1
Fig. 1. Natural sampling showing interpolated digital signal and problem of calculating intersections.
]
x(n+3)
-- -- -- _- .............
x(n* 2) oversampled,
-
__
umform data
'/
\
sam¢_s
/ /
0 1 ....
/
\
x(n' i)
/
/
./
\
I \
\
/ \
/
\
/
/
\
\
/
\
/
x(n+4)
\
/
/
\
\
x(n*5)
\ /
\
/
k
//
Il
\
\\
\ I
0
-[ (n+l)/f
s
(n+2)/f
--I-----s
(n+3)/f
s
(n*4)/r
s
(n*5)/f
s
Fig. 2. Oversampled symmetrical PWM using uniform sampling where pulse width is directly proportional to sample amplitude. 236
J. Audio Eng. Soc., Vol. 40, No. 4.,1992 April
PAPERS
LINEARIZATION OF PULSE-WIDTH MODULATION
the PWM sequence. In this example 0 < x(n) < A and corresponds directly to a pulse width range of 0 < -r < Ts. To accommodate a bipolar PWM format, a dc level of Al2 is subtracted from the square wave and a corresponding dc offset of A/2 is added to the input sequence, transforming x(n) to a range of -A/2 to A/2. The nonlinear distortion inherent in this class of PWM process arises from two'elements. 1) The spectrum of the input sequence is replicated about the sampling frequency and its harmonics. Consequently the baseband signal must adhere to conventional uniform sampling theory to prevent aliasing distortion. 2) Each sample is then replaced by a constant-amplitude rectangular pulse with an area proportional to the sample amplitude x(n). Although this guarantees exact dc coding, the broad spectrum of each individual pulse is dynamically modified as a function of the pulse width.
Hence following
subsequent
summation
a broad spectrum. In essence, each pulse width has a unique Fourier transform that exhibits differential gain errors with increasing frequency. In Fig. 3 sin(,rf_')/ vrf'r is plotted as a function off for a family of % where gain modulation is evident. To illustrate this distortion mechanism, Fig. 4(a) shows the output spectrum of a symmetrical uniformly sampled PWM system for a periodic input sequence x(n) calculated over 1024 samples. Here x(n)
= A[0.5
+ 0.15 sin(k0n)
+ 0.15 sin(kin)
The samplingrate is 176kHz and the three equiamplitude superimposed input signal frequencies are 171.875 Hz, 17.1875 kHz, and 20.45313 kHz. However, to expose the intermodulation distortion in the de
0
over
:
i
allis TothePUlseS'r°°t examine°fit iSnonlinearitythiSthe dynamiCmechanismin PwM.Spectralof dynamicm°dulati°nspectralthat modulation, the Fourier transform F,,(f) of the nth -60 pulse, illustrated in Fig. 2, is expressed as 'rg /sinCTrf_T)/
F,,(f)
= T_s [
,f'r
(2a)
e -j2:'rnfTs
J
'
(3)
+ 0.15 sin(k2n)] .
:
:i:
: i:::i:
i:
:
i
..... : .... i
-m
where · is calculated from Eq (1). For a low-PWM modulation index, 'rrf'r sin[x(n)z]
0.510 tofa
(10)
where
z - 'rrf
OI)
fs
This matching task-could be solved by an optmization procedure to minimize an error function within the 0 tOfu Hz frequency band. However, because the functions exhibit similar curvature over the lower frequency region, a simpler approach (for a 1 and a2) is to force equalityin thefunctionofEq. (10)at twofrequencies, where we selectfu Hz and 0.5fu Hz. Hence solving two simultaneous equations based on Eq. (10) and modifying the functional form to prevent errors due to small differences, the solution can be stated as
OF PULSE-WIDTH
MODULATION
2) Two extreme case example transforms where m = 0 and 1
of pulses,
3) The corresponding compensated transforms for m = 0 and 1. In these examples the sampling rate fs was 176 kHz and the coefficients were calculated for exact matching at 22 and 11 kHz, respectively. The results clearly show how the compensated and target curves are closely matched over the band 0-22 kHz, even though the PWM sample widths vary over the extreme range from 0 to 1/fs. A detailed comparison of tabulated data also confirms equality at both 22 and 11 kHz. In a pratical implementation of this system, a number of techniques can be adopted for determining al and a2 for each normalized value ofm. First, a direct solution of equation set (12) can be implemented for each new sample m. Second, a discrete look-up table can be computed for a range of m and a ROM used to store coefficient values. Finally, a polynomial approximation can be formed for al and a2 as a function of m, which offers the advantage of efficient signal interpolation. For systems with fine quantization of data (approxi-
magnitude "i
'
'
1.0
2. : :. ....
.5 --
Si -
4S2 + 4 sin2(z)(S2
-
1) + 3
l.....targettransfo
-
4S2 + 4 sin2(z/2)(S2
a2 =
·
·
-
1) + 3
transform,
m =
0
D2
where
frequency (hertz) lo`
+in.z,4s n' s,-
104
2
tOO _' .---II_--_---.._._
2m sin(z/2) 4c°s 2 D'
,ss
sin(mz)
m X region
x_
}
,
_
·
'98 5':'"ma'lche! transfi[m:, m=f
S2-sin(mx/2)
Here m is the normalized input data, 0 < m < 1 on ' which the coefficient estimation is based, and the solution is referred to as equation set (12). To demonstrate the effectiveness of this transform matching process, two sets of Fourier transforms are shown in Fig. 6. The sets include: corresponding
J. Audio Eng. Soc., Vol. 40, No. 4, 1992 April
to a pulse,
.94_o,
! '
.:_
m:05 \:\\
2 tr._. Ise. p au nsforrn, m= 0 3 p...., ulse Iran fsorm, tn-- I 4 matc.._, bed transform, m = 0
2m sin(z/4)
1) The target transform where m = 0.5
10s
magnitude
=
D2
·
3 ..... pulse transform, m = 1= 0 4 ..... matchedtransform,m 5 ....: matched
S 1
.....m = 00.5
2 ..... pulse transform,
D1
a I
_ _ · _
I
:_:--,t_l:/. i
: I
_
] I /
l_ _]
'3-_
I
I..
lo'
'. I
: '/
It
'_ : _ J
I J
:ti
_1:., _o' frequency (hertz)
(b) Fig. 6. PWM transform matching functions for m = 0 and m = 1. Sampling rate 176 kHz; matching frequencies 11 and 22 kHz. (a)Full-range vertical scale. (b) Expanded vertical scale. 239
HAWKSFORD
PAPERS
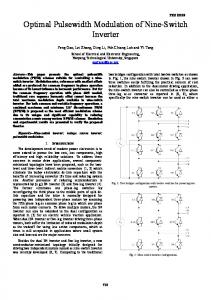
mating a continuous function), the polynomial method is the simplest. However, in more coarsely quantized systems with, say, 1024 values of/t, the ROM technique using predetermined values is the most efficient. Thus knowing the oversampling ratio and modulation index, the appropriate coefficients can be loaded into the FIR filter, thus making the filter response dynamic or samplevalue dependent, To demonstrate the variation of coefficients with modulation index tn, Fig. 7 shows plots of al and a2 against/t for a PWM system with four times oversampling (that is,fs = 176 kHz). Approximate polynomial matched generating functions for al and a2 are also given as
samples to be approximately continuous within eomputer precision. Fig. 8 shows the general system architecture of the dynamic FIR filter used to determine the output sample sequence y(L) that drives directly the pulse-width modulator. Each sample is associated with five coefficients, which also interact with their adjacent samples and where each coefficientset is calculated from a nonlinear dependence on both the central and the surrounding samples. Consequently as the data samples are shifted at the uniform PWM sampling rate, the coefficients having influence on the output sample also change, resulting in a dynamic FIR filter. 2.1 Zigzag Algorithm
al = --0.00598x 4 + 0.000692x 3 -- 0.0554x 2 + 0.0000680x a2 -- 0.00151x 4 -
0.0000158x
In this example the input data x(L) propagate through a 30-stage shift register, where the current output is taken at L = 18 and the clock ratefs = 1/Ts Hz. The input data sequence x(L) is transformed to the output sequence y(L) via a coefficient matrix A(r, L),
+ 0.0141 0.000180x 3 + 0.00345x 2 -
0.000925
.
A(0, L) Afl, L) A(2, L)
However, there is a further level of complexity in the correction process that arises from pulse-widthdependent distortion and the associated dispersive response of the dynamic FIR filter. When the coefficients al and a2 are superimposed on adjacent samples in a more general x(n) sequence and subsequently mapped into aPWMformat, they, by theirnature, eachmodify the width of the four adjacent PWM samples, which in turn modify the correctioncoefficients already calculated and associated with these samples. This nonlinear interdependenceof coefficientsis a recursive process, which because of the symmetricand two-sided form of the FIR impulse response, propagates both forwardandbackwardof the currentsample, although thenumberof iterationscanbe constrained. Thereare a numberof methodsfor calculatingthe coefficient set for a specific data sequence, and we present here two examples. Both methods rely on an
_
from
oversampledpcm data x(L)
Z(2,L)
Z(I,L)
oversampllng