Object process graphs are a finite concise ... ject process graphs through dynamic analysis and dis- ... object traces may then be unified in the black-box un-.
Dynamic Object Process Graphs Jochen Quante, Rainer Koschke University of Bremen, Germany http://www.informatik.uni-bremen.de/st/ {quante, koschke}@informatik.uni-bremen.de
Abstract A trace is a record of the execution of a computer program, showing the sequence of operations executed. A trace may be obtained through static or dynamic analysis. An object trace contains only those operations that relate to a particular object. Traces can be very large for longer system executions. Moreover, they lack structure because they do not show the control dependencies and completely unfold loops. Object process graphs are a finite concise description of dynamic object traces. They offer the advantage of representing control dependencies and loops explicitly. This paper describes a new technique to extract object process graphs through dynamic analysis and discusses several applications. A case study is described that illustrates and demonstrates use and feasibility of the technique.
1
Introduction
Reusable software components are becoming more and more important in software engineering. However, the protocols of such components often remain unspecified, or if they are specified, compliance of applications with those protocols remains unchecked. It is therefore desirable to be able to reconstruct the protocol of a component and to check compliance with a given protocol. Protocol reconstruction could help to make software more reliable and less erroneous. Previous work. Koschke and Zhang [7] sketched a method for protocol recovery. Through unifying different usages of a component, a first hint of its underlying protocol may be obtained (black-box understanding). This information may be complemented through analyzing the internals of the component, such as explicit checks of preconditions that may raise exceptions (glass-box understanding). Furthermore, the user
may validate and enhance the protocol as extracted or may hypothesize a protocol that may then be checked against the actual code (similarly to the idea of the reflexion model). If a component is a class or abstract data type, it can be instantiated multiple times. Each such instance is an object. A protocol then describes the allowable sequences of operations on every object that is an instance of that component. As a first hint toward the underlying protocol, we may extract every sequence of operations on a particular object – essentially every object trace. These object traces may then be unified in the black-box understanding part of protocol recovery. Eisenbarth et al. [2] described in detail how object traces can be extracted statically for individual stack and heap objects. Several other researchers use dynamic analysis instead [3, 4, 10]. They typically create recordings of invocations of the component’s methods in which they later try to find patterns of execution. Contributions. Our paper is a stepping stone of our protocol reconstruction undertake. The paper describes a new dynamic technique to obtain object process graphs. Object process graphs are finite concise descriptions of object traces. They are essentially sparser control flow graphs that contain only those operations relevant to an object. While dynamic object traces may grow virtually infinitely, object process graphs are limited by the number of nodes and edges in the original control flow graph. We demonstrate that dynamically derived object process graphs can not only serve as a basis for protocol recovery but can also be a good starting point for understanding a program. Overview. The remainder of this paper is organized as follows. Section 2 describes the concepts of object traces and process graphs. Section 3 explains the technique used to extract dynamic object process graphs and Section 4 describes several applications of the technique. Section 5 presents a case study demonstrating
use and feasibility of the technique, and Section 6 discusses related research.
2
Traces for Individual Objects
In this section, we define what a trace is in our context and show how sets of traces can be represented by an object process graph. Then, we shortly discuss the differences between static and dynamic tracing. We start with a motivating example. Consider the C program in Figure 1. It deals with two stacks s1 and s2. We assume the usual semantics for stacks here. Function read reads a stack from a file. Although the program has passed all tests, how sure can we be that it does not cause a failure? And in fact, it contains a potential fault that is difficult to spot in the code: a violation of the stack protocol for variable *s1. Through the static analysis by Eisenbarth, Koschke, and Vogel [2], we can extract all sequences of operations potentially applied to s1. Each such sequence is a trace. According to Hoare [5], ”a trace of the behaviour of a process is a finite sequence of symbols recording the events in which the process has engaged up to some moment in time.” While the term process is often used in the context of concurrency, it may also be used to denote any kind of object whose behavior is of interest to us. By object, we mean a local or global variable or a variable allocated on the heap at runtime. Hence, we consider a trace a sequence of operations applied to an object. The potentially infinite traces can be described in a finite closed form through object process graphs. We use the UML activity diagrams as a notation for object process graphs. They consist of eight types of nodes and three types of edges. Nodes represent operations on objects (Read or Write), branches, and routine calls (Call – Entry – Return). Additionally, there is one Start node and one or more End nodes representing the begin and end of lifetime, respectively. Edges represent control flow between two nodes. Edges are unconditional or conditional (true/false) or show invocations of subroutines (call/return). The example object process graph for Figure 1 is shown in Figure 2. Note that it contains only those operations in the program that may be applied to s1; the other two objects s2 and i are not covered. The potential fault is easier to spot in this graph: there is a path in the program in which pop may be applied to an empty stack. An empty stack may occur if the predicate in reverse is false the first time, which in turn is the case when the other stack s2 (or from, respectively) is empty.
00
int main () {
01
int i = 0;
02
Stack *s1 = init ();
10
03
Stack *s2 = read ();
11
04
reverse (s2, s1);
12
05
do
13
06
{ pop(s1);
14
i = i + 1; }
07 08 09
15
void reverse (Stack *from, Stack *to) { while (!empty (from)) push (to, pop (from)); }
while (!empty (s1)); }
Figure 1. Example source code. main
init
reverse ENTRY
CALL reverse
pop
push
empty RETURN
Figure 2. Example object process graph.
Object process graphs were introduced by Eisenbarth et al. [2] to ”describe the set of [static] traces relative to a statically detectable object”. A statically detectable object can be a local or global variable or a heap allocation site. Dynamically, there can be many different incarnations of these statically detectable objects. The statically detectable objects are an equivalence class for dynamic objects that share the same potential behavior (i.e., the sequence of operations applied to them). The set of objects can be infinite, but one is typically interested in only a subset of all objects in a program; for instance, in all objects of a certain type or a set of collaborating objects involved in a use case. Object process graphs allow us to reason about individual objects. Dynamic Object Tracing. Object process graphs can be extracted through static or dynamic analysis. The advantages of dynamic tracing are that there are no infeasible paths in the control flow graph, and aliases
2
are not a problem. On the other hand, the result depends on the input, and full test coverage is impossible generally. Test case implementation may be difficult (if little prior knowledge of the system is available) or at least expensive. Also, code instrumentation is necessary, which may interfere with the program’s behaviour (in particular, the program is often slowed down). Finally, the program must be executed, which may be difficult or expensive in certain domains. So each approach has its pros and cons. In a nutshell, dynamic analysis gives us the lower bound of what could happen whereas static analysis yields the upper bound. It is an open interesting question how close they are in reality. Another difference is the techniques required to gain the information. Static analysis requires global control and data flow analysis, such as pointer analysis. Dynamic analysis requires program instrumentation and transformations on the data. Both of the latter are described in detail in the following sections.
3
approach is that it works in any environment. On the other hand, we are modifying the code, so the program is not the same as before. Three different stages of code instrumentation are possible: • Source code: Insert additional code directly into the source code. Problems could be caused by macro expansion, when code locations cannot be determined exactly. Also, we need to insert different code fragments for every supported programming language. • Intermediate representation: Insert additional nodes and edges into the intermediate representation [6], then generate source code from that. • Binary code: Insert additional code into the binary executable of the program. This can be done either statically or dynamically (e.g., for Java in a class file postprocessor or in an own classloader). We chose to instrument on intermediate level, since this is the most appropriate level for code transformation. The instrumentation only has to be done once for all programming languages. A front end converts all supported languages to an intermediate representation. Although instrumentation might look slightly different for different languages, adaption to these differences should be quite easy on this level if generally available programming language constructs are used. The effort required mainly depends on the design of the intermediate representation and on the constructs to be instrumented. So far, we concentrated on instrumenting C programs. For Java, it would be far easier to instrument on byte code level, since this representation is still quite close to the original code, and since it is the same for all Java compilers and platforms. Also, there are many tools available to support bytecode transformations. For C code, it is not quite as easy, because the code is generated for a specific processor, and the relation to the source code is not clear in many cases. We would have to write a separate instrumentation for each supported architecture. Automated instrumentation could also be done using an aspect-oriented approach [4]. The drawback of this method is that the supported instrumentation locations are quite limited. Therefore, we are using general graph transformations on the intermediate representation to do the instrumentation. The next sections describe the necessary transformations.
Dynamic object process graph extraction
This section describes how we instrument the code to gather dynamic traces, and how we then process the resulting information to get the object process graph.
3.1
Instrumentation
For collecting runtime information from a running program, a program monitor is needed. This monitor can be located at different stages of compilation and execution. It can either modify the code and insert tracing commands, or execute the program in a virtual machine [9]. We chose to do code instrumentation because the other possibilities have severe drawbacks. When executing the program in a virtual machine, usually the connection to the source code is missing, specially for programs that have been compiled to machine language (like C). When using a debugger for the same purpose, the line by line step width is not fine-grained enough for dynamic tracing. For example, when several branches of a statement are located on the same line and the condition is complex (e.g. containing shortcut assignments and short-circuit evaluation), one would have to emulate the entire evaluation – this would end up in implementing a virtual machine. Code instrumentation means that we are inserting additional code into the program which outputs the state of the program or collects whatever information is necessary at a certain point. The advantage of this
Normalizing Transformation. First, certain constructs in the intermediate representation are converted to a normalized form. This is done because
3
we want to avoid handling all the different possibilities of specifying a loop separately. With this normalization, we can later handle all those loops in a uniform way [6]. All loops can be expressed in terms of if, goto and label. Therefore, in a first step, loops and also switch/case statements are replaced by if/goto/label constructs. Occurences of break and continue are replaced by gotos. Instrumenting Transformation. Based on the normalized representation, the intrinsic instrumentation can be done. Our goal is to gather the information necessary to reconstruct the control flow graph with respect to a given object. Therefore, we need to instrument all the constructs that influence control flow: conditional and unconditional jumps, function calls, and returns. Also, we need information about lifetimes of objects and about the points where they are accessed. Therefore, the following instrumentation locations are used to create dynamic object traces. A logging call is inserted at all these places:
are interested in them only when they are really used, and usage is logged when read/write occurs. Explicit goto logging is also not needed, since the next statement after the goto will be the logging of the target label. Read/Write Instrumentation. An interesting part is the instrumentation of reads and writes. In C, we have to deal with pointers, pointers to pointers and the like. Therefore, we need to check exactly which objects are being touched in an expression. As an example, take a look at the following expression (with int **x): (**x)++; This expression leads to a read of object x to get the address of the address, a read of object *x to get the address, a read of object **x to get the old value, the addition of 1, and a write of the resulting value to object **x. Therefore, three different objects are involved in this expression: two with one read operation each, and one with a read and a write operation.
• malloc marks the begin of life of a heap variable. This leads to Start nodes in the object process graph.
Handling of arrays and records. An array or a record can be regarded as a single object, or each of its elements can be regarded as an object. The dynamic analysis could trace at both levels, that is, it could trace individual elements of an array or record as well as summarize the individual accesses as a partial read or write to the composite structure as a whole. In future research, we want to compare dynamic to static object tracing. The static pointer analysis does not differentiate between individual elements of an array because the distinction can be made statically only in trivial cases. For this reason, we will trace only whole composite objects dynamically, too. To reflect whole composite objects in the dynamic analysis, objects are identified by their base address. This means when some operation reads or writes to an address that is in the address range of a known object, the address that is logged by the instrumented program is the base address of the object. For this, the instrumented program keeps a mapping from address ranges to base addresses. For heap variables, the size is given as a parameter to the malloc function, and for local and global variables, sizeof delivers the variable’s size based on the information about the type.
• begin life/end life mark begin and end of life for local variables. They occur at the beginning and end of scope of a variable. Global variables’ lifes begin when the program is started and end when it terminates (including static local variables). • read/write trace object access (see below). • branch true/branch false mark conditional branches. The information is logged when one of the two possible branches is entered. • entry/return trace function calls. • labels are needed to identify locations in the program that are passed several times, like in loops. • Additional labels: at merge of control flow, before function calls, and before gotos. All of the trace loggings create a unique identifier (a label), together with either the address of the object or the name of the function or label. Only the branch log statements do not have any additional information like that. Additional identifiers are inserted at certain places to later allow the construction of call nodes and to aid the detection of loops. Function calls do not need to be logged because entry/return inside the called function already contains all the necessary information. To uniquely identify the caller, an additional identifier is generated at the call site. Also, parameters need not be logged, because we
Example. Figure 4 shows an excerpt of a dynamic trace. It has been generated by the instrumented version of the routine in Figure 3. Each row in the trace contains the type of event, the address or identifier of the concerned object, function, or label and the unique location identifier. These identifiers are also shown in the program in Fig. 3 as comments. 4
void notset(int * s) { int i; i = 0; lab_1085: if (i < 4) { s[i] = ~s[i]; ++i; goto lab_1085; } else { } }
/* /* /* /* /* /* /* /*
4852 */ source location */ 4834 */ 4835 */ 4837 */ 4836_T */ 4840-4847 */ 4848-4849 */
/* /* /* /*
4836_F */ merge: 4839 */ end_life: 4850 */ return: 4853 */
enter begin_life write label read branch-true read ... write label read branch-false label end_life return_from
bffff720 bffff720 lab_1085 bffff720 lab_4838 bffff720 notset
4852 i/dfa.c__256__1 4834 4835 4837 4836_T 4841 4849 4835 4837 4836_F 4839 4850 4853
Figure 4. Example trace file excerpt for a call of routine notset from Fig. 3.
Figure 3. Normalized code example (was a for loop before normalization); comments show the corresponding unique ids.
3.2
notset bffff720 bffff720 lab_1085 bffff720
• remove unnecessary branch nodes with only one outgoing edge,
Trace to Object Process Graph
• replace a pair of branch true and branch false nodes with a true and a false edge,
The resulting traces contain the information about all objects that occurred in the program run. Therefore, at first, a filter is applied that extracts the relevant information for only one object. This is done by checking inside each called function whether there is any read or write of the object. If not, the entire function is removed from the trace. Of course, all reads and writes on other objects are also removed. The filter could actually be moved to the instrumentation phase so that only those pieces of code are instrumented that deal with a certain type of expression, if objects of that type are to be investigated. Instrumenting more selectively would help to reduce the amount of data that is produced by the instrumented program and may avoid unacceptable performance losses. However, this selective instrumentation could possibly reduce the accuracy and would question the advantages of dynamic analysis with respect to aliases and pointer arithmetics. The instrumentation would rely on type information, and there are many ways in C to circumvent the type system. From the resulting reduced trace, a graph is generated. Every identifier that occurs in the trace leads to a node in the graph and therefore represents a location in the control flow graph. Edges are inserted as they are induced by the order of identifiers, with the exception of returns which lead to edges to the call node. Call nodes are generated on-the-fly based on call location, entry and return node. Then, the following simplifying and semanticspreserving transformations are applied to the graph:
• replace all the return nodes for one function with a single return node. After that, more semantics-preserving transformations are repeatedly applied until the graph cannot be simplified any more: • remove unnecessary label nodes, i.e., label nodes that have only one predecessor or one successor, or that have only one outgoing edge that does not lead to the node itself; • remove local loops, i.e., edges that lead from a node to itself. These nodes can be removed since all terminating loops must have at least one condition and another node inside the loop. The case of endless loops is not considered; • remove subgraphs that are not relevant for control flow. Control dependency analysis is performed to find out which conditional nodes are really relevant. When none of these transformations can be applied any more, we have got the dynamic object process graph for one object in one program run as the result. Finally, the graph is sliced with respect to the allocation point in the same way as described in [2]. Our current prototype implementation is an off-line creation of object process graphs. Yet, we could as well create the graphs online in order to avoid the generation of huge trace files. 5
void f(int x) { ... }
4
void main(int argc, char **argv) { int i; for ( i = 1; i < argc; i ++ ) f(i); }
Object process graphs can be used in many ways. We identified the following applications. Detection of infeasible paths. A dynamic trace is always a subset of the corresponding static trace. In contrast to the static trace, all paths in the dynamic trace are guaranteed to be executable. Therefore, the dynamic traces can help identify infeasible paths in the static traces. Unfortunately, the comparison requires a high test coverage, which usually is expensive to achieve.
Figure 5. Simple example program (a) argc = 1:
Write
Read
(b) argc > 1: Write
t
Read
Read
Applications
Test coverage checking. As stated above, differences between the static trace and the dynamic trace can be due to infeasible paths in the static trace, but may also be due to insufficent coverage for the executions of the program. Therefore, the combination of the two analyses can also help to detect missing test cases for a given object.
Write
f
Figure 6. Example dynamic object process graph for variable i of Fig. 5. For argc > 1, it is identical to the statically extracted object process graph.
Protocol recovery and validation. As outlined in [7], static traces can be used as a basis for protocol recovery and validation. Of course, the same is true for dynamic traces. Graph transformations can be applied on the traces to get to the underlying protocol of the component. Other protocol recovery approaches based on traces are discussed in Section 6.
Example. Figure 5 shows a simple for loop. The corresponding dynamic traces for variable i are shown in Figure 6. Fig. 6(a) shows the dynamic object process graph for the trace with argc = 1. The loop body is never entered, so the graph is very small. It consists only of one write access (i=1) and one read access (i 1. It is extended by the branch node and the i++ statement inside the loop. This graph is the same that would be derived by static analysis. Note that function f() does not appear in the process graph, because it is irrelevant for operations on i (the formal parameter x is a copy of i but not i itself). Although the example is simple, it allows us to verify a primitive and general protocol for all variables: they must be written before they can be read, and for each write there should be a read afterward. This small example also illustrates how the completeness of the dynamically created object process graph depends on the coverage of the used test cases. Another class of systematic differences is caused by the imprecision of points-to analysis, which can lead to infeasible paths in the static trace.
Program understanding. Dynamic traces can help to better understand a program with respect to a given object. The call paths that are really used can be identified easily. For central features, such as file operations for a database, object traces can give helpful insight into the design of the program. Feature location. Another kind of dynamic analysis is the feature location approach as described by Eisenbarth, Koschke, and Simon in [1]. They used concept analysis to classify routines as specific, conditionally specific, relevant or irrelevant for a given feature. That approach also works on basic block level. However, the resulting concepts are quite fine-grained and often distributed throughout the code. Dynamic tracing can be combined with that approach. The features that are involved for each execution of the instrumented program have to be recorded. Then concept analysis can be applied to the resulting graphs and the collected feature sets. This is possible because the graphs for the individual test cases are subgraphs of the combined graph (and also of the static graph). Concept analysis then tells us which subgraphs are specific, relevant, etc. for each feature. The advantage is that the results are much better readable than
6
sets of basic blocks, since we will usually get contiguous sequences of operations for a test case. Results will also be more detailed than routine level information. Since we are only looking at a subgraph of the control flow graph with respect to one variable, the amount of data is much smaller compared to the set of all basic blocks. But often, those subgraphs are still too large to be understandable without further assistance. Concept analysis could provide that assistance.
open
read
In the following section, we will go into more details of two of those applications, namely protocol recovery and program understanding, and give some examples.
5
lseek
fcntl
...
close
Figure 7. Example protocol for C files.
Case Study
With the technique described in the previous section, we can generate dynamic traces for a given program. Dynamic trace extraction is an enabling technique. Similarly to program slicing, dynamic trace extraction slices the control flow graph so that only those statements are kept that are relevant for a particular aspect. In program slicing relevance means control and data dependency. For dynamic trace extraction, the flow of operations and their conditions are of relevance. This section demonstrates use and feasibility of the technique by applying it to a standard component used in many programs. We will first show the protocol for the component, then an object process graph obtained through dynamic analysis, and finally a reduced representation of that graph that simplifies protocol validation.
5.1
write
creat
It is interesting to note that usually only excerpts of this protocol occur for an object. This excerpt characterizes the object. The excerpt can be thought of as a role as, for instance, a sequential writer or reader or random accessor, etc. The object process graph tells us the role of an object.
5.2
The Subject Systems
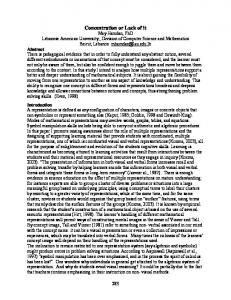
Communication: ircII chat client ircII is a console internet relay chat application1 . This system consists of 49,734 physical lines of C code, which are distributed over 59 files. The central concern of a chat application is communication, which is done using sockets. Therefore, the control flow with respect to the operations that are performed on the socket handle should give a good overview about the organization of the program’s basic functionality. We performed dynamic tracing on the ircII client. The test session included connecting to an IRC server and executing a few typical commands. The resulting raw trace contained 6.8 million events, which were then converted to an object process graph as described above. Figure 8 shows the complete object process graph. It consists of 115 nodes and 161 edges. This is a very good reduction compared to the complete control flow graph which has approximately 25,000 nodes, and even compared to the call graph with 1,707 nodes and 4,628 edges. In Figure 8, italic function calls denote application functions, while regular function names with brackets denote functions of the investigated interface. From this representation, it is quite easy to see what is going on in the ircII application. Things start with the Start node on the right. After the socket is created
The Protocol
We investigated the use of standard Unix I/O operations. These operations are applied to a FILE data type. This data structure and the operations taking it as an argument type form an abstract data type. Alternatively, handles can be used, which are represented by a normal int value. In order to be able to process such handles in the same way as objects, we modelled the operations on handles as read/write operations on a handle; that is, executing an operation on a handle is regarded as an access to the memory address that the handle points to. The system functions are replaced by decorators that additionally record that memory access. We focused on this data type because it is frequently used in programs and because it has an interesting protocol. The allowable sequences of operations are described in Fig. 7 (the dots indicate the many other operations that can be applied to a FILE or a handle).
1 http://www.eterna.com.au/ircii/
7
read()
main loop Call do_server
select()
Call connect_to_server
Call irc_io
select()
Call irc_do_a_screen Call connect fcntl()
Call dgets Call send_line Call login_to_server
setsockopt() socket()
Call p_channel Start
Call parse_command
send()
Final close()
Call irc_exit
fcntl()
send_to_server and its call sites
command dispatching through function pointers
Figure 8. ircII object process graph.
and initialized in connect, the I/O main loop is entered (irc io). From there, either a user command is executed (irc do a screen), or information from a server is received and processed (do server). Most paths then lead to the send to server routine. Finally, if an exit command has been issued, the socket is closed, which leads to the Final node in the graph. The information in the object process graph can help to gain an initial understanding of the program:
one outgoing call edge. If dispatching was, for example, implemented through a switch, we would see a cascade of conditional nodes at that place. In the graph, all the different types of nodes and edges that were described above are being used. Edge types and directions are not visible in this figure. Apparently, they are not necessary to get a basic understanding. But when going into details, the types can provide additional information. Most of the edges from Start to Call irc io are return edges. There are no call edges there, because the lifetime of the socket handle starts only with the call of the socket function. On the other side, control flow goes down into different functions (Call edges), and later goes back up again (Return edges). This produces the typical chains that split and join again and again. We used a simple standard spring embedder layout for this graph and applied some manual postprocessing. Using a specialized layout algorithm, readability of this graph could probably be improved even further. For example, nodes that belong to the same function could be grouped together and marked by a common background color. Functions that are called from many places could be moved to a central location. The direction of control flow could be visualized by a top-down or left-to-right order of the nodes. Also, some of the
• Feature location: identify parts that are relevant for communication. In this case, also the main loop has been located. • Understand call paths and control dependencies. • Identify central routines (like send to server). Even when the irc io routine has been identified as the main loop by other means of feature location, the 246 lines of C code of that routine are still much harder to understand than just looking at the 5 nodes in the graph. Apart from this basic information, also implementation details can be seen from this graph. For example, user commands are dispatched through function pointers (see indication in the figure). This is the case when a single call node has several outgoing call edges to different entry nodes – usually, a call node has at most 8
node labels have been manually removed to make the graph more readable. This could be done automatically as well.
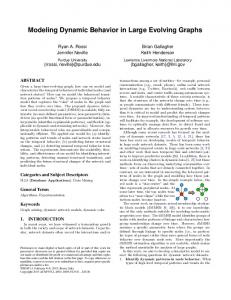
The simplified representation can be annotated so that traceability to the source can be assured. The simplified representation is better suited to validate and reconstruct protocols. It can be processed by standard algorithms for finite state automata to unify process graphs and validate protocols. Figure 9 shows a simplified object process graph for SQLite. Whereas the original object process graph contains 300 nodes, the simplified one contains only about 60 nodes. In Figure 9, the gray nodes represent more complex graphs containing additional calls of read, write, lseek and other operations. Now, we demonstrate how this graph may be used for protocol validation. We can use an automatic analysis to detect a discrepancy between the specified protocol and the dynamic traces. This analysis works as follows:
File operations: SQLite database SQLite is a small C library that implements a self-contained, embeddable, zero-configuration SQL database engine2 . We chose this system because a database system can naturally be expected to contain interesting file system interactions. The library consists of 60,776 physical lines of code in 65 source files (version 3.2.6). It includes a command line utility for accessing databases and executing SQL statements, which was used in our tests. The call graph of SQLite contains 1,649 nodes and 3,098 edges, and the control flow graph contains about 25,000 nodes. Application of dynamic tracing on the SQLite tool results in a graph similar to Fig. 8, but the graph is more complex. It consists of 300 nodes and 463 edges, which is too much to show here. The test cases we performed included standard database operations, such as insert, delete, update, select statements, as well as metacommands like dumping all tables. Also for this graph, the operations performed could be identified in the graph and helped gaining an initial understanding of the system. But, due to the size of the graph, further assistance from a tool would be required to use it effectively. One possible approach is to reduce the graph to the primitive operations. This is described in detail in the next section.
5.3
1. represent the object process graph and the protocol by two deterministic finite state automata, T and P , respectively, 2. combine these two automata by adding one new starting node, S, plus two epsilon transitions from S to the starting nodes of T and P ; where the set of accepting states of the new combined automaton is the union of the accepting states of T and P , 3. create a deterministic combined automaton using Moore’s algorithm [8], 4. and check whether every state, t of T , has at least one equivalent state, p of P , in the minimized combined automaton and, if t is an accepting state, p is also an accepting state.
Simplified Object Process Graph
Using this algorithm, a discrepancy can be found in Figure 9. The object process graph suggests that there is a path from open to the final node that leaves out the close node, which would not conform to the protocol. An analyst could now investigate this discrepancy. As a matter of fact, this path is an artifact of the representation. It is a result of the fact that there is a dynamic path that returns to the same node. Fortunately, the dynamic information may be used to exclude this apparent path. Nevertheless, this path is statically a valid path. Now it is the analyst’s task to check whether the static path is in fact infeasible or whether the test cases were incomplete.
The object process graphs as extracted by the above technique contain all context information. They describe the whole control flow and the associated control dependencies for an object. This representation is suited for detailed program comprehension. A simplified representation thereof can be obtained by removing chains of pure return edges and collapsing nested conditions. The process is essentially the minimization of finite state automata by Rabin-Scott. For this to work, one must view the object process graph as a finite state automaton. Global control flow graphs, however, are described by context-free grammars (if only control flow is taken into account) rather than regular grammars because of nested calls that always return to the caller. This view, hence, introduces some imprecision if there are recursive calls.
6
Related Work
This section discusses related research in dynamic object trace recovery. An elaborated discussion of related research in static object trace recovery can be found elsewhere [2].
2 http://www.sqlite.org/
9
lseek
fstat
read
quences for a given object representing loops and control dependencies. In contrast to earlier dynamic tracing, our traces consider the control flow of the client application. Also, our approach is not limited to component interfaces, but it is capable of tracing any operations on arbitrary objects. Moreover, our dynamic tracing overcomes the space problem of traditional tracing, which creates huge traces for longer program runs. Dynamic object process graphs are limited in size and can be constructed on-the-fly while the program is running. Dynamic object process extraction is an enabling technique similar to program slicing with applications in program comprehension, testing, feature location, and protocol recovery and validation. We demonstrated its feasibility and use in two case studies with non-trivial programs. In future work, we will investigate the difference of static and dynamic object tracing and ways to combine them. Moreover, we will further investigate the application of this technique for protocol reconstruction and validation.
open prepare
process input
step
close
callback
Figure 9. Simplified object process graph.
Ammons et al. [3] try to reconstruct the specification of an API or abstract data type. They use a tracer which operates on executables and replaces function calls by tracing function calls. Parameters and return values are logged, and an expert has to specify which functions are definers and which are users. Their result is an automaton that accepts possible sequences of function calls of the API. They use automaton learning techniques that reconstruct the automaton from examples of the accepted language. However, they regard the protocol only at the interface level and ignore the control flow in the client application. Gschwind and Oberleitner [4] use aspects to instrument the program. This way, they trace method invocations and the parameters passed. Objects are monitored from different perspectives: Use of an object, i.e., calls of an object’s methods, calls from the object, and how and when an object is passed as a parameter. The results are visualized as UML sequence diagrams. This interactive approach aims at visualizing object interactions online and also works on interface level only. Xie and Notkin [10] show how to generate sliced object state machines. Object states lead to states in the object state machine, i.e., each possible value of the object corresponds to one state. The dynamic traces are produced by using generated tests. States in our approach represent control, not data. Our approach does not only look at function calls, but also traces accesses to individual objects. The complete slice of the control flow graph that is relevant for the given object is reconstructed. Furthermore, we do not only handle objects in an object-oriented environment, but also in procedural code where the connection of objects and their methods is not obvious.
7
References [1] T. Eisenbarth, R. Koschke, and D. Simon. Locating features in source code. IEEE TSE, 29(3), 2003. [2] T. Eisenbarth, R. Koschke, and G. Vogel. Static object trace extraction for programs with pointers. Journal of Systems and Software, 77(3):263–284, Sep 2005. [3] J. L. G. Ammons, R. Bodik. Mining specifications. In Proc. 29th symp. on Principles of prog. languages, Portland, Oregon, USA, 2002. [4] T. Gschwind and J. Oberleitner. Improving dynamic data analysis with aspect-oriented programming. In Proc. of the 7th CSMR. IEEE Press, Mar. 2003. [5] C. A. R. Hoare. Communicating Sequential Processes. Prentice Hall International, 1985. [6] R. Koschke and J.-F. Girard. An intermediate representation for reverse engineering analyses. In Working Conference on Reverse Engineering, pages 241–250, Hawai, USA, Oct 1998. [7] R. Koschke and Y. Zhang. Component recovery, protocol recovery and validation in bauhaus. In 3rd Reengineering Workshop, Bad Honnef, Germany, Fachberichte Informatik, May 2001. [8] E. Moore. Gedanken-experiments on sequential circuits. In Shannon and McCarthy, editors, Automata Studies. Princeton Univ. Press, Princeton, NJ, 1956. [9] S. Shende. Profiling and tracing in linux. In Proc. Extreme Linux Workshop #2, USENIX, Monterey, CA, USA, 1999. [10] T. Xie and D. Notkin. Automatic extraction of sliced object state machines for component interfaces. In Proc. 3rd Workshop on Specification and Verification of Component-Based Systems, pages 39–46, Newport Beach, CA, USA, 2004.
Conclusion
This paper has introduced a new technique to extract object process graphs dynamically. Dynamic object process graphs summarize dynamic operations se-
10