There was a problem previewing this document. Retrying... Download. Connect more apps... Try one of the apps below to op
www.redpel.com +917620593389 IEEE TRANSACTIONS ON KNOWLEDGE AND DATA ENGINEERING VOL:PP NO:99 YEAR 2013
1
Dynamic Query Forms for Database Queries Liang Tang, Tao Li, Yexi Jiang, and Zhiyuan Chen Abstract—Modern scientific databases and web databases maintain large and heterogeneous data. These real-world databases contain over hundreds or even thousands of relations and attributes. Traditional predefined query forms are not able to satisfy various ad-hoc queries from users on those databases. This paper proposes DQF, a novel database query form interface, which is able to dynamically generate query forms. The essence of DQF is to capture a user’s preference and rank query form components, assisting him/her to make decisions. The generation of a query form is an iterative process and is guided by the user. At each iteration, the system automatically generates ranking lists of form components and the user then adds the desired form components into the query form. The ranking of form components is based on the captured user preference. A user can also fill the query form and submit queries to view the query result at each iteration. In this way, a query form could be dynamically refined till the user satisfies with the query results. We utilize the expected F-measure for measuring the goodness of a query form. A probabilistic model is developed for estimating the goodness of a query form in DQF. Our experimental evaluation and user study demonstrate the effectiveness and efficiency of the system. Index Terms—Query Form, User Interaction, Query Form Generation,
F
1
I NTRODUCTION
Query form is one of the most widely used user interfaces for querying databases. Traditional query forms are designed and predefined by developers or DBA in various information management systems. With the rapid development of web information and scientific databases, modern databases become very large and complex. In natural sciences, such as genomics and diseases, the databases have over hundreds of entities for chemical and biological data resources [22] [13] [25]. Many web databases, such as Freebase and DBPedia, typically have thousands of structured web entities [4] [2]. Therefore, it is difficult to design a set of static query forms to satisfy various ad-hoc database queries on those complex databases. Many existing database management and development tools, such as EasyQuery [3], Cold Fusion [1], SAP and Microsoft Access, provide several mechanisms to let users create customized queries on databases. However, the creation of customized queries totally depends on users’ manual editing [16]. If a user is not familiar with the database schema in advance, those hundreds or thousands of data attributes would confuse him/her. 1.1
Our Approach
In this paper, we propose a Dynamic Query Form system: DQF, a query interface which is capable of dynamically generating query forms for users. Different from traditional document retrieval, users in database • Liang Tang, Tao Li, and Yexi Jiang are with School of Computer Science, Florida International University, Miami, Florida, 33199, U.S.A. E-mail: {ltang002,taoli, yjian004}@cs.fiu.edu • Zhiyuan Chen is with Information Systems Department, University of Maryland Baltimore County, Baltimore, MD, 21250, U.S.A
www.redpel.com +917620593389
TABLE 1 Interactions Between Users and DQF Query Form Enrichment
Query Execution
1) DQF recommends a ranked list of query form components to the user. 2) The user selects the desired form components into the current query form. 1) The user fills out the current query form and submit a query. 2) DQF executes the query and shows the results. 3) The user provides the feedback about the query results.
retrieval are often willing to perform many rounds of actions (i.e., refining query conditions) before identifying the final candidates [7]. The essence of DQF is to capture user interests during user interactions and to adapt the query form iteratively. Each iteration consists of two types of user interactions: Query Form Enrichment and Query Execution (see Table 1). Figure 1 shows the work-flow of DQF. It starts with a basic query form which contains very few primary attributes of the database. The basic query form is then enriched iteratively via the interactions between the user and our system until the user is satisfied with the query results. In this paper, we mainly study the ranking of query form components and the dynamic generation of query forms. 1.2 Contributions Our contributions can be summarized as follows: • We propose a dynamic query form system which generates the query forms according to the user’s desire at run time. The system provides a solution
www.redpel.com +917620593389 2
Fig. 1. Flowchart of Dynamic Query Form for the query interface in large and complex databases. • We apply F-measure to estimate the goodness of a query form [30]. F-measure is a typical metric to evaluate query results [33]. This metric is also appropriate for query forms because query forms are designed to help users query the database. The goodness of a query form is determined by the query results generated from the query form. Based on this, we rank and recommend the potential query form components so that users can refine the query form easily. • Based on the proposed metric, we develop efficient algorithms to estimate the goodness of the projection and selection form components. Here efficiency is important because DQF is an online system where users often expect quick response. The rest of the paper is organized as follows. Section 2 describes the related work. Section 3 defines the query form and introduces how users interact with our dynamic query form. Section 4 defines a probabilistic model to rank query form components. Section 5 describes how to estimate the ranking score. Section 6 reports experimental results, and finally Section 7 concludes the paper.
2
R ELATED W ORK
How to let non-expert users make use of the relational database is a challenging topic. A lot of research works focus on database interfaces which assist users to query the relational database without SQL. QBE (Query-By-Example) [36] and Query Form are two most widely used database querying interfaces. At present, query forms have been utilized in most real-world business or scientific information systems. Current studies and works mainly focus on how to generate the query forms. Customized Query Form: Existing database clients and tools make great efforts to help developers design and generate the query forms, such as EasyQuery [3], Cold Fusion [1], SAP, Microsoft Access and so on.
www.redpel.com +917620593389
They provide visual interfaces for developers to create or customize query forms. The problem of those tools is that, they are provided for the professional developers who are familiar with their databases, not for end-users [16]. [17] proposed a system which allows end-users to customize the existing query form at run time. However, an end-user may not be familiar with the database. If the database schema is very large, it is difficult for them to find appropriate database entities and attributes and to create desired query forms. Automatic Static Query Form: Recently, [16] [18] proposed automatic approaches to generate the database query forms without user participation. [16] presented a data-driven method. It first finds a set of data attributes, which are most likely queried based on the database schema and data instances. Then, the query forms are generated based on the selected attributes. [18] is a workload-driven method. It applies clustering algorithm on historical queries to find the representative queries. The query forms are then generated based on those representative queries. One problem of the aforementioned approaches is that, if the database schema is large and complex, user queries could be quite diverse. In that case, even if we generate lots of query forms in advance, there are still user queries that cannot be satisfied by any one of query forms. Another problem is that, when we generate a large number of query forms, how to let users find an appropriate and desired query form would be challenging. A solution that combines keyword search with query form generation is proposed in [12]. It automatically generates a lot of query forms in advance. The user inputs several keywords to find relevant query forms from a large number of pregenerated query forms. It works well in the databases which have rich textual information in data tuples and schemas. However, it is not appropriate when the user does not have concrete keywords to describe the queries at the beginning, especially for the numeric attributes. Autocompletion for Database Queries: In [26], [21], novel user interfaces have been developed to assist the user to type the database queries based on the query workload, the data distribution and the database schema. Different from our work which focuses on query forms, the queries in their work are in the forms of SQL and keywords. Query Refinement: Query refinement is a common practical technique used by most information retrieval systems [15]. It recommends new terms related to the query or modifies the terms according to the navigation path of the user in the search engine. But for the database query form, a database query is a structured relational query, not just a set of terms. Dynamic Faceted Search: Dynamic faceted search is a type of search engines where relevant facets are presented for the users according to their navigation paths [29] [23]. Dynamic faceted search engines
www.redpel.com +917620593389 3 are similar to our dynamic query forms if we only consider Selection components in a query. However, besides Selections, a database query form has other important components, such as Projection components. Projection components control the output of the query form and cannot be ignored. Moreover, designs of Selection and Projection have inherent influences to each other. Database Query Recommendation: Recent studies introduce collaborative approaches to recommend database query components for database exploration [20] [9]. They treat SQL queries as items in the collaborative filtering approach, and recommend similar queries to related users. However, they do not consider the goodness of the query results. [32] proposes a method to recommend an alternative database query based on results of a query. The difference from our work is that, their recommendation is a complete query and our recommendation is a query component for each iteration. Dynamic Data Entry Form: [11] develops an adaptive forms system for data entry, which can be dynamically changed according to the previous data input by the user. Our work is different as we are dealing with database query forms instead of data-entry forms. Active Feature Probing: Zhu et al. [35] develop the active featuring probing technique for automatically generating clarification questions to provide appropriate recommendations to users in database search. Different from their work which focuses on finding the appropriate questions to ask the user, DQF aims to select appropriate query components.
3 3.1
Q UERY F ORM I NTERFACE Query Form
In this section we formally define the query form. Each query form corresponds to an SQL query template. Definition 1: A query form F is defined as a tuple (AF , RF , σF , ◃▹ (RF )), which represents a database query template as follows: F =
(SELECT A1 , A2 , ..., Ak FROM ◃▹ (RF ) WHERE σF ),
where AF = {A1 , A2 , ..., Ak } are k attributes for projection, k > 0. RF = {R1 , R2 , ..., Rn } is the set of n relations (or entities) involved in this query, n > 0. Each attribute in AF belongs to one relation in RF . σF is a conjunction of expressions for selections (or conditions) on relations in RF . ◃▹ (RF ) is a join function to generate a conjunction of expressions for joining relations of RF . In the user interface of a query form F , AF is the set of columns of the result table. σF is the set of input components for users to fill. Query forms allow users to fill parameters to generate different queries. RF and ◃▹ (RF ) are not visible in the user
www.redpel.com +917620593389
interface, which are usually generated by the system according to the database schema. For a query form F , ◃▹ (RF ) is automatically constructed according to the foreign keys among relations in RF . Meanwhile, RF is determined by AF and σF . RF is the union set of relations which contains at least one attribute of AF or σF . Hence, the components of query form F are actually determined by AF and σF . As we mentioned, only AF and σF are visible to the user in the user interface. In this paper, we focus on the projection and selection components of a query form. Ad-hoc join is not handled by our dynamic query form because join is not a part of the query form and is invisible for users. As for ”Aggregation” and ”Order by” in SQL, there are limited options for users. For example, ”Aggregation” can only be MAX, MIN, AVG, and so on; and ”Order by” can only be ”increasing order” and ”decreasing order”. Our dynamic query form can be easily extended to include those options by implementing them as dropdown boxes in the user interface of the query form. 3.2 Query Results To decide whether a query form is desired or not, a user does not have time to go over every data instance in the query results. In addition, many database queries output a huge amount of data instances. In order to avoid this “Many-Answer” problem [10], we only output a compressed result table to show a highlevel view of the query results first. Each instance in the compressed table represents a cluster of actual data instances. Then, the user can click through interested clusters to view the detailed data instances. Figure 2 shows the flow of user actions. The compressed high-level view of query results is proposed in [24]. There are many one-pass clustering algorithms for generating the compressed view efficiently [34], [5]. In our implementation, we choose the incremental data clustering framework [5] because of the efficiency issue. Certainly, different data clustering methods would have different compressed views for the users. Also, different clustering methods are preferable to different data types. In this paper, clustering is just to provide a better view of the query results for the user. The system developers can select a different clustering algorithm if needed.
Fig. 2. User Actions Another important usage of the compressed view is to collect the user feedback. Using the collected feed-
www.redpel.com +917620593389 4 back, we can estimate the goodness of a query form so that we could recommend appropriate query form components. In real world, end-users are reluctant to provide explicit feedback [19]. The click-through on the compressed view table is an implicit feedback to tell our system which cluster (or subset) of data instances is desired by the user. The clicked subset is denoted by Duf . Note that Duf is only a subset of all user desired data instances in the database. But it can help our system generate recommended form components that help users discover more desired data instances. In some recommendation systems and search engines, the end-users are also allowed to provide the negative feedback. The negative feedback is a collection of the data instances that are not desired by the users. In the query form results, we assume most of the queried data instances are not desired by the users because if they are already desired, then the query form generation is almost done. Therefore, the positive feedback is more informative than the negative feedback in the query form generation. Our proposed model can be easily extended for incorporating the negative feedback.
4
R ANKING M ETRIC
Query forms are designed to return the user’s desired result. There are two traditional measures to evaluate the quality of the query results: precision and recall [30]. Query forms are able to produce different queries by different inputs, and different queries can output different query results and achieve different precisions and recalls, so we use expected precision and expected recall to evaluate the expected performance of the query form. Intuitively, expected precision is the expected proportion of the query results which are interested by the current user. Expected recall is the expected proportion of user interested data instances which are returned by the current query form. The user interest is estimated based on the user’s clickthrough on query results displayed by the query form. For example, if some data instances are clicked by the user, these data instances must have high user interests. Then, the query form components which can capture these data instances should be ranked higher than other components. Next we introduce some notations and then define expected precision and recall. Notations: Table 2 lists the symbols used in this paper. Let F be a query form with selection condition σF and projection attribute set AF . Let D be the collection of instances in ◃▹ (RF ). N is the number of data instances in D. Let d be an instance in D with a set of attributes A = {A1 , A2 , ..., An }, where n = |A|. We use dAF to denote the projection of instance d on attribute set AF and we call it a projected instance. P (d) is the occurrence probability of d in D. P (σF |d) is the probability of d satisfies σF . P (σF |d) ∈ {0, 1}.
www.redpel.com +917620593389
TABLE 2 Symbols and Notations F RF A AF Ar (F ) σF OP d D N d A1 DA 1 Q DQ Duf α
query form set of relations involved in F set of all attributes in ◃▹ (RF ) set of projection attributes of query form F set of relevant attributes of query form F set of selection expressions of query form F set of relational operators in selection data instance in ◃▹ (RF ) the collection of data instances in ◃▹ (RF ) number of data instances in D data instance d projected on attribute set A1 set of unique values D projected on attribute set A1 database query results of Q user feedback as clicked instances in DQ fraction of instances desired by users
P (σF |d) = 1 if d is returned by F and P (σF |d) = 0 otherwise. Since query form F projects instances to attribute set AF , we have DAF as a projected database and P (dAF ) as the probability of projected instance dAF in the projected database. Since there are often duplicated projected instances, P (dAF ) may be greater than 1/N . Let Pu (d) be the probability of d being desired by the user and Pu (dAF ) be the probability of the user being interested in a projected instance. We give an example below to illustrate those notations. TABLE 3 Data Table ID I1 I2 I3 I4 I5
C1 a1 a1 a1 a1 a1
C2 b1 b2 b2 b1 b3
C3 c1 c2 c3 c4 c4
C4 20 20 30 20 10
C5 1 100 99 1 2
Example 1: Consider a query form Fi with one relational data table shown in Table 3. There are 5 data instances in this table, D = {I1 , I2 , ..., I5 }, with 5 data attributes A = {C1 , C2 , C3 , C4 , C5 }, N = 5. Query form Fi executes a query Q as “SELECT C2 , C5 FROM D WHERE C2 = b1 OR C2 = b2 ”. The query result is DQ = {I1 , I2 , I3 , I4 } with projected on C2 and C5 . Thus P (σFi |d) is 1 for I1 to I4 and is zero for I5 . Instance I1 and I4 have the same projected values so we can use I1 to represent both of them and P (I1C2 ,C5 ) = 2/5. Metrics: We now describe the two measures expected precision and expected recall for query forms. Definition 2: Given a set of projection attributes A and a universe of selection expressions σ, the expected precision and expected recall of a query form F =(AF , RF , σF , ◃▹ (RF )) are P recisionE (F ) and RecallE (F )
www.redpel.com +9176205933895 respectively, i.e.,
∑ d∈DAF
∑
P recisionE (F ) = ∑ RecallE (F ) =
d∈DAF
Pu (dAF )P (dAF )P (σF |d)N
d∈DAF
P (dAF )P (σF |d)N
Pu (dAF )P (dAF )P (σF |d)N
,
(1)
, (2) where AF ⊆ A, σF ∈ σ, and α is the ∑ fraction of instances desired by the user, i.e., α = d∈D Pu (d)P (d). The numerators of both equations represent the expected number of data instances in the query result that are desired by the user. In the query result, each data instance is projected to attributes in AF . So Pu (dAF ) represents the user interest on instance d in the query result. P (dAF )N is the expected number of rows in D that the projected instance dAF represents. Further, given a data instance d ∈ D, d being desired by the user and d satisfying σF are independent. Therefore, the product of Pu (dAF ) and P (σF |d) can be interpreted as the probability of d being desired by the user and meanwhile d being returned in the query result. Summing up over all data instances gives the expected number of data instance in the query result being desired by the user. Similarly, the denominator of Eq.(1) is simply the number of instances in the query result. The denominator of Eq.(2) is the expected number of instances desired by the user in the whole database. In both equations N cancels out so we do not need to consider N when estimating precision and recall. The probabilities in these equations can be∑ estimated using methods described in Section 5. α = d∈D Pu (d)P (d) is the fraction of instances desired by user. P (d) is given by D. Pu (d) could be estimated by the method described in Section 5.1. For example, suppose in Example 1, after projecting on C2 , C5 , there are only 4 distinct instances I1 , I2 , I3 , and I5 (I4 has the same projected values as I1 ). The probability of these projected instances are 0.4, 0.2, 0.2, and 0.2, respectively. Suppose Pu for I2 and I3 are 0.9 and Pu for I1 and I5 are 0.03. The expected precision equals 0.03×0.4+0.9×0.2+0.9×0.2+0 = 0.465. Suppose α = 0.4+0.2+0.2+0 0.4, then the expected recall equals (0.03 × 0.4 + 0.9 × 0.2 + 0.9 × 0.2 + 0)/0.4= 0.93. Considering both expected precision and expected recall, we derive the overall performance measure, expected F-Measure as shown in Equation 3. Note that β is a constant parameter to control the preference on expected precision or expected recall. Definition 3: Given a set of projection attributes A and an universe of selection expressions σ, the expected F-Measure of a query form F =(AF , RF , σF , ◃▹ (RF )) is F ScoreE (F ), i.e., αN
F ScoreE (F ) (1 + β 2 ) · P recisionE (F ) · RecallE (F ) . = β 2 · P recisionE (F ) + RecallE (F )
www.redpel.com +917620593389
Problem Definition: In our system, we provide a ranked list of query form components for the user. Problem 1 is the formal statement of the ranking problem. Problem 1: Let the current query form be Fi and the next query form be Fi+1 , construct a ranking of all candidate form components, in descending order of F ScoreE (Fi+1 ), where Fi+1 is the query form of Fi enriched by the corresponding form component. F ScoreE (Fi+1 ) is the estimated goodness of the next query form Fi+1 . Since we aim to maximize the goodness of the next query form, the form components are ranked in descending order of F ScoreE (Fi+1 ). In the next section, we will discuss how to compute the F ScoreE (Fi+1 ) for a specific form component.
5
E STIMATION
OF
R ANKING S CORE
5.1 Ranking Projection Form Components DQF provides a two-level ranked list for projection components. The first level is the ranked list of entities. The second level is the ranked list of attributes in the same entity. We first describe how to rank each entity’s attributes locally, and then describe how to rank entities. 5.1.1 Ranking Attributes Suggesting projection components is actually suggesting attributes for projection. Let the current query form be Fi , the next query form be Fi+1 . Let AFi = {A1 , A2 , ..., Aj }, and AFi+1 = AFi ∪{Aj+1 }, j +1 ≤ |A|. Aj+1 is the projection attribute we want to suggest for the Fi+1 , which maximizes F ScoreE (Fi+1 ). From the Definition 3, we obtain F ScoreE (Fi+1 ) as follows: F ScoreE (Fi+1 ) P recisionE (Fi+1 ) · RecallE (Fi+1 ) =(1 + β 2 ) · 2 β · P recisionE (Fi+1 ) + RecallE (Fi+1 ) ∑ (1 + β 2 ) · d∈DA Pu (dAFi+1 )P (dAFi+1 )P (σFi+1 |d) Fi+1 ∑ = . 2 d∈D P (dAFi+1 )P (σFi+1 |d) + β α (3) Note that adding a projection component Aj+1 does not affect the selection part of Fi . Hence, σFi+1 = σFi and P (σFi+1 |d) = P (σFi |d). Since Fi is already used by the user, we can estimate P (dAFi+1 )P (σFi+1 |d) as follows. For each query submitted for form Fi , we keep the query results including all columns in RF . Clearly, for those instances not in query results their P (σFi+1 |d) = 0 and we do not need to consider them. For each instance d in the query results, we simply count the number of times they appear in the results and P (dAFi+1 )P (σFi+1 |d) equals the occurrence count divided by N .
www.redpel.com +917620593389 Now we only need to estimate Pu (dAFi+1 ). As for the projection components, we have: Pu (dAFi+1 ) =
Pu (dA1 , ..., dAj , dAj+1 )
= Pu (dAj+1 |dAFi )Pu (dAFi ).
(4)
Pu (dAFi ) in Eq.(4) can be estimated by the user’s click-through on results of Fi . The click-through Duf ⊆ D is a set of data instances which are clicked by the user in previous query results. We apply kernel density estimation method to estimate Pu (dAFi ). Each db ∈ Duf represents a Gaussian distribution of the user’s interest. Then, ∑ d(dAFi , xAFi )2 1 1 √ Pu (dAFi ) = ), exp(− |Duf | 2σ 2 2πσ 2 x∈Duf where d(·, ·) denotes the distance between two data instances, σ 2 is the variance of Gaussian models. For numerical data, the Euclidean distance is a conventional choice for distance function. For categorical data, such as string, previous literatures propose several contextbased similarity functions which can be employed for categorical data instances [14] [8]. Pu (dAj+1 |dAFi ) in Eq.(4) is not visible in the runtime data, since dAj+1 has not been used before Fi+1 . We can only estimate it from other data sources. We mainly consider the following two data-driven approaches to estimate the conditional probability Pu (dAj+1 |dAFi ). • Workload-Driven Approach: The conditional probability of Pu (dAj+1 |dAFi ) could be estimated from query results of historic queries. If a lot of users queried attributes AFi and Aj+1 together on instance d, then Pu (dAj+1 |dAFi ) must be high. • Schema-Driven Approach: The database schema implies the relations of the attributes. If two attributes are contained by the same entity, then they are more relevant. Each of the two approaches has its own drawback. The workload-driven approach has the coldstart problem since it needs a large amount of queries. The schema-driven approach is not able to identify the difference of the same entity’s attributes. In our system, we combined the two approaches as follows: Pu (dAj+1 |dAFi ) = (1 − λ)Pb (dAj+1 |dAFi ) + λsim(Aj+1 , AFi ), where Pb (dAj+1 |dAFi ) is the probability estimated from the historic queries, sim(Aj+1 , AFi ) is the similarity between Aj+1 and AFi estimated from the database schema, and λ is a weight parameter in [0, 1]. λ is utilized to balance the workload-driven estimation and schema-driven estimation. Note that ∑ A∈AFi d(Aj+1 , A) , sim(Aj+1 , AFi ) = 1 − |AFi | · dmax where d(Aj+1 , A) is the schema distance between the attribute Aj+1 and A in the schema graph, dmax is the
www.redpel.com +917620593389
6
diameter of the schema graph. The idea of considering a database schema as a graph is initially proposed by [16]. They proposed a PageRank-like algorithm to compute the importance of an attribute in the schema according to the schema graph. In this paper, we utilize the schema graph to compute the relevance of two attributes. A database schema graph is denoted by G = (R, FK, ξ, A), in which R is the set of nodes representing the relations, A is the set of attributes, FK is the set of edges representing the foreign keys, and ξ : A −→ R is an attribute labeling function to indicate which relation contains the attribute. Based on the database schema graph, the schema distance is defined as follows. Definition 4: Schema Distance Given two attributes A1 ,A2 with a database schema graph G=(R,FK,ξ,A), A1 ∈ A, A2 ∈ A, the schema distance between A1 and A2 is d(A1 , A2 ), which is the length of the shortest path between node ξ(A1 ) and node ξ(A2 ). 5.1.2 Ranking Entities The ranking score of an entity is just the averaged F ScoreE (Fi+1 ) of that entity’s attributes. Intuitively, if one entity has many high score attributes, then it should have a higher rank. 5.2 Ranking Selection Form Components The selection attributes must be relevant to the current projected entities, otherwise that selection would be meaningless. Therefore, the system should first find out the relevant attributes for creating the selection components. We first describe how to select relevant attributes and then describe a naive method and a more efficient one-query method to rank selection components. 5.2.1 Relevant Attribute Selection The relevance of attributes in our system is measured based on the database schema as follows. Definition 5: Relevant Attributes Given a database query form F with a schema graph G=(R,FK,ξ,A), the relevant attributes is: Ar (F ) = {A|A ∈ A, ∃Aj ∈ AF , d(A, Aj ) ≤ t}, where t is a user-defined threshold and d(A, Aj ) is the schema distance defined in Definition 4. The choice of t depends on how compact of the schema is designed. For instance, some databases put all attributes of one entity into a relation, then t could be 1. Some databases separate all attributes of one entity into several relations, then t could be greater than 1. Using the depth-first traversing of the database schema graph, Ar (F ) can be obtained in O(|Ar (F )|·t). 5.2.2 Ranking Selection Components For enriching selection form components of a query form, the set of projection components AF is fixed, i.e.,
www.redpel.com +9176205933897 AFi+1 = AFi . Therefore, F ScoreE (Fi+1 ) only depends on σFi+1 . For the simplicity of the user interface, most query forms’ selection components are simple binary relations in the form of “Aj op cj ”, where Aj is an attribute, cj is a constant and op is a relational operator. The op operator could be ‘=’, ‘≥’ ‘≤’ and so on. In each cycle, the system provides a ranked list of such binary relations for users to enrich the selection part. Since the total number of binary relations are so large, we only select the best selection component for each attribute. For attribute As , As ∈ Ar (F ), let σFi+1 = σFi ∪ {s}, s ∈ σ and s contains As . According to the formula of F ScoreE (Fi+1 ), in order to find the s ∈ σ that maximizes the F ScoreE (Fi+1 ), we only need to estimate P (σFi+1 |d) for each data instance d ∈ D. Note that, in our system, σF represents a conjunctive expression, which connects all elemental binary expressions by AND. σFi+1 exists if and only if both σFi and s exist. Hence, σFi+1 ⇔ σFi ∧ s. Then, we have:
every query condition by its own. For this purpose, the algorithm needs to know the values of all selection attributes of D′ . Hence, One-Query adds all the selection attributes into the projections of the query. Algorithm 1 describes the algorithm of the One-Query’s query construction. The function GenerateQuery is to generate the database query based on the given set of projection attributes Aone with selection expression σone . Algorithm 1: QueryConstruction Data: Q = {Q1 , Q2 , ..., } is the set of previous queries executed on Fi . Result: Qone is the query of One-Query begin σone ←− 0 for Q ∈ Q do σone ←− σone ∨ σQ Aone ←− AFi ∪ Ar (Fi ) Qone ←− GenerateQuery(Aone ,σone )
P (σFi+1 |d) = P (σFi , s|d) = P (s|σFi , d)P (σFi |d). (5) P (σFi |d) can be estimated by previous queries executed on query form Fi , which has been discussed in Section 5.1. P (s|σFi , d) is 1 if and only if d satisfies σFi and s, otherwise it is 0. The only problem is to determine the space of s, since we have to enumerate all the s to compute their scores. Note that s is a binary expression in the form of “As ops cs ”, in which As is fixed and given. ops ∈ OP where OP is a finite set of relational operators, {=, ≥, ≤, ...}, and cs belongs to the data domain of As in the database. Therefore, the space of s is a finite set OP × DAs . In order to efficiently estimate the new F Score induced by a query condition s, we propose the One-query method in this paper. The idea of One-query is simple: we sort the values of an attribute in s and incrementally compute the F Score on all possible values for that attribute. To find the best selection component for the next query form, the first step is to query the database to retrieve the data instances. In Section 5.2, Eq. (5) presents P (σFi+1 |d) depends on the previous query conditions σFi . If P (σFi |d) = 0, P (σFi+1 |d) must be 0. Hence, in order to compute the P (σFi+1 |d) for each d ∈ D, we don’t need to retrieve all data instances in the database. What we need is only the set of data instances D′ ⊆ D such that each d ∈ D′ satisfies P (σFi |d) > 0. So the selection of One-Query’s query is the union of query conditions executed in Fi . In addition, One-Query algorithm does not send each query condition s to the database engine to select data instances, which would be a heavy burden for the database engine since the number of query conditions is large. Instead, it retrieves the set of data instances D′ , and checks every data instance with
www.redpel.com +917620593389
When the system receives the result of the query Qone from the database engine, it calls the second algorithm of One-Query to find the best query condition. We first discuss the “≤” condition. The basic idea of this algorithm is based on a simple property. For a specific attribute As with a data instance d, given two conditions: s1 : As ≤ a1 , s2 : As ≤ a2 , and a1 ≤ a2 , if s1 is satisfied, then s2 must be satisfied. Based on this property, we could incrementally compute the FScore of each query condition by scanning one pass of data instances. There are 2 steps to do this. 1) First, we sort the values of As in the order of a1 ≤ a2 ≤ .... ≤ am , where m is the number of As ’s values. Let Daj denote the set of data instances in which As ’s value is equal to aj . 2) Then, we go through every data instance in the order of As ’s value. Let query condition sj = “As ≤ aj ” and its corresponding FScore be f scorej . According to Eq. (3), f scorej can be computed as f scorej = (1 + β 2 ) · nj /dj , ∑ nj = Pu (dAFi )P (dAFi )P (σFi |d)P (si |d), d∈DQone
dj =
∑
P (dAFi )P (σFi |d)P (si |d) + αβ 2 .
d∈DQone
For j > 1, nj and dj can be calculated incremen-
www.redpel.com +917620593389 tally: nj
= nj−1 + ∑ Pu (dAFi )P (dAFi )P (σFi |d)P (sj |d), d∈Daj
dj
= dj−1 +
∑ d∈Daj
Algorithm 2 shows the pseudocode for finding the best “≤” condition. Algorithm 2: FindBestLessEqCondition Data: α is the fraction of instances desired by user, DQone is the query result of Qone , As is the selection attribute. Result: s∗ is the best query condition of As . begin // sort by As into an ordered set Dsorted Dsorted ←− Sort(DQone , As ) s∗ ←− ∅, f score∗ ←− 0 n ←− 0, d ←− αβ 2 for i ← 1 to |Dsorted | do d ←− Dsorted [i] s ←− “As ≤ dAs ” // compute fscore of “As ≤ dAs ” n ←− n + Pu (dAFi )P (dAFi )P (σFi |d)P (s|d) d ←− d + P (dAFi )P (σFi |d)P (s|d) f score ←− (1 + β 2 ) · n/d if f score ≥ f score∗ then s∗ ←− s f score∗ ←− f score
Complexity: As for other query conditions, such as “=”, “≥”, we can also find similar incremental approaches to compute their FScore. They all share the sorting result in the first step. And for the second step, all incremental computations can be merged into one pass of scanning DQone . Therefore, the time complexity of finding the best query condition for an attribute is O(|DQone |·|AFi |). Ranking every attribute’s selection component is O(|DQone | · |AFi | · |Ar (Fi )|). 5.2.3
are constructed by the same attribute. Thus, we only recommend the best selection component for each attribute.
6 P (dAFi )P (σFi |d)P (sj |d).
Diversity of Selection Components
Two selection components may have a lot of overlap (or redundancy). For example, if a user is interested in some customers with age between 30 and 45, then two selection components: “age > 28” and “age > 29” could get similar F Scores and similar sets of data instances. Therefore, there is a redundancy of the two selections. Besides a high precision, we also require the recommended selection components should have a high diversity. diversity is a recent research topic in recommendation systems and web search engines [6] [28]. However, simultaneously maximizing the precision and the diversity is an NP-Hard problem [6]. It cannot be efficiently implemented in an interactive system. In our dynamic query form system, we observe that most redundant selection components
www.redpel.com +917620593389
8
E VALUATION
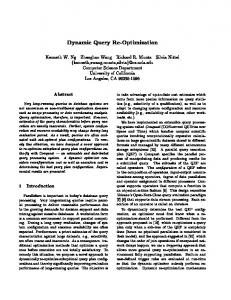
The goal of our evaluation is to verify the following hypotheses: H1: Is DQF more usable than existing approaches such as static query form and customized query form? H2: Is DQF more effective to rank projection and selection components than the baseline method and the random method? H3: Is DQF efficient to rank the recommended query form components in an online user interface? 6.1 System Implementation and Experimental Setup We implemented the dynamic query forms as a webbased system using JDK 1.6 with Java Server Page. The dynamic web interface for the query forms used open-source javascript library jQuery 1.4. We used MySQL 5.1.39 as the database engine. All experiments were run using a machine with Intel Core 2 CPU @2.83GHz, 3.5G main memory, and running on Windows XP SP2. Figure 3 shows a system prototype. Data sets: 3 databases: NBA 1 , Green Car 2 and Geobase 3 were used in our experiments. Table 4 shows a general description of those databases. TABLE 4 Data Description Name NBA Green Car Geobase
#Relations 10 1 9
#Attribute 180 17 32
#Instances 44,590 2,187 1,329
Form Generation Approaches: We compared three approaches to generate query forms: • DQF: The dynamic query form system proposed in this paper. • SQF: The static query form generation approach proposed in [18]. It also uses query workload. Queries in the workload are first divided into clusters. Each cluster is converted into a query form. • CQF: The customized query form generation used by many existing database clients, such as Microsoft Access, EasyQuery, ActiveQueryBuilder. User Study Setup: We conducted a user study to evaluate the usability of our approach. We recruited 20 1. http://www.databasebasketball.com 2. http://www.epa.gov/greenvehicles 3. Geobase is a database of geographic information about the USA, which is used in [16]
www.redpel.com +917620593389 9
Fig. 3. Screenshot of Web-based Dynamic Query Form
participants of graduate students, UI designers, and software engineers. The system prototype is shown by Figure 3. The user study contains 2 phases, a query collection phase and a testing phase. In the collection phase, each participant used our system to submit some queries and we collected these queries. There were 75 queries collected for NBA, 68 queries collected for Green Car, and 132 queries for Geobase. These queries were used as query workload to train our system (see Section 5.1). In the second phase, we asked each participant to complete 12 tasks (none of these tasks appeared in the workload) listed in Table 5. Each participant used all three form generation approaches to form queries. The order of the three approaches were randomized to remove bias. We set parameter λ = 0.001 in our experiments because our databases collect a certain amount of historic queries so that we mainly consider the probability estimated from the historic queries. Simulation Study Setup: We also used the collected queries in a larger scale simulation study. We used a cross-validation approach which partitions queries into a training set (used as workload information) and a testing set. We then reported the average performance for testing sets. 6.2 User Study Results Usability Metrics: In this paper, we employ some widely used metrics in Human-Computer Interaction and Software Quality for measuring the usability of a system [31], [27]. These metrics are listed in Table 7.
www.redpel.com +917620593389
TABLE 7 Usability Metrics Metric ACmin AC ACratio F Nmax FN F Nratio Success
Definition The minimal number of action for users The actual number of action performed by users ACmin /AC × 100.0% The total number of provided UI function for users to choose The number of actual used UI function by the user F N/F Nmax × 100% The percentage of users successfully completed a specific task
In database query forms, one action means a mouse click or a keyboard input for a textbox. ACmin is the minimal number of actions for a querying task. One function means a provided option for the user to use, such as a query form or a form component. In a web page based system, F Nmax is the total number of UI components in web pages explored by the user. In this user study, each page at most contains 5 UI components. The smaller ACmin , AC, F Nmax , and F N , the better the usability. Similarly, the higher the ACratio , F Nratio , and Success, the better the usability. There is a trade-off between ACmin and F Nmax . An extreme case is that, we generate all possible query forms in one web page, the user only needs to choose one query form to finish his(or her) query task, so ACmin is 1. However, F Nmax would be the number
www.redpel.com +917620593389
10
TABLE 5 Query Tasks Task T1 T2 T4 T5 T6 T7 T8 T9 T10 T11 T12
SQL SELECT ilkid, firstname, lastname FROM players SELECT p.ilkid, p.firstname, p.lastname FROM players p, player_playoffs_career c WHERE p.ilkid = c.ilkid AND c.minutes > 5000 SELECT t.team, t.location, c.firstname, c.lastname, c.year FROM teams t, coaches c WHERE t.team=c.team AND t.location = ‘Los Angeles’ SELECT Models, Hwy_MPG FROM cars WHERE City_MPG > 20 SELECT Models, Displ, Fuel FROM cars WHERE Sales_Area = ‘CA’ SELECT Models, Displ FROM cars WHERE Veh_Class = ‘SUV’ SELECT Models FROM cars WHERE Drive = ‘4WD’ SELECT t0.population FROM city t0 WHERE t0.state = ’california’ SELECT t1.state, t0.area FROM state t0, border t1 WHERE t1.name = ’wisconsin’ and t0.area > ’80000’ and t0.name = t1.name SELECT t0.name, t0.length FROM river t0 WHERE t0.state = ’illinois’ SELECT t0.name, t0.elevation, t0.state FROM mountain t0 WHERE t0.elevation > ’5000’
of all possible query forms with their components, which is a huge number. On the other hand, if users have to interact a lot with a system, that system would know better about the user’s desire. In that case, the system would cut down many unnecessary functions, so that F Nmax could be smaller. But ACmin would be higher since there are a lot of user interactions. User Study Analysis: Table 6 shows the average result of the usability experiments for those query tasks. As for SQF, we generated 10 static query forms based on the collected user queries for each database (i.e., 10 clusters were generated on the query workload). The results show that users did not accomplish querying tasks by SQF. The reason is that, SQF is built from the query workload and may not be able to answer ad hoc queries in the query tasks. E.g., SQF does not contain any relevant attributes for query task T3 and T11, so users failed to accomplish the queries by SQF. TABLE 8 Statistical Test on F Nmax ( with CQF) Task P Value
T1 0.0106
T4