mance Variability, Interactive Multi-tier Applications, Geo- distribution. I. INTRODUCTION. CLOUD computing promises to
2722
IEEE JOURNAL ON SELECTED AREAS IN COMMUNICATIONS, VOL. 31, NO. 12, DECEMBER 2013
Dynamic Request Splitting for Interactive Cloud Applications Mohammad Hajjat, Shankaranarayanan P N, David Maltz, Sanjay Rao, and Kunwadee Sripanidkulchai
Abstract—Deploying interactive applications in the cloud is a challenge due to the high variability in performance of cloud services. In this paper, we present Dealer– a system that helps geo-distributed, interactive and multi-tier applications meet their stringent requirements on response time despite such variability. Our approach is motivated by the fact that, at any time, only a small number of application components of large multi-tier applications experience poor performance. Dealer continually monitors the performance of individual components and communication latencies between them to build a global view of the application. In serving any given request, Dealer seeks to minimize user response times by picking the best combination of replicas (potentially located across different data-centers). While Dealer requires modifications to application code, we show the changes required are modest. Our evaluations on two multi-tier applications using real cloud deployments indicate the 90%ile of response times could be reduced by more than a factor of 6 under natural cloud dynamics. Our results indicate the cost of inter-data-center traffic with Dealer is minor, and that Dealer can in fact be used to reduce the overall operational costs of applications by up to 15% by leveraging the difference in billing plans of cloud instances. Index Terms—Request Splitting, Cloud Computing, Performance Variability, Interactive Multi-tier Applications, Geodistribution.
I. I NTRODUCTION LOUD computing promises to reduce the cost of IT organizations by allowing them to purchase as much resources as needed, only when needed, and through lower capital and operational expense stemming from the cloud’s economies of scale. Further, moving to the cloud greatly facilitates the deployment of applications across multiple geographically distributed data-centers. Geo-distributing applications, in turn, facilitates service resilience and disaster recovery, and could enable better user experience by having customers directed to data-centers close to them. While these advantages of cloud computing are triggering much interest among developers and IT managers [23], [42], a key challenge is meeting the stringent Service Level Agreement (SLA) requirements on availability and response times for interactive applications (e.g. customer facing web applications, enterprise applications). Application latencies directly impact business revenue [10], [15]– e.g., Amazon found every 100ms of latency costs 1% in sales [10]. Further, the SLAs typically require bounds on the 90th (and higher) percentile latencies [13], [31].
C
Manuscript received December 15, 2012; revised July 4, 2013. M. Hajjat, S. P N, and S. Rao are with Purdue University. D. Maltz is with Microsoft. K. Sripanidkulchai is with NECTEC Thailand. Digital Object Identifier 10.1109/JSAC.2013.131212.
Meeting such stringent SLA requirements is a challenge given outages in cloud data-centers [2], [11], and the high variability in the performance of cloud services [25], [35], [46], [50]. This variability arises from a variety of factors such as the sharing of cloud services across a large number of tenants, and limitations in virtualization techniques [46]. For example, [35] showed that the 95%ile latencies of cloud storage services such as tables and queues is 100% more than the median values for four different public cloud offerings. In this paper, we argue that it is critically important to design applications to be intrinsically resilient to cloud performance variations. Our work, which we term Dealer, is set in the context of geo-distributed, multi-tier applications, where each component may have replicas in multiple data-centers. Dealer enables applications to meet their stringent SLA requirements on response times by finding the combination of replicas –potentially located across multiple data-centers– that should be used to serve any given request. This is motivated by the fact that only a small number of application components of large multi-tier applications experience poor performance at any time. Multi-tier applications consist of potentially large number of components with complex inter-dependencies and hundreds of different request types all involving different subsets of components [29]. Dealer dynamically learns a model of the application that captures component interaction patterns. Application structure is abstracted as a component graph, with nodes being application components and edges capturing inter-component communication patterns. To predict which combination of replicas can result in the best performance, Dealer continually monitors the performance of individual component replicas and communication latencies between replica pairs. Operating at a component-level granularity offers Dealer several advantages over conventional approaches that merely pick an appropriate data-center to serve user requests [27], [37], [41], [47]. Modern web applications consist of many components, not all of which are present in each data-center, and the costs are extremely high to over-provision each component in every data-center to be able to handle all the traffic from another data-center. Dealer is able to redistribute work away from poorly performing components by utilizing the capacity of all component replicas that can usefully contribute to reducing the latency of requests. In large multi-tier applications (with potentially hundreds of components), it is possible that only a small number of components are temporarily impacted. Hence, redirecting entire user requests to a remote data-center leaves local
c 2013 IEEE 0733-8716/13/$31.00 �
HAJJAT et al.: DYNAMIC REQUEST SPLITTING FOR INTERACTIVE CLOUD APPLICATIONS
Front end
Business Service
Download(2)
Download(1)
BL−BE(2)
BL−BE(1)
BL1(2)
BL1(1)
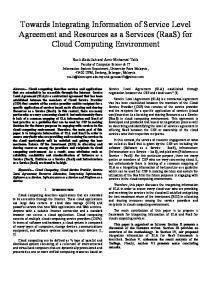
(a) Thumbnails application architecture and data-flow. The application is composed of a Front-End (FE), Back-End (BE), and two Business-Logic components BL1 (creates thumbnail) and BL2 (creates Gray-scale, rotating images).
0 BE−BL(2)
Role
5000
BE−BL(1)
Queue
FE−BE(2)
BL2 Work orker erRol Worker Role e
10000
FE−BE(1)
BL1
Upload(2)
blob
15000
Upload(1)
Role
TotalTime(2)
BE
blob
20000
Work orker erRol Worker Role e
TotalTime(1)
Load Balancer
Queue eb II Ro RoWeb II le IIS le Role SS
Delay (in msec)
FE
2723
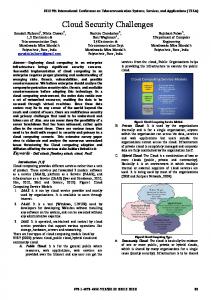
Fig. 2. Box plot for total response time, and contributing processing and communication delays for Thumbnail application.
Users Configuration Service
DB
Order Service
(b) StockTrader architecture and data-
flow. Components include a front-end (FE), Business Server (BS), Order Service (OS) (handles buys/sells), Database (DB), and a Config Service (CS) that binds all components. The precise dataflow depends on request type. Fig. 1. Applications Testbed.
functional components (already paid for) unutilized. Such money waste can be alleviated using Dealer which splits requests dynamically across replicas in remote data-centers while utilizing functional local resources to the extent possible. Additionally, in application deployments which use instances with different pricing plans (e.g., on-demand and long-term reserved instances), Dealer can utilize the difference in pricing options to even achieve more cost savings. This is because Dealer has the potential of allowing applications to use more instances with cheaper pricing plans across all remote datacenters before requiring the start of the more expensive cloud instances locally. While much of the Dealer design is independent of the particular application, integrating Dealer does require customization using application-specific logic. First, stateful applications have constraints on which component replicas can handle a given request. While Dealer proposes desired split ratios (or probabilities with which a request must be forwarded to different downstream component replicas), the application uses its own logic to determine which component replicas can handle a given request. Further, application developers must properly instrument their applications to collect the percomponent performance data needed for Dealer. However, in our experience, the work required by application developers is modest. We have evaluated Dealer on two stateful multi-tier applications on Azure cloud deployments. The first application is data-intensive, while the second application involves interactive request processing. Under natural cloud dynamics,
using Dealer improves application performance by a factor of 3 for the 90th and higher delay percentiles, compared to DNS-based data-center-level redirection schemes which are agnostic of application structure. Overall, the results indicate the importance and feasibility of Dealer. II. P ERFORMANCE AND W ORKLOAD VARIABILITY In this section, we present observations that motivate Dealer’s design. In §II-A, we characterize the extent and nature of the variability in performance that may be present in cloud data-centers. Our characterization is based on our experiences running multi-tier applications on the cloud. Then, in §II-B, we characterize the variability in workloads of multitier applications based on analyzing web server traces of a large campus university. A. Performance variability in the cloud We measure the performance variability with two applications. The first application, Thumbnail [20] involves users uploading a picture to the server (FE) and getting back either a thumbnail (from BL1) or a rotated image (from BL2). The second application, StockTrader [3], is an enterprise web application that allows users to buy/sell stocks, view portfolio, etc. Figure 1(a) and Figure 1(b) respectively show the component architecture and data-flow for each application. We ran each application independently in two separate data-centers (DC1 and DC2), both located in the U.S. Each application deployment was subjected to the same workload simultaneously, without using any load-balancing or redirection techniques across data-centers to eliminate dependency between them. Also, we note that all application components were over-provisioned properly to ensure we capture performance variability intrinsic to the cloud, rather than studying variability that may arise due to workload fluctuations. More details of how we configured the deployments are presented in §V-A. We instrumented each application to measure the total response time, as well as the delays contributing to total response time. The contributing delays include processing delays encountered at individual application components, communication delay between components (internal data-center communication delays), and the upload/download
2724
IEEE JOURNAL ON SELECTED AREAS IN COMMUNICATIONS, VOL. 31, NO. 12, DECEMBER 2013
FE
FE DB BS 1 -0.08 -0.11 DB 1 0.5 BS 1 OS
a) StockTrader
FE-BE
OS -0.04 0.03 0.14 1 FE-BS
FE-BS -0.31 -0.01 0.08 -0.37 1 FE-CS
FE-CS 0.03 -0.01 -0.02 -0.03 0.01 1 BS-CS
BS-CS -0.32 0.04 0.09 -0.4 0.87 -0.01 1 BS-OS
BS-OS -0.07 0.05 0.14 0.66 -0.31 -0.02 -0.34 1 OS-CS
OS-CS -0.04 0.02 0.14 0.74 -0.37 -0.03 -0.41 0.71 1
FE-BE BL BL-BE BE-BL 1 0.49 -0.03 0.08 BL 1 0.03 0.08 BL-BE 1 0.02 BE-BL 1
b) Thumbnail
Fig. 3. Performance correlation across components of the same application in the same data-center.
delays (Internet communication delays between users and each data-center). We now present our key findings: All application components show performance variability: Figure 2 considers the Thumbnail application and presents a box plot for the total response time (first two) and each of the individual contributing delays for each data-center. The Xaxis is annotated with the component or link whose delay is being measured and the number in parenthesis represents the data-center to which it belongs (DC1 or DC2). For example, BL-BE(1) represents the delay between the Business-Logic (BL) and the Back-End (BE) instances, at DC1. The bottom and top of each box represent the 25th and 75th percentiles, and the line in the middle represents the median. The vertical line (whiskers) extends to the highest data points within 3 × w of the upper quartile, where w is defined as the difference between the 75th and 25th percentiles. Points larger than this value are considered outliers and shown separately. Several interesting observations are shown in Figure 2. First, there is significant variability in all delay values. For instance, while the 75%ile of total response time is under 5 seconds, the outliers are almost 20 seconds. Second, while the median delay with DC1 is smaller than DC2, DC1 shows significantly more variability. Third, while the Internet upload delays are a significant portion of total response time (since the application involves uploading large images), the processing delays at BL, and the communication delays between the BE and BL show high variability, and contribute significantly to total response times. Our experiments indicate that the performance of the application components vary significantly with time, and is not always correlated with the performance of their replicas in other data-centers. Not all components in a single data-center may see poor performance simultaneously: Public clouds are highly shared platforms. In a single data-center, performance problems may impact some cloud services but not others. Such heterogeneity in performance may happen due to many factors such as multi-tenancy, software bugs, scheduled upgrades, maintenance operations, failures, etc. For example, [18] reports that a service disruption impacted only a subset of customers inside
TABLE I C ROSS - CORRELATION OF EACH COMPONENT ’ S PROCESSING TIME AND INTER - COMPONENT COMMUNICATION DELAY ACROSS TWO DATA - CENTERS , FOR Thumbnail AND StockTrader APPLICATIONS .
Response 0.09
FE-BE 0.04
Thumbnail BL 0.06
BE-BL 0.03
BL-BE 0.02
Response 0.04
FE 0.27
StockTrader BS -0.01
OS -0.02
DB 0.01
FE-BS 0.33
FE-CS 0.01
BS-OS -0.01
OS-CS -0.03
BS-CS 0.27
a data-center. It also reports that only compute services were impacted and that other resources such as storage services were performing normally in the same data-center. Figure 3 studies the cross-correlation coefficients across all combinations of total response time and constituent delays (i.e., component processing time and inter-component communication delay) for each application, in a single data-center. The tables show that while some constituent delays show some correlation in performance due to inter-component dependency (e.g., OS and BS-OS in StockTrader), we also find that many constituent delays show weak correlation. Moreover, we also investigated the periods of poor performance for both Thumbnail and StockTrader. In general, we observed that only a subset of constituent delays contribute to poor performance at any given time. Performance problems intrinsic to the cloud may impact replicas differently across data-centers: We now investigate the degree of correlation between replicas of the same component across multiple data-centers. We note that we study correlations in the absence of load-balancing techniques since our focus is on studying variability intrinsic to the cloud, rather than workload induced variability. For total response time and every contributing delay, the average value in every 30 seconds window is computed and cross-correlated with the value in the other data-center. Table I shows the correlation coefficients for each processing and communication delay across two data-centers, for all applications. The table shows that all delays show low correlation across data-centers. More generally, there have been several real world incidents where specific cloud services (e.g., storage service) have experienced performance degradation or failure in some data-centers but not others [2], [11], [18], [30]. This is due to many factors (such as power outages, software upgrades, maintenance operations, multitenancy effects, etc.) that impact data-centers differently. B. Workload Dynamics We now show the nature and extent of short-term variability in workload for multi-tier applications and the implications on cloud deployments. Short-term variability necessitates large margins even in cloud deployments: While cloud computing allows for dynamic invocation of resources during peak periods, starting up new server instances takes several minutes (typically 10 minutes) in many commercial cloud deployments today.
HAJJAT et al.: DYNAMIC REQUEST SPLITTING FOR INTERACTIVE CLOUD APPLICATIONS
5
Component 1 4
3 2 1 0 0
5
10
15
Day 5
Component 2 4
3 2 1 0 0
5
10
15
Day
Fig. 4. Short-term variability in workload for three components in a multi-tier web-service deployed in a large campus network. The peak and average rates are computed during each 10 minutes window and the peak-to-average ratio over each window is plotted as a function of time.
Further, besides the time to provision new instances, it may take even longer to warm up a booted server; e.g., by filling its cache with relevant data to meet its SLA. Therefore, applications typically maintain margins (i.e., pools of servers beyond the expected load [22], [32], [44]) to handle fluctuations in workload. To examine workload variability and margin requirements for multi-tier applications, we collect and study the workload of a web-service in a large campus network. In the service, all requests enter through a front-end, which are then directed to different downstream components based on the type of request (e.g., web, mail, department1, department2, etc.) Figure 4 illustrates the variability in workload for the front-end and two downstream components. While the peakto-average ratio is around 1.5 for the front-end, it is much higher for each of the other components, and can be as high as 3 or more during some time periods. The figure indicates that a significant margin may be needed even in cloud deployments to handle shorter-term workload fluctuations. Margin requirements are variable and heterogeneous
2725
across different tiers of multi-tier applications: Figure 4 also shows that different application tiers may require different margins. While the margin requirement is about 50% for the front-end, it is over 300% for the other components during some time periods. In addition, the figure also illustrates that the exact margin required even for the same component is highly variable over time. The high degree of variability and heterogeneity in margins make it difficult to simply overprovision an application component on the cloud since it is complicated to exactly estimate the extent of over-provisioning required, and over-provisioning for the worst-case scenario could be expensive. Moreover, failures and regular data-center maintenance actions make the application work with lower margins and render the application vulnerable to even modest workload spikes. Workload peaks happen at different times across different tiers of multi-tier applications: We study the correlation across workload peaks seen by the different components of an application. For that, we measure the correlation coefficient between the traffic of Component1 and Component2 (Figure 4). We found out that the correlation coefficient for the two components is 0.092, which indicates the traffic patterns of the two components are not correlated and that traffic peaks happen at different times. This may limit the effectiveness of load-balancing techniques from utilizing idle resources in multi-tier applications, as we shall discuss in §V. III. Dealer D ESIGN R ATIONALE In this section, we present the motivation behind Dealer’s design, and argue why traditional approaches don’t suffice. Dealer is designed to enable applications meet their SLA requirements despite performance variations of cloud services. Dealer is motivated by two observations: (i) in any data-center, only instances corresponding to a small number of application components see poor performance at any given time; and (ii) the latencies seen by instances of the same component located in different data-centers are often uncorrelated. Dealer’s main goal is to dynamically identify a replica of each component that can best serve a given request. Dealer may choose instances located in different data-centers for different components, offering a rich set of possible choices. In doing so, Dealer considers performance and loads of individual replicas, as well as intra- and inter-data-center communication latencies. Dealer is distinguished from DNS-based [27], [41], [47] and server-side [37] redirection mechanisms, which are widely used to map users to appropriate data-centers. Such techniques focus on alleviating performance problems related to Internet congestion between users and data-centers, or coarse-grained load-balancing at the granularity of data-centers. Dealer is complementary and targets performance problems of individual cloud services inside a data-center. There are several advantages associated with the Dealer approach: • Exploit heterogeneity in margins across different components: In large multi-tier applications with potentially hundreds of components [29], only a few services might be temporarily impacted in any given data-center. Dealer can reassign work related to these services to other replicas in remote data-centers if they have sufficient margins. For instance,
2726
IEEE JOURNAL ON SELECTED AREAS IN COMMUNICATIONS, VOL. 31, NO. 12, DECEMBER 2013
C1
GTM Systems
U1
C2 Ci
Cj
DC1
... . . .
C1
U2
C2 Cj DCk Ci . . . . . .
Uk
C1
. . .
C2 Cj DCm Ci . . . TFim,jn
C1 C2
Ci
Un
Dealer
Cj
. . .
DCn
...
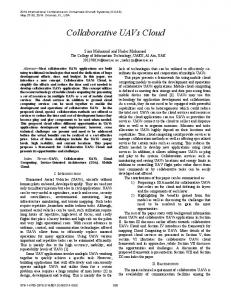
Fig. 5. System overview
Dealer could tackle performance problems with storage elements (e.g., a blob) by using a replica in a remote data-center, while leveraging compute instances locally. Complete request redirection, however, may not be feasible since instances of other components (e.g., business-logic servers) in the remote data-center may not be over-provisioned adequately over their normal load to handle the redirected requests. In fact, Figure 4 shows significant variation in workload patterns of individual components of multi-tier applications, indicating the components must be provisioned in a heterogeneous fashion. • Utilize functional cloud services in each data-center: Dealer enables applications to utilize cloud services that are functioning satisfactorily in all data-centers, while only avoiding services that are performing poorly. In contrast, techniques that redirect entire requests fail to utilize functional cloud services in a data-center merely due to performance problems associated with a small number of other services. Further, the application may be charged for the unutilized services (for example, they may correspond to already pre-paid reserved compute instances [1]). While Dealer does incur additional inter data-center communication cost, our evaluations in §VI-A indicate these costs are small. • Responsiveness: Studies have shown that DNS-based redirection techniques may have latencies of over 2 hours and may not be well suited for applications which require quick response to link failures or performance degradations [36]. In contrast, Dealer targets adaptations over the time-scale of tens of seconds. IV. S YSTEM D ESIGN In this section we present the design of Dealer. We begin by presenting an overview of the design, and then discuss its various components. Table II describes the summary of notations used throughout the paper. A. System Overview Figure 5 describes the high level design of our system for an application with multiple components {C1 , C2 , ..}. We consider a multi-cloud deployment where the application is deployed across n data-centers, with instances corresponding to each component located in every one of the data-centers. Note that there might be components like databases which are
only present in one or a subset of data-centers. We represent the replica of component Ci in data-center m as Cim . Traffic from users is mapped to each data-center using standard mapping services used today based on metrics such as geographical proximity or latencies [41]. Let Uk denote the set of users whose traffic is mapped to data-center k. Traffic corresponding to Uk can use the entire available capacity of all components in data-center k, as well as the excess capacity of components in all other data-centers. For each user group Uk , Dealer seeks to determine how application requests must be split in the multi-cloud deployment. In particular, the goal is to determine the number of user requests that must be directed between component i in data-center m to component j in data-center n, for every pair of combinations. In doing so, the objective is to ensure the overall delay of requests can be minimized. Further, Dealer periodically recomputes how application requests must be split given dynamics in behavior of cloud services. Complex multi-tier applications may have hundreds of different request types all involving different subsets of application components. The design of techniques for determining the exact paths of all requests remains an active area of research despite many notable recent advances [33], [38], [43]. Dealer does not require such knowledge, and instead, it dynamically learns a model of the application that captures component interaction patterns. In particular, Dealer estimates the fraction of requests that involve communication between each pair of application components, and the average size of requests between each component pair. In addition, Dealer estimates the processing delays of individual components replicas, and communication delays between components, as well as the available capacity of component replicas in each data-center (i.e., the load each replica can handle). We will discuss how all this information is estimated and dynamically updated in the later subsections.
B. Determining delays There are three key components to the estimation algorithms used by Dealer when determining the processing delay of components and communication delays between them. These include: (i) passive monitoring of components and links over which application requests are routed; (ii) heuristics for smoothing and combining multiple estimates of delay for a link or component; and (iii) active probing of links and components which are not being utilized to estimate the delays that may be incurred if they were used. We describe each of these in turn: Monitoring: Monitoring distributed applications is a well studied area, and a wide range of techniques have been developed by the research community and industry [8], [24], [28] that can be used for measuring application performance. Of these techniques, X-Trace [28] is the most suitable for our purposes, since it can track application performance at the granularity of individual requests. However, integrating the monitoring code with the application is a manual and time consuming process. To facilitate easy integration of XTrace with the application, we automate a large part of the
HAJJAT et al.: DYNAMIC REQUEST SPLITTING FOR INTERACTIVE CLOUD APPLICATIONS
TABLE II N OTATION TABLE . Uk Ci Cim W
Set of users whose traffic is mapped to data-center k. Application component i. Replica of component i in data-center m. Number of windows used for calculating the weighted moving average (WMA). D im,jn (t) Measured Delay matrix at time t. If i �= j, the delay represents the communication delay from Cim to Cjn . When i = j (m must be equal to n), the delay represents the processing delay of Cim . Dim,jn (t) Smoothed Delay matrix at time t. Each delay value is com¯ matrix puted by combining the most recent W values of D using WMA. Nim,jn (t) Number of delay samples obtained in window t for requests from Cim to Cjn (if i = j, then m = n must hold). T Fim,jn Split Ratio matrix; number of user requests that must be directed from Cim to Cjn . DR(i, t) Damping Ratio; upper bound of fraction of requests that needs to be assigned to combination i at time t. Rank(i, t) Ranking of combination i at the end of time-window t with respect to other combinations. The combination with lowest mean delay value gets a ranking of 1, and the best combination gets assigned the highest possible ranking. Req(i, t) Number of requests sent on combination i during time t.
integration effort using Aspect Oriented Programming (AOP) techniques [5]. We write an Aspect to intercept each function when it is called and after it returns, which constitutes the pointcuts. We record the respective times inside the Aspect. The measured delay values are then reported periodically to a central monitor. A smaller reporting time ensures greater agility of Dealer. We use reporting times of 10 seconds in our implementation, which we believe is reasonable. Smoothing delay estimates: It is important to trade-off the agility in responding to performance dips in components or links with potential instability that might arise if the system is overly aggressive. To achieve that, we apply smoothing on the delay estimates collected. While several techniques exist, we use the linearly weighted moving average (WMA) for its simplicity and suitability. For each link and component, the average delay and number of delay samples seen during the last W time windows of observation is considered. Then, the smoothed delay matrix is calculated as follows: Dim,jn (t) �t =
τ =t−W +1 D im,jn (τ ) ∗ (W + τ �t τ =t−W +1 (W + τ − t) ∗
− t) ∗ Nim,jn (τ ) Nim,jn (τ )
(1)
Briefly, the weight depends on the number of samples seen during a time-window, and the recency of the estimate. As Table II shows, Dim,jn (t) represents the smoothed delay matrix calculated using WMA at time-window t, Dim,jn (t) captures the measured delay matrix, and Nim,jn (t) is the number of delay samples obtained in that window. The term (W+τ -t) is a linearly increasing function that assigns higher weights to more recent time-windows (the oldest time-window gets a weight of 1, and the most recent window gets a weight of W at time t). Moreover, since request rates may fluctuate greatly (with some time-windows potentially having no or only a few delay samples with possible outliers), we also incorporate Nim,jn (t) into WMA. This gives a higher
2727
weight for representative time-windows with more requests. The use of WMA ensures that Dealer reacts to prolonged performance episodes that last several seconds, while not aggressively reacting to extremely short-lived problems within a window. W determines the number of windows for which a link/component must perform poorly (well) for it to be avoided (reused). Our empirical experience has shown choosing W values between 3 and 5 are most effective for good performance. Probing: Dealer uses active probes to estimate the performance of components and links that are not currently being used. This enables Dealer to decide if it should switch requests to a replica of a component in a different data-center, and determine which replica must be chosen. Probe traffic is generated by test-clients using application workload generators (e.g., [9]). We restrict active probes to read-only requests that do not cause changes in persistent application state. While this may not accurately capture the delays for requests involving writes, we have found the probing scheme to work well for the applications we experiment with. We also note that many applications tend to be read-heavy and it is often more critical to optimize latencies of requests involving reads. To bound probes’ overhead, we limit the probe rate to 10% of the application traffic rate. Moreover, since a path that has generally been good might temporarily suffer poor performance, Dealer biases the probes based on the quality of the path [30]. Biasing the probing ensures that such a path is likely to be probed more frequently, which ensures Dealer can quickly switch back to it when its performance improves. We note the probing overhead may be restricted by combining estimates obtained by (i) using passive user-generated traffic to update component processing delays and intercomponent link latencies; and (ii) limiting active probes to measuring inter-data-center latency and bandwidth only. Further, rather than having each application measure the bandwidth and latency between every pair of data-centers, cloud providers could provide such services in the future, amortizing the overheads across all applications. C. Determining request split ratios In this section, we discuss how Dealer uses the processing delays of components and communication times of links to compute the split ratio matrix TF. Here, T Fim,jn is the number of user requests that must be directed between component i in data-center m to component j in data-center n, for every pair. In determining the split ratio matrix, Dealer considers several factors including i) the total response time; ii) stability of the overall system; and iii) capacity constraints of application components. In our discussion, a combination refers to an assignment of each component to exactly one data-center. For instance, in Figure 5, a mapping of C1 to DC1 , C2 to DCk , Ci to DCm and Cj to DCm represents a combination. The algorithm iteratively assigns a fraction of requests to each combination. The TF matrix is easily computed once the fraction of requests assigned to each combination is determined. We now present the details of the algorithm. Considering total response time: Dealer computes the mean delay for each possible combination as the weighted sum
2728
IEEE JOURNAL ON SELECTED AREAS IN COMMUNICATIONS, VOL. 31, NO. 12, DECEMBER 2013
Algorithm 1 Determining request split ratios. 1: procedure C OMPUTE S PLIT R ATIO () 2: 3: 4: 5: 6:
7: 8: 9: 10: 11: 12: 13: 14: 15: 16: 17: 18: 19:
Let ACim be the available-capacity matrix for Cim , initialized as described in §IV-D Let Tij be the requests matrix, indicating the number of requests per second between application components i and j � Let Ti = j Tji ; i.e., the load on Ci Let FA be fraction of requests that has been assigned to combinations, initialized as F A ← 0 Let L be a combination of components (described in IV-C), where component Ci is assigned to data-center d(i) (i.e., replica Ci,d(i) ) Goal: Find T Fim,jn : the number of requests that must be directed between Cim and Cjn Foreach combination L, sorted by mean delay values For each Cim in L im fi ← AC Ti minf ← min∀i (fi ) ratio = min(minf , DR(L, t)) Rescale damping ratios if necessary For each Cim in L ACim ← ACim − ratio ∗ Ti T Fid(i),jd(j) ← T Fid(i),jd(j) + ratio ∗ Tij , ∀i, j F A ← F A + ratio Repeat until FA = 1 end procedure
of the processing delays of nodes and communication delay of links associated with that combination. The weights are determined by the fraction of user requests that traverse that node or link [30]. Once the delays of combinations are determined, Dealer sorts the combinations in ascending order of mean delay such that the best combinations get utilized the most, thereby ensuring a better performance. Ensuring system stability: To ensure stability of the system and prevent oscillations, Dealer avoids abrupt changes in the split ratio matrix in response to minor performance changes. To achieve this, Dealer gradually increases the portion of requests assigned to a given combination, and limits the maximum fraction of requests that may be assigned to it. The limit (which we refer to as the damping ratio) is based on how well that combination has performed relative to others, and how much traffic was assigned to that combination in the recent past. In particular, the damping ratio (DR) for combination i is calculated periodically as follows: eight(i,t) DR(i, t) = �WW eight(j,t) , where j (2) � t W eight(i, t) = τ =t−W +1 Rank(i, τ ) ∗ Req(i, τ ) Here, Rank(i, t) refers to the ranking of combination i, and Req(i, t) describes the number of requests served by i at time-window t, as shown in Table II. The idea behind using Rank(i, t) is to give more weight for better combinations. Further, to achieve stability when assigning requests to combinations, we also use Req(i, t) to gradually increase the number of requests a good combination is allowed to have. The algorithm computes the weight of a combination based on its rank and the requests assigned to it in each of the last W windows. Similar to §IV-B, we found that W values between 3 and 5 results in the best performance. Honoring capacity constraints: In assigning requests to a combination of application components, Dealer ensures the capacity constraints of each of the components is honored as
Algorithm 2 Dynamic capacity estimation. 1: procedure C OMPUTE T HRESH (T, D)
2: if D > 1.1 ∗ DelayAtT hresh then 3: if T