Dynamics of concurrent software development Hazhir Rahmandada* and David M. Weissb
Hazhir Rahmandad is assistant professor of Industrial and Systems Engineering at Virginia Tech. He received his Ph.D. in system dynamics from the Massachusetts Institute of Technology (2005) and his undergraduate degree in Industrial Engineering from Sharif University of Technology, Iran. Hazhir’s research interests include understanding the evolution of product development capability, systems engineering dynamics, organizational learning and change, making strategy happen, comparing different simulation methods, and model estimation methodologies. David M. Weiss received his Ph.D. in Computer Science in 1981 from the University of Maryland. He is currently the head of the Software Technology Research Department at Avaya Laboratories. He is also a senior member of the IEEE and has served as associate editor-in-chief of IEEE Transactions on
Abstract In a concurrent development process different releases of a software product overlap. Organizations involved in concurrent software development not only experience the dynamics common to single projects, but also face interactions between different releases of their product: they share resources among different stages of different projects, including customer support, they have a common code base and architecture that carries problems across releases, they use the same capabilities, and their market success in early releases impacts their resources in later ones. Drawing on two case studies we discuss some of the feedback processes central to concurrent software development and build a simple simulation model to analyze the resulting dynamics. This model sheds light on tipping dynamics, the nature of inter-project feedback loops, and alternative resource allocation policies relevant to management of concurrent software development. Copyright © 2009 John Wiley & Sons, Ltd. Syst. Dyn. Rev. 25, 224–249, (2009)
Introduction Despite the significant economic incentives and large amount of research and publication on best practices, many software organizations fail to deliver on their promises, while a few achieve outstanding results. In fact significant performance heterogeneity has persisted across different firms for a long time1 (Moløkken and Jørgensen, 2003) and only a small fraction of new firms join the ranks of the most successful. For example, in just a decade, less than 1 percent of Indian software fi rms that became active in the software export business have outperformed others to now account for 60 percent of Indian software export revenue (Ethiraj et al., 2005). To understand the variability in software development performance, system dynamics has been used to model and simulate software development projects (Abdel-Hamid and Madnick, 1989, 1991; Madachy, 2008). Abdel-Hamid and Madnick (1983) fi rst introduced a feedback-based perspective into analysis of software projects and identified some of the core rework processes. They later expanded this work to include explicitly quality assurance, multiple types of errors, experience (Abdel-Hamid and Madnick, 1991) and learning dynamics (Lin et al., 1997). The focus of Abdel-Hamid and colleagues has been a
Industrial and Systems Engineering Department, Virginia Tech, Northern Virginia Center-Rm 430, 7054 Haycock Road, Falls Church, VA 22043, U.S.A. b Avaya Labs Research, 233 Mt Airy Road, Basking Ridge, NJ 07920, U.S.A. * Correspondence to: Hazhir Rahmandad. E-mail:
[email protected] Received January 2008; Accepted February 2009 System Dynamics Review Vol. 25, No. 3, (July–September 2009): 224–249 Published online 31 July 2009 in Wiley InterScience (www.interscience.wiley.com) DOI: 10.1002/sdr.425 Copyright © 2009 John Wiley & Sons, Ltd
224
H. Rahmandada and D. M. Weiss: Dynamics of Concurrent Software Development 225
Software Engineering. Dr. Weiss’s principal research interests are in the area of software development processes and methodologies, software design, and software measurement. He is best known for his invention of the goalquestion-metric approach to software measurement, his work on the modular structure of software systems, and his work in software product-line engineering as a co-inventor of the Synthesis and FAST processes. He is co-author and co-editor of two books: Software Product Line Engineering and Software Fundamentals: Collected Papers of David L. Parnas.
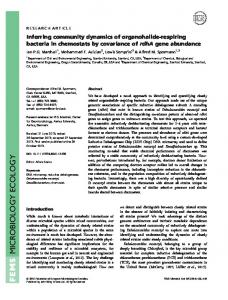
Fig. 1. Concurrent software development process for multiple release products. The introduction of a new release happens between “Testing & Introduction” and “Current Engineering” and “Bug Fixing” activities. All releases build on and use some of the same elements, highlighted on the left
on single-project dynamics and the estimation of project size and effort. Weinberg (1994) has qualitatively discussed several feedback processes in software development organizations, with a focus on controlling problematic dynamics. Madachy and colleagues have used system dynamics for tackling different problems in software engineering (Kellner et al., 1999). They focused on separately modeling specific software development issues such as Brooks’ law, morale and burnout, learning, software reuse, and business value (Madachy, 2005, 2008). However, previous studies tend to focus on individual projects and few inter-project dynamics are discussed. In this study we document and analyze a few of the feedback processes that cut across multiple software projects within an organization. As a result we use the development organization, rather than the project, as the unit of analysis. This perspective allows us to observe some of the multi-project feedback processes that significantly impact success and failure of software organizations. Figure 1 shows the typical software development process in many software organizations. From popular desktop applications to specialized software for corporate use, the majority of software products come in multiple releases that build on each other and introduce successively better or more feature-rich products. Different releases of a software product are developed and introduced in the market as different projects that include some level of overlap in development time (concurrency). Although the exact development process for a project/release depends on specific organizations and how they work, the basic process is relatively similar across organizations. Each project includes different activities for developing requirements based on the features that are planned to be included in the next release of the software, developing the code to implement those requirements, integrating and testing the software product, and introducing the product into the market. Once a release is introduced, potential defects not discovered and fi xed in the development phase will
Requirements Design Development
SAME: - Resources - Capabilities - Code Base - Architecture
Coding
Testing & Current Engineering Introduction Bug Fixing
Requirements Design Development
Coding
First Release
Testing & Current Engineering Introduction Bug Fixing
Requirements Design Development
Coding
Second Release
Testing & Current Engineering Introduction Bug Fixing
Third Release
Time Published online in Wiley InterScience (www.interscience.wiley.com) DOI: 10.1002/sdr
226 System Dynamics Review Volume 25 Number 3 July–September 2009
surface. Depending on their severity, these defects are fi xed through ad hoc problem solving for specific customers or development of patches for all customers. We call such corrective activities by the development group current engineering (CE). Finally, these bugs are fi xed in the code base for future releases of the software. We separate CE and bug fi xing here given some differences in their dynamic implications, but in practice they are connected activities. Note that although the figure shows the process neatly divided into a set of separate phases, in fact the activities overlap in ways that are difficult to represent in a simple diagram. What distinguishes this study is the explicit treatment of interconnections among releases: they build on each other and hence they carry over unresolved problems in product design and code. Moreover, resources (primarily people, but also test labs, equipment, and various other items) are shared between development and CE and thus the quality of past releases influences resource availability for the current and future releases in planning and development. Finally, all the work on different releases is conducted using the same set of organizational routines and capabilities. Repenning (2000) was the fi rst to identify the importance of interactions among multiple product development projects. He showed that if product design and testing are given higher priority in resource allocation than concept design, a temporary resource shortage can lead to sustained decline in future project performance, as lower quality of concept design triggers rework in product design and leaves fewer resources for concept design of the next project, and the cycle continues. Taylor and Ford (2006) demonstrate tipping dynamics in a single project as a result of the impact of schedule pressure on quality. Here we introduce and analyze other coupling mechanisms among different releases of a software product. Specifically, we show how sharing of resources between development and current engineering can lead to dynamics similar to those for concept design and development, and how erosion of development capability and decline in the code base and architecture can contribute to dynamics that drive otherwise similar organizations to face different outcomes. In the next section we discuss the empirical study that motivated the theory-building work reported in this paper. In the third section we discuss a few feedback processes that traverse multiple software releases. Experiments with a simplified simulation model that captures these feedback processes are reported next. Finally, the fifth section discusses the contributions and limitations of this study.
Empirical background and analysis process This study is motivated by two detailed case studies in Sigma,2 a large telecommunications fi rm. The two software products (Alpha and Beta) were selected following a polar research design (e.g., Eisenhardt, 1989). They showed significant differences in their practices and performance outcomes despite being Published online in Wiley InterScience (www.interscience.wiley.com) DOI: 10.1002/sdr
H. Rahmandada and D. M. Weiss: Dynamics of Concurrent Software Development 227
exposed to the same organizational incentives and resource constraints. These cases provide the empirical background to study dynamics of concurrent software development and how those dynamics can lead to different performance trajectories over time.
Case study overview Seventy semi-structured interviews (by phone and in person, ranging between 30 to 90 min), a few development group meetings, and extensive archival data from Alpha and Beta inform the case studies we draw on. Primary data gathering included 48 initial interviews and gathering of archival data. We gathered additional data for elaboration on different themes after 3 months of initial fieldwork. We interviewed members of all functional areas including architects and system engineers, developers, testers, customer service staff, sales support personnel, and marketing personnel, as well as managers at two different organizational levels in several of these areas. Both Alpha and Beta followed a largely waterfall development approach and engaged in concurrent release development (depicted in Figure 1). Alpha develops a real-time telecommunications product that evolved over 8 years and many releases. It has about 120 full-time employees who work in five main locations. It began as a startup and was later acquired by Sigma. We focus our data collection on the years Alpha has been in Sigma. Alpha’s fi rst few releases led the market and it was considered a promising, strategic product for the company. In the last 2 years, however, long delays in delivery and low quality have removed it from its leadership position in the market and have cast doubt on its long-term viability. Alpha shows a curious mode of behavior: typically organizations learn from their experience and improve their performance over multiple projects (Argote and Epple, 1990), yet Alpha illustrates declining performance over time (see Figure 2). It began as a startup that satisfied its customers but over time tended to ignore good development practices in favor of rushing products to market. Review and testing steps early in the development process are compromised under increasing pressure. The development practice departs from the official, espoused, development process guides that call for comprehensive requirements review, development of detailed requirements, design review, code review, and multiple testing and documentation steps during the development process. An experienced developer in Alpha summarizes this pattern: What I have seen is years and years of degradation—getting worse and worse over time.
Growing current engineering load, deteriorating code base, and increasing bug fi xes put increasing pressure on the organization. As a result, multiple metrics Published online in Wiley InterScience (www.interscience.wiley.com) DOI: 10.1002/sdr
228 System Dynamics Review Volume 25 Number 3 July–September 2009
Fig. 2. Alpha’s historical performance on schedule (a), quality (b), and productivity (c). (a) The scheduled fi nished date (y-axis) is graphed against the dates of new reschedules (solid data points). A perfect project will have a horizontal line, while the more sloped lines suggest significant delays. (b) The average number of bugs per customer in the fi rst three months of installation. The slope of the curve is significantly positive, suggesting a gradual decline in quality. (c) The productivity of the Alpha team, expressed in the average number of lines of new code added per person per week, shows a significant decline after year three
of performance (schedule, quality, productivity) all show little improvement or even decline over the last 5 years (see Figure 2). The inter-project dynamics that challenged Alpha are at the core of the motivation for this study. We studied the second case, Beta, to contrast its diverging performance from Alpha, despite similar organizational incentives and resource constraints. Beta is part of a complex telecommunications switch and is developed largely independently of the parent product but is tested, launched, and sold together with it. Beta includes both software and hardware elements and the majority of its over-80-person R&D resources focus on the software part. Contrary to Alpha, Beta organization has maintained several high-quality development practices including early review and testing, careful interface specification, root-cause analysis, and extensive automation of testing. It has therefore avoided the deleterious effect of previous quality problems hurting the current project and as a result it has maintained low defect rates, avoided delays, and has established itself as a reliable and high-quality product. Our field study departs from a controlled experiment: Alpha and Beta are based on different technologies, originated differently, and have different development teams. Because of these structural differences their observed performance heterogeneity can be partially explained by factors other than the feedback structures common to both cases. Therefore Beta is mainly included to enhance the grounding of feedback loops and simulation model in empirical data and to provide a more nuanced understanding of when different feedbacks are important. Published online in Wiley InterScience (www.interscience.wiley.com) DOI: 10.1002/sdr
H. Rahmandada and D. M. Weiss: Dynamics of Concurrent Software Development 229
Analysis process The analysis process for this research consisted of three stages: identifying qualitative feedback loops, building a detailed simulation model, and distilling a simple model from the detailed one to summarize the most important insights and communicate those with the broader audience. This paper shares the output of the last stage. However, we briefly discuss the overall process, to clarify the connection between the case studies and the models discussed here. We used an iterative approach to extract different feedback processes from our field data. Interviewees explained different aspects of software development in their organizations and the factors that contribute to performance (e.g., quality and schedule). The interview data were then transformed into potential causal connections as part of a qualitative model. Previous literature provided a theoretical lens for this interpretation and transformation process. Causal links and loops that were confi rmed by multiple interviewees were then captured in a detailed simulation model. A similar iterative procedure was used for structural validation (Sterman, 2000), extraction of table functions (Ford and Sterman, 1998b), and parameterization of this model to replicate the historical behavior modes (see Figure 2). The detailed model is available elsewhere for interested researchers (Rahmandad, 2005). In the last stage, through sensitivity analysis in the detailed model and consulting the previous studies, we narrowed our focus on the inter-project feedback loops that were both important in the history of our cases and made new contributions to the literature. This subset of feedback loops and the small simulation model that is constructed around them is used in this paper to build theory about reinforcing dynamics in concurrent software development. Given this goal, the simulation model is purposefully much simpler than the two cases or the detailed model. It excludes many factors that are important in fully explaining Alpha and Beta’s evolution, and focuses on how a core set of inter-project feedback processes can lead to tipping dynamics and performance heterogeneity in software development. As such, this paper follows a rich tradition of using case studies and simulation models to build grounded theory (Glaser and Strauss, 1973; Davis et al., 2007) on dynamic social phenomena (e.g., Forrester, 1968; Sterman, 1985; Ford and Sterman, 1998a; Repenning, 2002).
Modeling concurrent software development dynamics In this section we discuss feedback processes that cut across multiple releases of a software product and that we found to be significant in our case studies. While several reinforcing feedback loops have been identified in project management in general (Lyneis and Ford, 2007) and software development in Published online in Wiley InterScience (www.interscience.wiley.com) DOI: 10.1002/sdr
230 System Dynamics Review Volume 25 Number 3 July–September 2009
particular (Abdel-Hamid and Madnick, 1991; Madachy and Khoshnevis, 1997), the focus on feedback effects that cut across different projects and highlight an organization as the unit of analysis distinguish the contribution of this research. We model the development of multiple releases of a software product. New features are added to the backlog of Features Under Development through Feature Request rate. The Feature Release rate identifies the introduction of new versions of the software into the market. This rate depends on multiple factors, including the number of features under development, the development (and testing) of Human Resources available, the gross Productivity of these resources (in terms of features developed per developer per month), the Defect Rate, i.e., quality of work by these resources, and the comprehensiveness and speed of quality control processes used to detect potential defects before release (QC Quality). Release introductions increase Features in Market and, in parallel with feature release, Defect Generation introduces more Defects in Released Code. In reality, feature release often occurs in discontinuous batches (releases). However, for simplicity we represent a smooth flow of features into the market in our modeling work. Several feedback processes were identified from the interview data and observation of the development process in Sigma. In line with previous research, schedule pressure and different organizational reactions to it emerged as a central concept in our analysis (Cooper, 1994; Graham, 2000; Ford and Sterman, 2003; Nepal et al., 2006; Taylor and Ford, 2006). Schedule pressure measures the gap between available Human (and other) Resources required to develop Features Under Development on time, fi x the bugs in previous releases, and invest in capability development. A project that is short of resources, close to a deadline, or has many features to develop could have a high schedule pressure. Working harder is one of the typical reactions to an increased schedule pressure. By working harder the development team can increase its gross Productivity, measured in, say, features per month per developer, and therefore increase the Feature Release rate. That alleviates the pressure through reducing the Features Under Development, closing the balancing loop “Work Harder” or B1 (Figure 3). A potentially troubling side effect of working faster is loss of quality. Under pressure many individuals tend to cut corners and skip beneficial process steps. Such tradeoffs can slow down the long-term feature release rate because they lead to higher Defect Rate. Once discovered in the testing process, these defects should be reworked and therefore slow down the new development activities. This leads to further increase in Schedule Pressure and the reinforcing feedback loop “R1: Rework”. Abdel-Hamid (Abdel-Hamid and Madnick, 1983; Abdel-Hamid, 1990) first identified the importance of these dynamics for scheduling software development projects. Sigma developers identified some of the specific processes that were compromised under schedule pressure to include detailed requirements development (the step between general requirements Published online in Wiley InterScience (www.interscience.wiley.com) DOI: 10.1002/sdr
H. Rahmandada and D. M. Weiss: Dynamics of Concurrent Software Development 231
Fig. 3. Overview of software development process. Multiple effects of schedule pressure on the dynamics of software development are included
developed in design and the coding work), code review (review of code developed by other team members to catch problems), unit testing (testing of specific functionalities a module is supposed to deliver, usually done by developers themselves), and documentation. Problems that are found in the field need to be fi xed through current engineering (CE) and bug fi xing. Solving these problems avoids costly customer dissatisfaction and improves the code base for future releases (“B2: Fixes”). The bug-fixing and CE activities, however, require scarce Human Resources and can lead to further schedule pressure. This in turn increases the defect rate in the next release and the future Defects in Released Code, thus closing another reinforcing loop: “Fixes Need Resources” (R2). This reinforcing loop is different from the previous one in that it crosses multiple releases of a product: defects in previous releases impact resource availability for current release. Alpha’s team frequently spent as much as 30% of their resources on current engineering. In contrast, Beta’s high quality allowed the team to limit current engineering to 10 percent of total resources. If the bugs are not fixed in the code base, the next releases of the software face higher error hazards because old bugs may interact with new features and architectural problems will complicate addition of new capabilities, leading to another reinforcing loop across multiple projects: “Code Base Quality” (R3). In fact, in the last two releases of Alpha the team faced a dilemma: given the low quality of underlying code base and architectural problems, should they scrap the old architecture and Published online in Wiley InterScience (www.interscience.wiley.com) DOI: 10.1002/sdr
232 System Dynamics Review Volume 25 Number 3 July–September 2009
code base and start developing the product anew, or try to utilize the old architecture and accommodate new features by ad hoc solutions? Under schedule pressure the organization opted for the latter option, and thus faced many inefficiencies in the development process. Figure 4 introduces several multi-project reinforcing loops that relate to market performance of the software product and the organizational capabilities. Project performance impacts the resources available to the software organization. We capture this connection through Market Success, which aggregates relevant market performance metrics (e.g., market share, revenue, profitability). For independent organizations, there is a direct link between revenue and available Financial Resources: only a fraction of revenue can be invested back in the organization. For organizational units, such as Alpha and Beta, the link is weaker but still exists. Typically the budget for the organization is a function of its historical performance. Sustained low performance reduces the viability of a product line and cuts its resources in the portfolio of the fi rm’s investments, while star products are in a better position to negotiate expansion of their resources. Indeed Alpha’s initial market success triggered its acquisition by the Sigma organization, and fueled continued investment in the product for several years. However, in Alpha’s case, the resources given to the organization were not cut quickly in the face of later poor market performance. A combination of overoptimistic future performance predictions by Alpha Fig. 4. Dynamics of market success and software development capability. Note that only causal links critical to the discussion at hand are included
Published online in Wiley InterScience (www.interscience.wiley.com) DOI: 10.1002/sdr
H. Rahmandada and D. M. Weiss: Dynamics of Concurrent Software Development 233
managers and perceived strategic significance of presence in Alpha’s market niche helped sustain resource flow to the organization. Market Success is influenced by project performance in several ways. Products with high levels of Defects in Released Code require additional costs for service and maintenance in the market place, thus negatively impacting Market Success and resource availability. Market success is also directly impacted when the product is known for poor quality in the market and sales (or price premium) is compromised as a result. Lower market success in turn limits the available resources and can trigger disruptive pressures, thus closing two reinforcing loops: “R4: Life Cycle Costs” and “R5: No Money”. Another important concept in our analysis is the organization’s software Development Capability. Development capability represents the routines and elements that allow the development organization to produce high-quality software. It consists of many factors, including, but not limited to, the skills of the individual members, the robustness of the development and testing processes used, the availability of automated testing capabilities, and the accessibility and appropriateness of the technology used by the team. Development capability changes relatively slowly, but when it does its impact on Productivity and Defect Rate can be significant. It therefore has an important indirect impact on Market Success and Schedule Pressure in the company. A large body of research in strategy has identified product development as one of the core capabilities essential for success of fi rms in dynamic markets (Eisenhardt and Tabrizi, 1995; Teece et al., 1997). Development capability can be increased through training, process improvement, and tool development inside the organization. Other ways include experiential learning in communities of practice and learning from examples of other successful groups. Activities contributing to capability building are often compromised under schedule pressure, or in the absence of fi nancial resources, leading to the reinforcing loop “R7: Capability Building”. Development capability increases productivity and quality of development activities by establishing robust processes and providing tools that facilitate software development. Faster and error-free development allows for lower schedule pressure and better financial performance, thereby freeing up resources to be spent on building the capability further (Crosby, 1996). This reinforcing loop is identified as “R8: Robust Processes”. Product development capability also helps develop products with better maintainability, compatibility, configurability, serviceability, and installability. These characteristics enhance the attractiveness of the product in the market and lead to better sales, “R6: Peripheral Capabilities”. Alpha and Beta differed significantly in their development capability. Beta had successfully integrated many automated elements in their processes and actively encouraged team members to build new tools that could improve the quality and productivity of the group. Under sustained schedule pressure, little capability-building activity was conducted in Alpha on a regular basis. Published online in Wiley InterScience (www.interscience.wiley.com) DOI: 10.1002/sdr
234 System Dynamics Review Volume 25 Number 3 July–September 2009
Finally, a subtle but important organizational impact of having many Defects in Released Code is on the incentive structures in the organization. Highquality organizations can drill down to the root causes of the few bugs they find after the release of the product, distinguish the problematic processes and individual practices, and remedy these root causes to avoid future recurrence. This was indeed actively pursued in Beta. On the other hand, product groups overwhelmed by many quality issues have little opportunity to find the root causes and tie individual incentives to the quality of their work. In fact, in such organizations fi refighters, the members who save the customers in trouble, are often recognized to the detriment of those who strive to produce a highquality product in the fi rst place. Such organizational structures systematically reward practices that ignore quality in original development and shift the resources towards fi xing the problems once the product is released and the damage is largely done (“R9: No Time to Trace”).
Simulating dynamics of concurrent software development In this section we analyze, through simulation experiments, the implications of some of the qualitative feedback processes developed in the preceding. We use a stylized simulation model that focuses on a subset of the inter-project feedback loops to find out if, and how, these loops can induce diverging performance across organizations involved in concurrent software development (Figure 5). This model therefore leaves out many of the nuances in our Fig. 5. The feedback structure of the simulation model. Not all connections are shown.
Published online in Wiley InterScience (www.interscience.wiley.com) DOI: 10.1002/sdr
H. Rahmandada and D. M. Weiss: Dynamics of Concurrent Software Development 235
cases: it assumes fi xed Human Resources and Feature Requests, uses generic parameter values not calibrated to either case, and assumes constant sales. Therefore the main dynamics in the simulations following arise from the tradeoffs in allocating limited organizational resources among new development, capability building, current engineering, and bug fixing. In the base case we assumed these activities have equal priority in the allocation of resources. Desired resources for capability investment are assumed to replenish erosion of capabilities and allow for a moderate growth. The balance of desired vs. available resources determines the schedule pressure, which in turn impacts the rates of change in different stock variables. Figure 5 represents the main feedback processes we capture in the simulation model. The full model with documentation is available in supporting material for download and independent experiments. In the following experiments we simulate an organization that is originally in dynamic equilibrium; that is, the total resource requirements for new development, capability growth, bug fi xing, and current engineering is balanced with the available resources and therefore the Features Under Development, Defects in Released Code, and Development Capability are roughly constant.3 We then expose the organization to a temporary increase in Feature Request, raising the demand for new features by 10 units for a period of one month, before returning to the initial Feature Request of five. The reaction of the simulated organization to this input informs the stability of the organization and the dynamics of its capability and performance. We report the performances of three variables that illustrate different characteristics of the organization. Feature Release is used as a proxy for the performance of the development organization. It reports how many features per month are released to the market by the development organization. Development Capability reports on the quality and robustness of the underlying development practices. Finally, we define Total Costs of Recovery as the person-months of resources needed to take the organization back to its original equilibrium. This measure includes the costs of developing the pending features (to catch up with market demand), fi x the problems in the released code, and take the capability back into its original state. Conservatively, we measure these costs assuming base level quality and productivity.4 Firefighting in concurrent software development Figure 6 shows the base case performance of the simulated organization. The graph shows four different variables in three separate graphs, where Feature Request (curve labeled 2) is replicated in all of the graphs. Note that we are showing feature release continuously, despite real market introduction usually occurring in batches (in our cases about 30–50 features per release, taking about 6–10 months to complete). The short-term surge triggers a surprising chain of events. The increase in Features Under Development moves resource Published online in Wiley InterScience (www.interscience.wiley.com) DOI: 10.1002/sdr
236 System Dynamics Review Volume 25 Number 3 July–September 2009
Fig. 6. Base case dynamics. The three metrics of performance are reported along with the pulse feature demand input to the system (follows the scale in graph (a), repeated in all graphs). The y-axes are: (a) feature release in feature/month; (b) “Development Capability”, which is dimensionless; (c) “Total Costs of Recovery”, expressed as Month × Person. Feature release saturates at a low level, but total cost of recovery (and features under development) continue to grow
allocation towards development activities, to the detriment of investment in the capabilities. While a short-term increase in Feature Release is achieved because of higher demand and increased productivity under schedule pressure (loop B1 in Figure 3), that advantage gradually fades as the side effects of increased defect rate (loop R1 in Figure 3) and lower capability investment (loops R7–8 in Figure 4) take effect by the end of the fi rst year after the shock. The organization finds itself to be working harder, sacrificing good practices (loop R1), cutting down on competency development (loop R7), and yet (thus) achieving lower feature release rates (Figure 6(a)). The lower feature release further increases the pressure (because the features under development keep accumulating) and erodes capability (Figure 6(b)). These dynamics continue to plague the organization several projects later as the reinforcing loops (including R3, Code Base Quality) completely take over and push the organization to a new mode of development where low productivity, low quality, and high costs are embedded in software development practices. The cost of recovering the organization under these conditions grows fast once the reinforcing loops take over (Figure 6(c)). These dynamics represent the tipping mode of behavior that can dominate an organization under strong reinforcing loops (Repenning et al., 2001). Here a relatively small exogenous change can have a significant impact on the organization and take it to a qualitatively different region of behavior. Following Repenning (2001), we call this mode of behavior fi refighting, in which people are spending most of their time on emergency problem solving, projects are late, the team is under significant pressure, and despite working hard the situation does not improve. These dynamics unfold over relatively long time horizons (years), and thus cross many development projects. This fact highlights the importance of taking the development organization as the unit Published online in Wiley InterScience (www.interscience.wiley.com) DOI: 10.1002/sdr
H. Rahmandada and D. M. Weiss: Dynamics of Concurrent Software Development 237
of analysis, as actions potentially effective in one project (spending more resources on development activity) can prove counterproductive for the organization over the long term (e.g., through the erosion of development capability or degradation of code base). The base case results also reveal how the dynamic hypotheses captured in this model can lead similar organizations to completely different performance outcomes. An unexpected surge in feature requests or current engineering demand, as well as temporary cuts to resources available, can tip an otherwise healthy organization into the slippery slopes of spending less time on capability building or good development practices, and getting into more trouble over the coming releases. Once the organization falls into this mode of behavior, however, the costs of recovery continue to grow and the prospects of a turnaround diminish. This was indeed the daily experience of Alpha towards the end of this study: the product was falling behind the market, resources were limited and likely to shrink because of poor performance, and development capability was low. This left the organization with few viable options to get back on track. Next we consider three aspects of these dynamics: (1) How do the reinforcing processes impact organizational resilience against tipping dynamics? (2) What are the similarities and differences between feedback effects that depend on schedule pressure and those that depend on capability development? (3) How do alternative resource allocation policies impact the dynamics? Virtuous cycles and organizational resilience The impact of a reinforcing loop can be either vicious or virtuous depending on the direction of its activity. Previous experiments highlighted vicious cycles. A reinforcing loop active in the virtuous direction can lead to the accumulation of development capability, reduction in the problems in the released code, and therefore an increase in the potential capability of the organization to create new features. An organization that has benefited from virtuous loops becomes more resilient, that is, it can tolerate much stronger external pressures (e.g., additional demand, lack of resources). Figure 7 shows one such experiment. At time 10 the demand is reduced to zero for one month, to give the organization the slack needed to build its capabilities.5 The virtuous capability-building loops are slow, but they have their impact. After 2.5 years, the organization is tested with a significant, temporary increase in demand (demand going from 5 to 30). Despite the very large shock, which would have devastated the original organization (see Figure 6, where an increase to 15 features tipped the system into firefighting), the organization survives and returns towards its capabilitybuilding mode of operation. As a result of initial slack provided, the reinforcing capability loops are activated in the virtuous direction between months 10 and 40 and lead to increasing levels of development capability (Figure 7(b)). This cumulative capability acts as a safety cushion that comes to the rescue Published online in Wiley InterScience (www.interscience.wiley.com) DOI: 10.1002/sdr
238 System Dynamics Review Volume 25 Number 3 July–September 2009
Fig. 7. Increased resilience after activation of virtuous loops. Items marked “2” are the feature request rate. The organization is given a one-month break at month 10 (zero feature request) to start building capabilities (b). Later, at time 40, a strong pulse of magnitude 25 feature request tests the organizational resilience (feature request’s scale is same as graph (a) in all three figures, and goes over the scale at time 40). The organization recovers from this strong shock (can retain its feature release (a) at/beyond steady-state feature request). Features under development and total costs of recovery (c) never get out of control
of the organization over the next, potentially catastrophic disruption. The next pulse (month 40 in Figure 7) triggers a long period of high pressure (significant increase in features under development) and reduced investment in capability. Nevertheless, the organization survives because it uses its high levels of capability manifested in high quality and productivity levels embedded in individual knowledge, organizational practices, and development tools. Capability is hit during this period (the decline in item b from month 40 to 70), but it remains high enough to overcome the challenge by higher feature release (item a) and get the organization back on track. Schedule pressure and capability impacts The majority of reinforcing feedbacks in our simulation experiments go through schedule pressure or capability development’s impacts on productivity and quality. Schedule pressure feedbacks are faster and thus can unfold within a single project, while the capability dynamics usually take more time to emerge given the inertia of the capability stock. Therefore capability-related feedback processes often work across several projects. We compare the impact of these two different influence pathways in two simulation experiments (see Figure 8). In the fi rst experiment we remove the impact of schedule pressure on productivity and quality, therefore removing feedback loops R1, B1, and R2 (Figure 8(a)). To make the simulations directly comparable with the base case, we fi x the impact of schedule pressure on quality and productivity at their equilibrium, base case levels. In the second experiment, we remove the impact of capability dynamics by fi xing the value of capability stock at its base case level and removing the resources allocated to capability development from the pool Published online in Wiley InterScience (www.interscience.wiley.com) DOI: 10.1002/sdr
H. Rahmandada and D. M. Weiss: Dynamics of Concurrent Software Development 239
Fig. 8. Impact of schedule pressure and capability feedbacks. Feature release (left), development capability (middle) and total cost of recovery (right) are compared with the base case from Figure 6 (marked “2”) for two experiments where (a) impact of schedule pressure is removed at time 10 (top row) and (b) when capability dynamics are excluded (bottom row)
of available resources (Figure 8(b)). These changes effectively cut the loops R7 and R8 (in Figure 4). This experiment resembles an organization that has institutionalized uncompromising capability-building practices such as training, tool building, process improvement, and employee retention programs, and does not allow these processes to be compromised under resource pressures. Figure 8 reports the three performance metrics for these two experiments. In both cases the tipping dynamics persist despite the removal of the other factor. On the other hand, the extent of impact of the two mechanisms is qualitatively different. Schedule pressure changes relatively fast with organizational conditions, and its impact on error rate and productivity can saturate quickly. Once that saturation point is reached, the organization converges to a new plateau in its performance which may not be too far from initial performance levels (e.g., see feature release at top left of Figure 8). Costs of recovery for the organization under these conditions are also mild compared to the base case. In contrast, feedback processes that go through the capabilities can continue to erode quality and productivity for a long time, even if schedule pressure has no direct impact on quality. These dynamics lead to significant long-term costs and a gap between actual and potential performance. As long as resource pressures cut down investments in capability building, the capability stock declines and leads to increasingly lower levels of productivity and Published online in Wiley InterScience (www.interscience.wiley.com) DOI: 10.1002/sdr
240 System Dynamics Review Volume 25 Number 3 July–September 2009
quality. These in turn contribute to further delays and schedule pressure. In effect, productivity and quality are anchored in the current capability of the fi rm. This anchor determines the range of change for productivity and quality under different levels of pressure. Sustained resource pressure, however, can erode the capability, shifting that anchor continuously, in a process similar to erosion of quality norms in service operations (Oliva and Sterman, 2001). This process can lead to the institutionalization of poor development practices in an organization. In fact some of the older Alpha employees pointed out that, given the current, inefficient development processes, new employees do not have an opportunity to observe more effective procedures for software development and therefore cannot internalize some of the basic capabilities and skills. These experiments further highlight the significance of taking the software development organization as the unit of analysis. Because capabilities reside in organizational routines and practices that change only slowly and in the span of multiple development projects, their impact on performance of software projects is also best seen across multiple projects. While effect of schedule pressure on quality is more salient and influential within a single project, the capability dynamics tie together multiple projects in a reinforcing cycle of capability–performance–resource demand for bug fi xing and development and resource availability for capability investment. The long-term impact of this feedback process on tipping dynamics in software development organizations can be quite substantial. Impact of alternative resource allocation policies In the analysis so far, we have assumed that investment in development, current engineering, capability building, and bug fixing have similar priorities, thus resource pressure impacted these activities similarly. This assumption is helpful in understanding the basic dynamics without complications arising from alternative priority settings. However, in practice organizations often have different priorities for different activities. For example, Alpha had a fairly high priority for current engineering activities because customers were directly affected by current engineering. They demanded quick reaction from the Alpha team to fi x the problems in the field as soon as those problems were observed. In fact Alpha often used resources otherwise devoted to development for taking care of surges in current engineering demand. Beta, in contrast, gave higher priority to development and capability building. Alternative allocation policies also inform managerial interventions aimed at reducing risks and costs of tipping dynamics. We therefore conduct a set of experiments in which we change the priority of different investment options at month 10, when the external shock is introduced, and track the resulting performance of the simulated organization. For this purpose we increase the priority of each activity, i.e., development, current engineering, capability Published online in Wiley InterScience (www.interscience.wiley.com) DOI: 10.1002/sdr
H. Rahmandada and D. M. Weiss: Dynamics of Concurrent Software Development 241
building, and bug fi xing, in a separate experiment. In each experiment the activity with the high priority will be fi rst in line for receiving the resources it desires. The three remaining activities will then share the remaining resources proportional to their demand. Figure 9 reports the results of these experiments. A few characteristics of these results inform our discussion. First, giving high priority to development (fi rst row in Figure 9) is most successful in increasing short-term feature release, e.g., rescuing the current release from delays. However, by ignoring the development capability, the organization may still be pushed into the fi refighting mode of behavior and in fact face lower long-term performance than the base case. Overall this can lead to significant costs for the organization. Not surprisingly, raising the priority of current engineering (second row) does not help any of the performance metrics we track. It hurts both the feature release and the capability and therefore leads to more costs than the base case. It should, however, be noted that we are not tracking customer satisfaction and loyalty, which are the main outcomes benefiting from higher priority of current engineering. The impact of those factors on sales and therefore market success may somewhat raise the value of current engineering. Nevertheless, as long as development capability declines because of resource pressures, the organization will tip into the firefighting mode of behavior and will underperform its potential. Raising the priority of capability development beyond other activities (third row) promises the best long-term outcomes. The tipping dynamics are avoided, at the cost of the short-term decline in feature release compared to the base case. The reason is that by allocating all the desired resource for the capability development activities the organization grows its capability and thus its productivity and quality. While the schedule pressure induced by the temporary shock at time 10 lowers quality and thus feature release, over longer times the increased capability more than compensates for that loss. Further analysis shows that this allocation policy immunizes the organization for much larger shocks as well. However, very large shocks (e.g., 100 new features, rather than the 10 used in these experiments) will still force the organization into fi refighting, as the short-term reduction in quality will lead to a growing level of defects in the code base that will activate the Code Base Quality (R3) loop. Once the integrity of underlying architecture and code base is compromised, the organization faces an uphill battle in building new products on a shaky foundation. The long-term impact of R3 is further highlighted by the last experiment, where bug fi xing is given the highest priority. In this case, even though the allocation policy does not stop tipping, it can reduce its impact by keeping the code base from accumulating too many defects and therefore keeping the defect rate under control because of underlying code base and product design. These results raise an empirical dilemma: if capability development merits higher priority, why in practice do many organizations (such as Alpha) not follow this allocation policy? One answer may lie in the alignment of capability Published online in Wiley InterScience (www.interscience.wiley.com) DOI: 10.1002/sdr
242 System Dynamics Review Volume 25 Number 3 July–September 2009
Fig. 9. Alternative priority-setting policies. Left column indicates the activity that has been assigned the highest priority in the simulation results reported in that row. Three metrics of performance—feature release (left), development capability (middle), and total cost of recovery (right)—are reported for the base case (marked “2”) against the alternative priority level case (marked “1”). The performance for the fi rst few months after the shock is of special importantance because it contains the most salient information cues managers receive
Published online in Wiley InterScience (www.interscience.wiley.com) DOI: 10.1002/sdr
H. Rahmandada and D. M. Weiss: Dynamics of Concurrent Software Development 243
development with general fi rm strategy. Whereas the operational excellence that comes with capability development is the strategic thrust for some fi rms, others may put higher emphasis on innovation or customer intimacy (Rifkin, 2001) and thus sacrifice quality, cost, or time to market for other goals. Our case studies suggest that at least two other mechanisms contribute. First, the incentive structures in Alpha (and many software organizations in general) are such that current engineering gets a high priority. Customers in need of help are vocal and visible to the higher management. Developers who save a customer in crisis gain favor with higher management which is sensitive to customer input. Moreover, the quality of work is hard to detect when the development work is being done, and therefore it is hard to reward developers for their high-quality work in the fi rst place. Also, with a growing number of problems in the field, the opportunity to trace the root causes of problems and assign responsibility to individual developers shrinks, exacerbating the incentive problem through the No Time to Trace (R9) loop. Second, the speed and salience of feedback received from each activity can introduce a bias against less salient or more delayed activities. Current engineering brings quick and clear rewards (customer satisfaction, management attention), development brings reward with some delay (when the project is successfully completed), and bug fi xing and capability development have even longer and more obscure connections between resource investment and observation of results. Research has shown that people tend to learn the wrong lessons in the presence of delays and feedback complexities, often to the detriment of long-term options (Sterman, 1994; Repenning and Sterman, 2002; Rahmandad, 2008).
Discussion Allocation of scarce organizational resources is at the core of management (Mahoney and Pandian, 1992). In this study we draw on two case studies to examine a variety of feedback processes that drive resource allocation tradeoffs in many software development organizations. Our analysis shows how several reinforcing loops that cut across multiple projects can drive a wedge between successful and unsuccessful development groups. Next we specify important boundary assumptions and limitations of the study followed by discussion of the contributions. Boundary assumptions and limitations The empirical base for this research comes from only two case studies. Even these two cases differed in their technological factors, managerial experience, and initial conditions. Therefore their diverging performance over time may be partially explained by factors other than the tipping dynamics discussed here. However, our analysis establishes that even in the absence of such structural Published online in Wiley InterScience (www.interscience.wiley.com) DOI: 10.1002/sdr
244 System Dynamics Review Volume 25 Number 3 July–September 2009
differences the dynamics resulting from capability erosion or schedule pressure effects, through inter-project feedbacks, can tip otherwise identical organizations into significantly different performance domains. In this section we discuss some of the main assumptions in our analysis and how they impact the application of our results. Development process The overlapping release schedule increases the interaction between different releases and the tradeoffs between different activities of development, e.g., requirements planning, development, and current engineering of different projects. Therefore the feedback loops that relate to tradeoffs across different activities of the development process (e.g., R3: Fixes Need Resources) are most salient at higher levels of concurrency in the development process. Moreover, the groups we studied largely followed a waterfall development approach. While most of the dynamics discussed in this paper apply to the continuum of waterfall to iterative development processes, the definition of “Development Capability” is largely contingent on the development process at hand, and operational advice should be tailored accordingly. Product characteristics We studied products with multiple releases developed in a single organization. A growing code base exists for such products that impact new development. Moreover, the market success of previous releases impact the performance and resource availability for the future releases. Organizations that work on a singlerelease product do not face the feedback processes that are dependent on the multiple-release characteristic or the underlying code base. Also the value of quality and therefore the importance of investing in capabilities, current engineering, or development depends on the nature of product. Mission-critical products such as communication switches demand much higher quality levels throughout the development process, which reduces the impact of feedback loops related to problems in the field and underlying code base. Market characteristics Our cases come from relatively stable and mature markets where competitors compete over efficient development practices and small efficiency gains are critical to success. However, emerging markets often call for different approaches. Defining customer requirements becomes critical, innovation may be central, and fast and aggressive response benefits early movers through multiple learning and network effects (Majd and Pindyck, 1989; Katz and Shapiro, 1994; Fudenberg and Tirole, 2000). These additional feedback processes may alter some of the policy conclusions and actions indicated when extending results to emerging markets. Similarly, startup fi rms have very limited cash and their main goal is to reach the release of the product in the market before the seed money runs out. Capability development is often not highest Published online in Wiley InterScience (www.interscience.wiley.com) DOI: 10.1002/sdr
H. Rahmandada and D. M. Weiss: Dynamics of Concurrent Software Development 245
on their priority list and they may correctly prefer to sacrifice many of the longterm dynamics in order to survive until the revenue stream starts to flow (Rahmandad, 2007). Some other limitations should be noted in the application of these results. The model presented here is very simple with generic parameter values. Empirical estimation of the strength and speed of different feedback processes is an important extension of this work. While detailed time series data required for such estimation are hard to collect, the theoretical and operational contributions of such studies are also great. Additional case studies and large sample empirical analyses are needed to add to the list of important feedback loops and to extend the results into other contexts. More detailed and realistic models can also underlie simulation-based learning environments where managers are put in charge of a simulated software organization and learn from that experience about better real-world management practices (e.g., Sengupta and Abdel-Hamid, 1996). Contributions We identified three major ways through which multiple software development projects interact with each other in reinforcing processes. First, multiple releases of a software product are interconnected because they share resources for development, current engineering, and bug fi xing. Low quality of a previous release can put pressure on development of a current release because it diverts resources to current engineering and bug fi xing. Moreover, different releases are connected through the accumulating code base and product design. Quality of old releases thus impacts the quality of current work. Second, by considering the impact of market performance on availability of organizational resources, we close several reinforcing loops of the “rich gets richer” nature (R4–R6). Finally, the investment and changes in software development capability in the organization are a function of the performance of different projects, and connect them through a common set of routines and practices used across those projects. These findings complement the existing literature by focusing on dynamics relevant to software development organizations with multiple projects. Through simulation experiments, we showed how these multi-project feedback processes lead to tipping dynamics that can push the software organization into an inefficient mode of working harder and achieving less, eroding development capability and market performance (Repenning, 2001; Taylor and Ford, 2006). We introduce new feedback processes to this literature and analyze the impact of alternative resource allocation policies. Understanding tipping dynamics is important because in them lies the critical challenges and opportunities in managing an organization. Where these dynamics exist, small interventions can have disproportionate impacts and lead to qualitative differences across organizations. Strong reinforcing loops are therefore associated with strategic opportunities and challenges in different markets (Achi et al., 1995) such as Published online in Wiley InterScience (www.interscience.wiley.com) DOI: 10.1002/sdr
246 System Dynamics Review Volume 25 Number 3 July–September 2009
path dependencies (Arthur 1989), network and complementary goods effects (Cusumano et al., 1992), and learning curves (Argote and Epple, 1990). Firms that understand these dynamics and build their strategies around benefiting from reinforcing loops and avoiding their negative consequences can gain and sustain strategic advantage over their competitors. Beyond theory-building research that identifies important reinforcing loops, system dynamics can contribute to this literature by (a) quantifying the strength of different feedback processes through quantitative parameter estimation and (b) designing and testing control policies that monitor the right variables with measures sensitive to organizational politics and offer appropriate managerial responses contingent on the state of an organization. Several practical implications follow. Given these tipping dynamics, the core managerial challenge is to avoid, under pressure, capability erosion and quality sacrifice that tips the software organization into fi refighting. Three broad strategies can support this goal. First, priorities should be set to put enough emphasis on capability building and core product development activities. Priority setting should go beyond management mandate and should tie individual incentives to the quality of their work and their investment in capability building, e.g., through root cause analysis, dedicated learning time, and social sanctions against poor quality in code delivered (Cusumano and Selby, 1995). Furthermore, it is important to identify and schedule capabilitybuilding projects to be undertaken at times of relative low workload, which occur frequently between project peaks. It is also important to seal off the development team from customer pressure to avoid a bias in favor of (otherwise inefficient) current engineering and bug-fi xing activities. This should be designed carefully into the process because, on the other hand, communication with customers is critical for developers to better understand customer requirements in upstream design and development phases. Second, the current levels of work pressure and work quality should be monitored on the ground to provide timely signals to management if the organization moves towards firefighting. The metrics monitored for this purpose should be different from those used in the performance review process, so that honest communication of potential problems is not discouraged. In general, enhancing communication between management and the development teams is critical for timely identification of, and reaction to, possible slips. Moreover, projects often face surprises that can lead to tipping dynamics; planning explicit buffer times in the project schedule is important to control this risk. Finally, our analysis suggests that taking more work than its capacity is a significant contributor to an organization’s risk of falling into fi refighting dynamics. Some possible recommendations to avoid this imbalance include using better estimation processes to match workload with organizational capacity and establishing stringent criteria for starting new projects. The latter issue is important because given commitment escalation and sunk cost dynamics it is Published online in Wiley InterScience (www.interscience.wiley.com) DOI: 10.1002/sdr
H. Rahmandada and D. M. Weiss: Dynamics of Concurrent Software Development 247
behaviorally much easier not to start a project than to stop one later when the organization finds itself unable to handle the workload (Schmidt and Calantone, 1998).
Notes 1. Biannual survey of IT projects by Standish Group 1994–2006 shows continued and significant performance heterogeneity (http://www.standishgroup.com/). 2. Pseudonyms are used for organization and products for privacy reasons. 3. The structure of this nonlinear system does not include a nontrivial equilibrium, but behavior very close to equilibrium is attainable for time horizons of interest. 4. Productivity and quality are likely to be less than base levels for an organization recovering from poor performance (given the eroded capability); therefore using base levels gives conservative estimates. 5. Alternatively we could increase available resources temporarily and get very similar results.
Supporting information Supporting information may be found in the online version of this article.
Acknowledgements We thank Nelson Repenning, John Sterman, Michael Cusumano, David Ford, three anonymous reviewers, and seminar participants at MIT for valuable feedback on the research related to this paper. We thank Jon Bentley and Tarek Abdel-Hamid for helpful comments on an earlier draft. We thank research participants for their generosity with their time and information in supporting this study. Partial fi nancial support for this research was provided by Avaya Inc.
References Abdel-Hamid TK. 1990. Investigating the cost schedule trade-off in software development. IEEE Software 7(1): 97–105. Abdel-Hamid TK, Madnick SE. 1983. The dynamics of software project scheduling. Communications of the ACM 26(5): 340–346. ——. 1989. Lessons learned from modeling the dynamics of software development. Communications of the ACM 32(12): 1426–1455. ——. 1991. Software Project Dynamics: An Integrated Approach. Prentice-Hall: Englewood Cliffs, NJ. Published online in Wiley InterScience (www.interscience.wiley.com) DOI: 10.1002/sdr
248 System Dynamics Review Volume 25 Number 3 July–September 2009
Achi Z, Doman A, Sibony O, Sinha J, Witt S. 1995. The paradox of fast growth tigers. McKinsey Quarterly 1995(3): 4–17. Argote L, Epple D. 1990. Learning-curves in manufacturing. Science 247(4945): 920–924. Arthur WB. 1989. Competing technologies, increasing returns, and lock in by historical events. Economic Journal 99(1): 116–131. Cooper KG. 1994. The $2,000 hour: how managers influence project performance through the rework cycle. Project Management Journal 15(1): 11–124. Crosby PB. 1996. Quality is Still Free: Making Quality Certain in Uncertain Times. McGraw-Hill: New York. Cusumano MA, Mylonadis Y, Rosenbloom RS. 1992. Strategic maneuvering and mass-market dynamics: the triumph of VHS over Beta. Business History Review 66(1): 51–94. Cusumano MA, Selby RW. 1995. Microsoft Secrets: How the World’s Most Powerful Software Company Creates Technology, Shapes Markets, and Manages People. Free Press: New York. Davis JP, Eisenhardt KM, Bingham CB. 2007. Developing theory through simulation methods. Academy of Management Review 32(2): 480–499. Eisenhardt KM. 1989. Building theories from case study research. Academy of Management Review 14(4): 532–550. Eisenhardt KM, Tabrizi BN. 1995. Accelerating adaptive processes: product innovation in the global computer industry. Administrative Science Quarterly 40(1): 84–110. Ethiraj SK, Kale P, Krishnan MS, Singh JV. 2005. Where do capabilities come from and how do they matter? A study in the software services industry. Strategic Management Journal 26(1): 25–45. Ford DN, Sterman JD. 1998a. Dynamic modeling of product development processes. System Dynamics Review 14(1): 31–68. ——. 1998b. Expert knowledge elicitation to improve formal and mental models. System Dynamics Review 14(4): 309–340. ——. 2003. The Liar’s Club: concealing rework in concurrent development. Concurrent Engineering: Research and Applications 11(3): 211–219. Forrester JW. 1968. Market growth as influenced by capital investment. Industrial Management Review 9(2): 83–105. Fudenberg D, Tirole J. 2000. Pricing a network good to deter entry. Journal of Industrial Economics 48(4): 373–390. Glaser BG, Strauss AL. 1973. The Discovery of Grounded Theory: Strategies for Qualitative Research. Aldine: Chicago, IL. Graham A. 2000. Beyond PM 101: lessons for managing large development problems. Project Management Journal 31(4): 7–18. Katz ML, Shapiro C. 1994. Systems competition and network effects. Journal of Economic Perspectives 8(2): 93–115. Kellner MI, Madachy RJ, Raffo DM. 1999. Software process simulation modeling: Why? What? How? Journal of Systems and Software 46(2–3): 91–105. Lin CY, Abdel-Hamid T, Sherif JS. 1997. Software-engineering process simulation model (SEPS). Journal of Systems and Software 38(3): 263–277. Lyneis JM, Ford DN. 2007. System dynamics applied to project management: a survey, assessment, and directions for future research. System Dynamics Review 23(2–3): 157–189. Madachy R. 2005. Integrated modeling of business value and software processes. Unifying the Software Process Spectrum 3840: 389–402. Published online in Wiley InterScience (www.interscience.wiley.com) DOI: 10.1002/sdr
H. Rahmandada and D. M. Weiss: Dynamics of Concurrent Software Development 249
Madachy R. 2008. Software Process Dynamics. Wiley: Hoboken, NJ. Madachy R, Khoshnevis B. 1997. Dynamic simulation modeling of an inspection-based software lifecycle process. Simulation 69(1): 35–47. Mahoney JT, Pandian JR. 1992. The resource-based view within the conversation of strategic management. Strategic Management Journal 13(5): 363–380. Majd S, Pindyck RS. 1989. The learning-curve and optimal production under uncertainty. Rand Journal of Economics 20(3): 331–343. Moløkken K, Jørgensen M 2003. A review of surveys on software effort estimation. In IEEE International Symposium on Empirical Software Engineering. Rome, Italy. Nepal MP, Park M, Son B. 2006. Effects of schedule pressure on construction performance. Journal of Construction Engineering and Management ASCE 132(2): 182–188. Oliva R, Sterman JD. 2001. Cutting corners and working overtime: quality erosion in the service industry. Management Science 47(7): 894–914. Rahmandad H. 2005. Three essays on modeling dynamic organizational processes. PhD thesis, Sloan School of Management, MIT, Cambridge, MA. ——. 2007. Why myopic policies persist? Impact of growth opportunities and competition. In International System Dynamics Conference, System Dynamics Society, Boston, MA. ——. 2008. Effect of delays on complexity of organizational learning. Management Science 54(7): 1297–1312. Repenning NP. 2000. A dynamic model of resource allocation in multi-project research and development systems. System Dynamics Review 16(3): 173–212. ——. 2001. Understanding fi re fighting in new product development. Journal of Product Innovation Management 18: 285–300. ——. 2002. A simulation-based approach to understanding the dynamics of innovation implementation. Organization Science 13(2): 109–127. Repenning NP, Goncalves P, Black LJ. 2001. Past the tipping point: the persistence of fi refighting in product development. California Management Review 43(4): 64–68. Repenning NP, Sterman JD. 2002. Capability traps and self-confirming attribution errors in the dynamics of process improvement. Administrative Science Quarterly 47: 265–295. Rifkin S. 2001. Why software process innovations are not adopted. IEEE Software 18(4): 112. Schmidt JB, Calantone RJ. 1998. Are really new product development projects harder to shut down? Journal of Product Innovation Management 15(2): 111–123. Sengupta K, Abdel-Hamid TK. 1996. The impact of unreliable information on the management of software projects: a dynamic decision perspective. IEEE Transactions on Systems Man and Cybernetics Part a: Systems and Humans 26(2): 177–189. Sterman JD. 1985. A behavioral-model of the economic long-wave. Journal of Economic Behavior and Organization 6(1): 17–53. ——. 1994. Learning in and about complex systems. System Dynamics Review 10(2–3): 91–330. Sterman J. 2000. Business Dynamics: Systems Thinking and Modeling for a Complex World. McGraw-Hill: New York. Taylor T, Ford DN. 2006. Tipping point failure and robustness in single development projects. System Dynamics Review 22(1): 51–71. Teece DJ, Pisano G, Shuen A. 1997. Dynamic capabilities and strategic management. Strategic Management Journal 18(7): 509–533. Weinberg GM. 1994. Quality Software Management: Systems Thinking. Dorset House: New York. Published online in Wiley InterScience (www.interscience.wiley.com) DOI: 10.1002/sdr